


Geotab smart intersection insights: Data-driven traffic signals in Las Vegas
Table of contents
The Las Vegas Challenge
Clark County is currently home to 2.3 million residents, with 50,000 people moving in each year. It has experienced the largest population growth in the US between 2000-2015. Additionally, the region is a premier tourist destination worldwide, attracting over 42 million visitors a year to the region’s spectacular manmade and natural attractions.
All of this contributes to large and growing traffic volumes and associated surface congestion:
- According to the Las Vegas Convention and Visitors Authority (LVCVA) as of October 2019, the average number of visitors per month is 3.6 million people
- Daily traffic figures show an average of 119,068 vehicles on Las Vegas highways, ~2% higher than 2018 values
A study conducted in October 2016 by TRIP, a national transportation research firm, showed driving on congested roads in Las Vegas costs the average motorist $1,744 annually in vehicle operating costs due to an increase in fuel consumption, vehicle wear and tear, and collisions. Furthermore, it is estimated that this same congestion contributes another $883 annually in lost wages, for a total of $2,627 annually. Even when motorists aren’t directly paying for the true costs of surface congestion, traffic has additional effects that are hard to quantify, including an increase in vehicle emissions and greenhouse gases.
In a Southern Nevada Traffic Study completed by the Nevada Department of Transportation in November 2018, data was gathered and analyzed on how to improve Las Vegas traffic along key corridors and system interchanges. Among the results of the report, the study suggested infrastructure improvements costing $1.37 billion. These expensive recommendations targeted the growing problem of surface congestion, and helped to quantify the socioeconomic value of reducing local traffic related injuries and fatalities, travel times, and improving the movement of commercial goods.
The Las Vegas Opportunity
The Las Vegas region is quickly emerging as a smart city innovator. The growing city continually strives to utilize cutting edge technologies to improve quality of life for its residents and visitors. Much of these efforts are focused on improving the efficiency and safety of the local transportation network via targeted investments in Intelligent Transportation Systems (ITS). Within the ITS marketplace, traffic modelling and artificial intelligence (AI) are playing a growing role as a means to monitor and manage roadside traffic infrastructure. Specifically, connected-vehicles (CVs) are becoming an amazing source or traffic data which can be used to generate the necessary transportation insights.
These insights equip traffic engineers with the necessary intelligence to more efficiently move residents and commercial goods, implement and effectively manage traffic calming and road improvement projects, and proactively deploy first responders to critical areas in an effort to reduce on-site arrival times.
RTC’s Next Generation Transportation Network
Geotab, along with Waycare and the Regional Transportation Commission of Southern Nevada (RTC), are collaborating to create a first-of-its-kind product that utilizes data-driven analytics and actions to support traffic signal operations.
Each partner contributes a unique set of skills to the collaboration:
- Geotab anonymously aggregates data from over 60,000 connected-vehicles in the region that generate more than 2 billion records per day; Geotab mashes this data up with a myriad of third-party sources and applies the necessary machine learning and analytics to generate traffic insights that characterize traffic signal performance.
- Waycare integrates the Geotab data directly into its AI-based traffic management platform and creates predictive models that inform RTC traffic signal operators.
- Staff at the RTC traffic management center use the results to create traffic signal timing plans that measure performance related to safety, efficiency, and throughput for travelers and trip purposes.
“For over a year, we have gathered a huge amount of data from connected-vehicles. Now we are in the process of combining the capabilities of Waycare while using Geotab’s data-driven insights to determine how to solve problems based on the accumulation of mass data. By implementing automation into our strategy that has been proven through advanced modeling, we will see net benefits to the flow and safety of Las Vegas traffic.”
-Brian C. Hoeft, P.E., Director of Traffic Management Center for RTC of Southern Nevada
Data-Driven Traffic Signal Coordination Schemes
Traditional traffic engineering efforts rely on traffic simulation tools to evaluate signal infrastructure performance. However, the simulated results are only as good as the data and corresponding analytics that are supplied. As an example, traffic flow diagrams such as the one shown in Figure 1 below are used by traffic signal operators to coordinate traffic along a targeted corridor for the purpose of balancing safety with efficiency and throughput. This is achieved by implementing progressive traffic signal phases that allow vehicles to travel as platoons through a corridor without stopping.
In Figure 1, the platoon speed (indicated in blue) is a critical input to traffic coordination design as it dictates the required cycle lengths, offsets and splits for the corridor. Various data collection techniques are used to calculate median free flow speeds as a proxy for platoon speed, however these traditional methods typically do not capture the statistical distribution in vehicle speeds along the targeted corridor. Similarly, emerging techniques such as the Purdue Method for Signal Performance, which focuses on discrete data obtained from the traffic signal software and hardware, are also ineffective at exposing this distribution. As a result, Geotab and RTC are developing a new approach to traffic signal coordination that combines signal system data with connected-vehicle insights to greatly enhance signal timing efficiency.
Figure 1: Simulated traffic flow diagram

As an example, see below for a real distribution of vehicle speeds along the Cheyenne Ave corridor in Las Vegas, running between North Rancho Drive and the Las Vegas Freeway (Interstate 15). This bimodal distribution is a typical one as vehicles naturally cluster into larger slower moving vehicles or smaller faster moving ones. This information is a critical input into any traffic signal progression model. The next step is to identify the peak periods for heavy duty and light duty vehicles and coordinate signals accordingly. This data may inform us that it is more valuable to favor light duty vehicles during the traditional morning and afternoon commute times versus heavy duty vehicles during the very early mornings and midday.
Figure 2: Cheyanne Avenue corridor
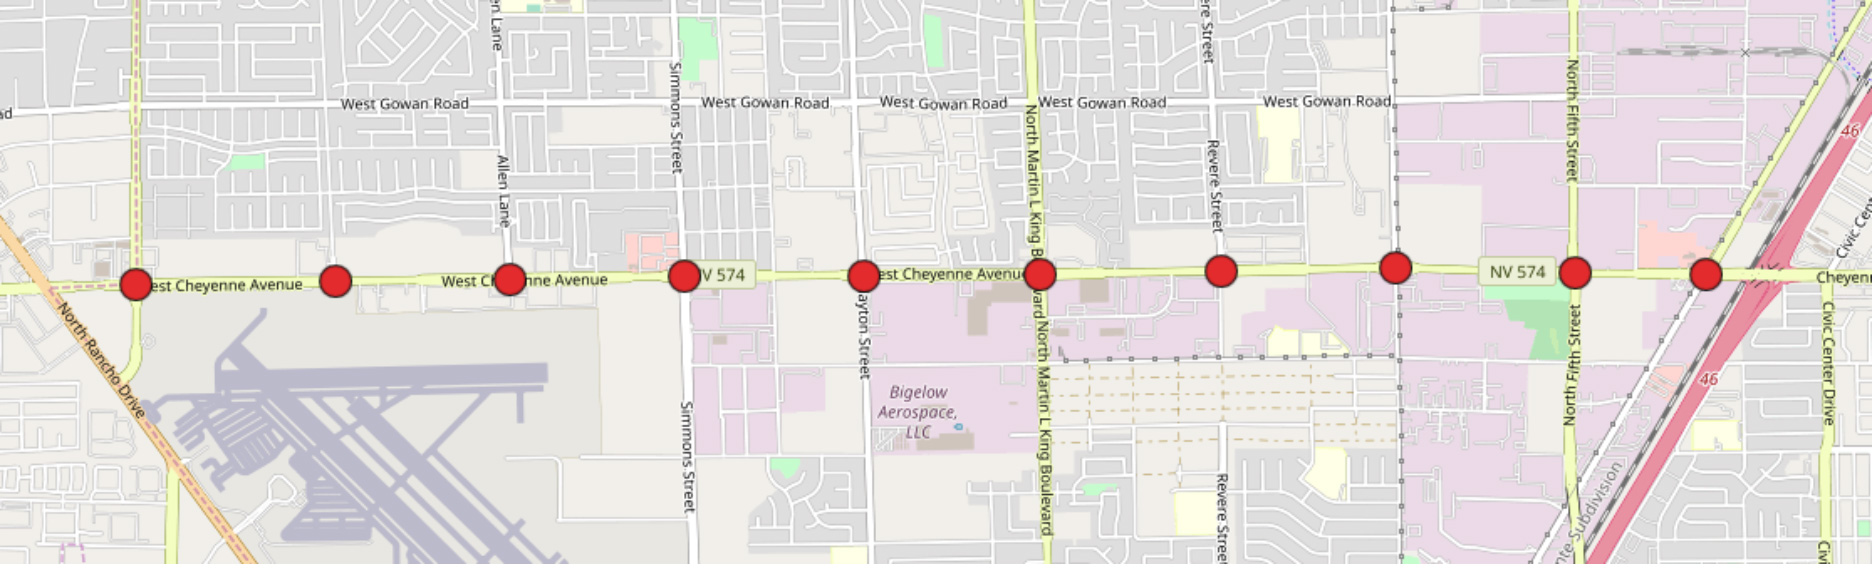
Figure 3: Histogram of average vehicle moving speed
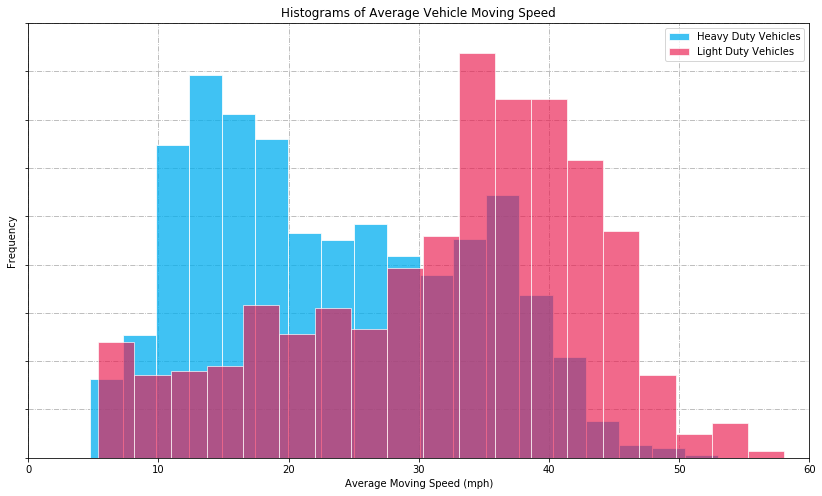
So what platoon speed should we use? And when should it be used? The Cheyenne corridor is a great example of a corridor that has a higher proportion of heavy vehicles, compared with other corridors that emphasize personal or consumer vehicle trips. By coordinating signals for a statistical average or median speed (28 mph for example), traffic management staff are not directly prioritizing either vehicle class. Similarly, by prioritizing light duty vehicles, heavy duty vehicles are indirectly punished. See Figure 4 for an illustration of this conundrum.
Figure 4: Traffic flow diagram showcasing bimodal speed distribution

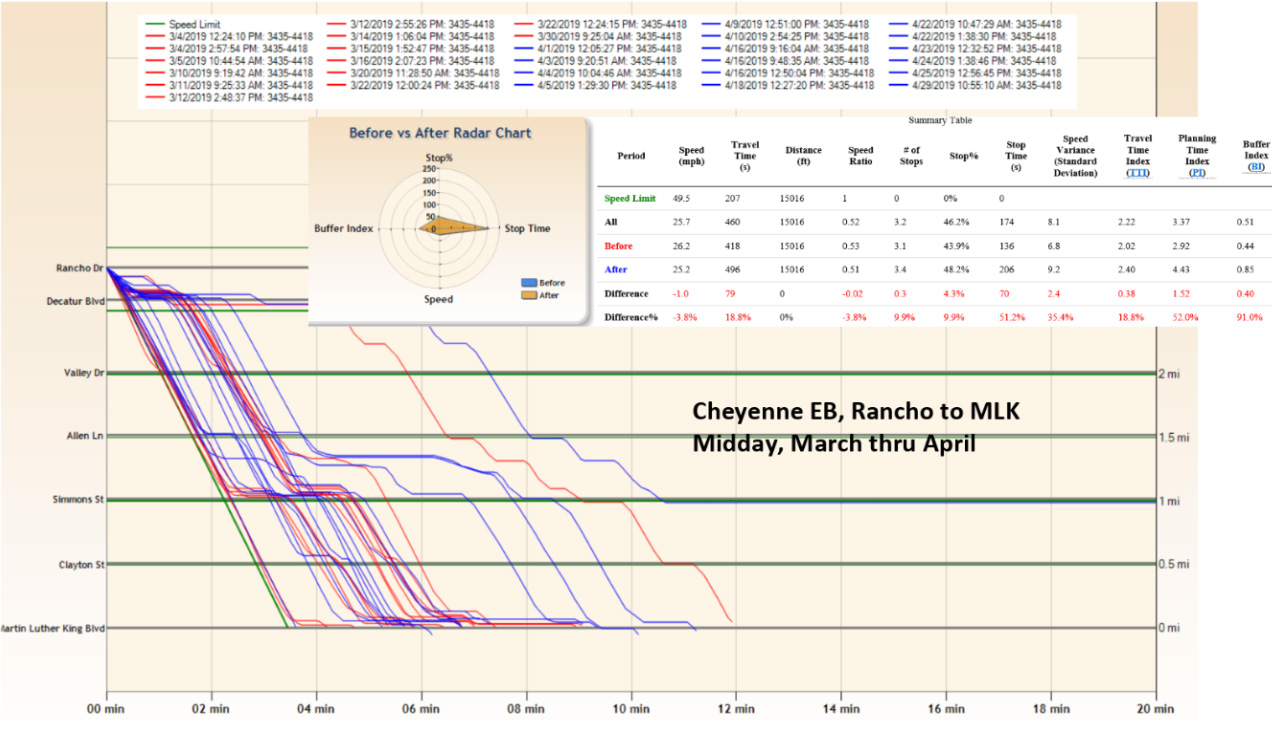
This trend is further illustrated in RTC’s trajectory plots shown in Figure 5, where you see actual vehicle trajectories and travel profiles through the Cheyenne Ave corridor. Note that some vehicles take much longer than would otherwise be expected to traverse the corridor.
Figure 5: RTC trajectory plots and travel profiles through Cheyenne corridor
The simple analysis above illustrates the complexities associated with coordinating traffic signals along a straight corridor. This exercise becomes exponentially more complicated when analyzing an entire traffic network with temporal variations in congestion and speeds. To optimize signal timings and plan infrastructure changes across the entire network, a multivariate analysis is required that relies on rich transportation insights. As demonstrated by Geotab, connected-vehicles are an amazing source of data necessary to produce these insights.
Intersection and Corridor Insights: Cheyenne Avenue Case Study
Geotab’s intersection insights aggregate data across millions of connected-vehicles and additional third-party data sets to characterize traffic flow and corridor performance across signalized intersections:
- Understand average dwell or stop times per intersection per time of day per turning movement
- Understand traffic queue lengths per intersection per time of day per turning movement
- Understand the number of signal cycles per queue (how many green lights to clear a queue)
- Understand corridor travel time
- Understand corridor stop propensity
“In the era of big data and the internet-of-things, with an increasingly large number of connected-vehicles we are able to generate insights that were not possible before. Leveraging cloud infrastructure and machine learning techniques we can create smarter cities that provide more data and enable us to continually improve.”
- Daniel J. Lewis, Senior Data Scientist at Geotab and lead architect behind Geotab’s intersection insights
These insights can be used to benchmark turn signal efficiency versus straight-through signal efficiency, specifically when running historical analysis to find unique daily or hourly trends. Using this data, RTC is able to assess the effectiveness of certain signal phase changes within a targeted corridor, and more importantly across their entire transportation network. See below for a detailed analysis of a specific intersection along the aforementioned Cheyenne Avenue corridor: Cheyenne Avenue and Losee Road.
For optimal throughput there should be one or less stops on average to effectively service vehicles through the corridor. Figure 6 shows that for most directions of travel through this intersection the goal of one or less stops on average is being met. However for South to East left turn from Losee Road onto Cheyenne Avenue, for a substantial portion of the day it is taking more than one stop for a vehicle to clear the intersection. This could indicate that the capacity for the left turn lane is being exceeded. It also presents some other questions that can now be more easily addressed:
- Is it good for 11 of the 12 movements to have average or good performance and one to have poor performance?
- Should the agency construct additional capacity for this turning movement?
- If the same analysis was performed at several intersections, could the agency prioritize where the most needed improvements were?
- Once capacity was changed, how was the performance impacted?
Figure 6: Number of stops to clear intersection
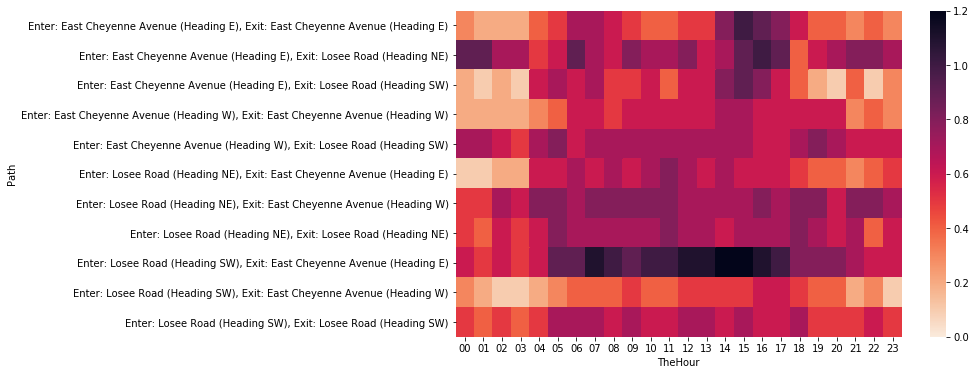
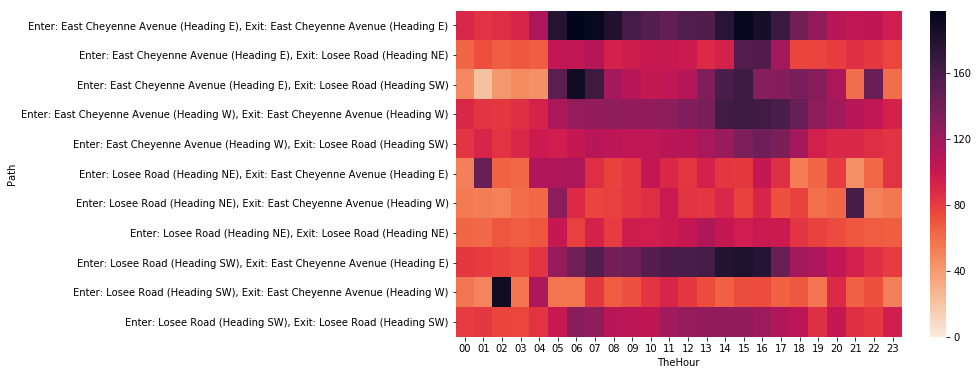
Figure 7 shows the average time from first stop to clear the intersection is much higher for left turns heading South West on Losee. It also shows extended wait times turning left off of Cheyenne heading East and onto Losee heading North East at certain times of the day. The through directions are likely prioritized for this corridor as we see much lower time from first stop for East and Westbound traffic on Cheyenne, with slightly more congestion in the Eastbound direction.
This allows us to objectively evaluate questions or complaints related to traffic that sits through the longer waits. Is it worth it to coordinate signals to provide so much time to through movements at the expense of other travelers? Given the direct communication between the traffic center and the Las Vegas Valley signal network, a signal timing adjustment that shifted time from the through traffic to the turn traffic could be implemented, and this type of data could help with the decision-making.
Figure 7: Average time from first stop to clear intersection

Figure 8 shows that for a large part of the day, the average distance to first stop approaches 200m for several movement patterns through the intersection. This is the case for Losee Road SW turning left onto Cheyenne heading E. The lane length for this left-hand turn is only 200m long indicating capacity for the lane is likely exceeded, and in turn the left-hand queue runs the risk of backing into straight-through lanes and impacting flow in the prioritized straight-through direction. The signal timing could potentially be adjusted to provide slightly more time for vehicles turning left, while taking into consideration the queue length in other directions which would be affected.
Figure 8: Average distance to first stop
Conclusion
By integrating Geotab’s intersection insights into Waycare’s traffic management platform, RTC is gaining critical visibility into corridor and intersection performance metrics that allow them to intelligently manage their signal infrastructure and minimize the problem of road surface congestion. These new and innovative capabilities are expected to have drastic effects on Las Vegas’ transportation network for years to come. To illustrate the potential of these kinds of capabilities, consider Figure 5 above. In this RTC trajectory map, the existing traffic signal progression scheme results in a distribution of travel times between 2.8 mins and 11.9 mins, representing a 9.1 mins discrepancy (425% delta in travel times). This is likely due to a higher proportion of larger slower moving vehicles, which typically cannot keep up with the average flow of traffic and therefore cannot take advantage of the coordinated traffic signals. By building better traffic signal progression models and profiles that take into consideration the actual vehicles on a corridor, one would expect to drastically improve the signal efficiency across the entire network.
References
- Las Vegas Convention and Visitors Authority. (2019). Visitors Statistics. [Online]. Available: https://www.lvcva.com/stats-and-facts/visitor-statistics/
- Las Vegas Convention and Visitors Authority. (2019). Visitors Statistics. [Online]. Available: https://www.lvcva.com/stats-and-facts/visitor-statistics/
- TRIP, a National Transportation Research Nonprofit. (2016) The Cost of Nevada’s Bad Raods. [Online] https://tripnet.org/wp-content/uploads/2018/09/NV_Las_Vegas_Review-Journal_10-26-2016.pdf
- INRIX. (2018). INRIX 2018 Global Traffic Scorecard. [Online] http://inrix.com/scorecard/
- Nevada Department of Transportation. (2018) Southern Nevada Traffic Study. [Online] http://www.ndotsnts.com/
Post Tags
About Geotab
Geotab is a global leader in connected transportation solutions. We provide telematics — vehicle and asset tracking — solutions to over 50,000 customers in 160 countries. For more than 20 years, we have invested in ground-breaking data research and innovation to enable partners and customers, including Fortune 500 and public sector organizations, to transform their fleets and operations. With over 4 million subscriptions and processing more than 75 billion data points a day, we help customers make better decisions, increase productivity, have safer fleets, and achieve their sustainability goals. Geotab’s open platform and Marketplace, offers hundreds of third-party solution options. Backed by a team of industry leading data scientists and AI experts, Geotab is unlocking the power of data to understand real-time and predictive analytics — solving for today’s challenges and tomorrow’s world. To learn more, visit www.geotab.com, follow @GEOTAB on X and LinkedIn or visit the Geotab Blog.
© 2024 Geotab Inc.All Rights Reserved.
This white paper is intended to provide information and encourage discussion on topics of interest to the telematics community. Geotab is not providing technical, professional or legal advice through this white paper. While every effort has been made to ensure that the information in this white paper is timely and accurate, errors and omissions may occur, and the information presented here may become out-of-date with the passage of time.
Recent News

4 ways to unlock the power of quality data
June 30, 2023

.jpg)
Your comprehensive guide to the Canadian ELD mandate
May 16, 2022

Putting fleet data quality to the test for risk management
March 25, 2022