


How long do electric car batteries last? What 6,300 electric vehicles tell us about EV battery life
Last updated on May 16, 2024 in Electric Vehicles by Charlotte Argue | 10 minute read
Table of contents
- How long do EV batteries last?
- EV battery life and performance: the keys to EV value
- What is EV battery degradation?
- Geotab’s EV Battery Degradation Analysis
- Is EV battery degradation linear?
- There is a measurable difference in how long EV batteries last between makes, models and years
- EV battery lifespan is protected by state of charge and the buffer effect
- High vehicle use does not equal higher battery degradation
- Vehicles driven in hot temperatures show faster battery degradation
- What is the impact of charge type on how long electric car batteries last?
- How to extend EV battery life
- Final thought: Operators can be confident that their EV batteries will perform as long as they need them
Compare the average battery degradation for different vehicle makes and model years.
How long do EV batteries last?
According to research from Geotab, the simple answer is that if the observed EV battery degradation rates are maintained, the vast majority of batteries will outlast the usable life of the vehicle and will never need to be replaced.
Based on data from over 6,000 electric vehicles, spanning all the major makes and models, Geotab finds that EV batteries are exhibiting high levels of sustained health. Across all vehicles, on average, an EV battery degrades at 2.3% per year.
Do electric car batteries wear out? Of course, like all batteries, they will eventually wear out, but in most cases, this will be long after the vehicle’s life-cycle is complete.
See also: To what degree does temperature impact EV range?
Do electric cars lose range over time?
Technically, yes. What this means for an electric vehicle’s range is, if you purchase an EV today with a 150-mile range, you would lose about 17 miles of accessible range after five years. This decline is not likely to have a significant impact on most drivers’ day-to-day needs, but it is a factor fleet managers will need to consider when it comes to maximizing the value of their EVs.
Importantly for consumers, car makers commonly offer a warranty on EV batteries for around eight years or 100,000 miles. This is the federal minimum in the United States and it varies by manufacturer and country. But by all accounts, electric car batteries should last much longer than that.
That is the simple answer, but the question of how long does an electric car battery last is complicated and numerous factors determine EV battery longevity.
Common factors impacting electric car battery life
In general, battery electric vehicles (BEV) and plug-in hybrid electric vehicles (PHEV) today use Lithium-ion batteries. Several key factors determine how long lithium car batteries last. These include:
- Age
- Temperature
- Operating state of charge
- AC vs DC charging
- Usage (energy cycles)
- Make and model
In the following article, we’ll dive into the data on these factors and how they affect lithium car battery lifespan.
EV battery life and performance: the keys to EV value
If you’re considering buying an electric vehicle, these three questions are probably at the top of your list:
- How much will the EV cost?
- What is its range?
- How long will the battery last?
From a life-cycle perspective, EV battery performance and health really are the key to it all. As the battery is an EV’s most expensive component, the degradation will have a direct impact on the maximum usable range over time and also affect the vehicle’s residual value (which affects the cost question).
See also: Podcast: EV myths and management with Charlotte Argue
What is EV battery degradation?
EV battery degradation is a natural process that permanently reduces the amount of energy a battery can store or the amount of power it can deliver. The batteries in EVs can generally deliver more power than the powertrain components can handle. As a result, power degradation is rarely observable in EVs and only the loss of the battery’s ability to store energy matters.
An EV battery’s condition is called its state of health (SOH). Batteries start their life with 100% SOH and over time they deteriorate. For example, a 60 kWh battery with 90% SOH would effectively act like a 54 kWh battery.
How long does a charge last on an electric car?
Keep in mind, state of health is not the same as vehicle range (distance the vehicle can travel on those kWhs). Range will fluctuate on a daily or trip-by-trip basis, depending on charge level, topography, temperature, auxiliary use, driving habits, passenger or cargo load and other factors.
While plenty of research has been done on battery health, there has been very little data following the real-world performance of EVs over time, let alone comparisons across different makes and models — until now.
Geotab’s EV Battery Degradation Analysis
We analyzed the battery health of 6,300 fleet and consumer EVs, representing 1.8 million days of telematics data, to help fleet operators assess how EV batteries hold up. We gained insight into how real-world conditions influence the battery life of electric cars, including average degradation data for 21 distinct vehicle models, representing 64 makes, models and years.*
Get started with the tool
Is EV battery degradation linear?
While this analysis shows more or less linear degradation, as a general rule, EV batteries are expected to decline non-linearly: an initial drop, which then continues to decline but at a far more moderate pace. Towards the end of its life a battery will see a final significant drop, as seen below.
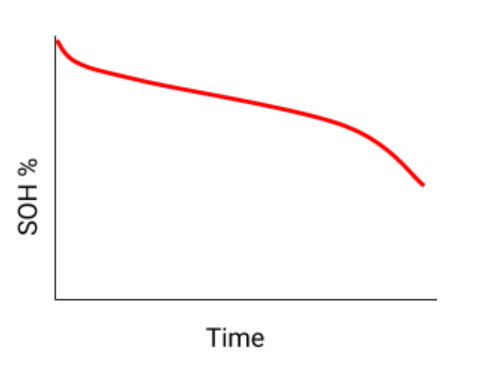
Figure 1: A normal degradation curve is expected to look something like this.
Do electric car batteries wear out?
At the average degradation rate of 2.3% per year, an EV battery would take 15 years to decline to 70% maximum charge. However, as we expect EV battery life to decline non-linearly, there would likely be a more significant drop-off as the battery ages.
Fortunately for drivers, too few batteries we’ve observed have reached the end-of-life drop for us to predict when this is likely to occur. We will continue monitoring to see when the non-linear degradation (known as the “heel”) begins.
There is a measurable difference in how long EV batteries last between makes, models and years
Our data shows that vehicle batteries respond differently to the test of time, depending on their make and model year. Why do some vehicle models seem to, on average, degrade faster than others? Two potential contributors are battery chemistry and thermal management of the battery pack.
While EVs use Lithium-ion batteries, there are many different variations of Lithium-ion chemistries. A battery’s chemical make-up will influence how it responds to stress.
In addition to cell chemistry, temperature control techniques differ across vehicle models. A major distinction is whether the battery pack is cooled and/or heated by air or liquid.
Liquid cooling vs air cooling: which is better for EV battery longevity?
Let’s compare a vehicle with a liquid cooling system to one with a passive air cooling system: the 2015 Tesla Model S and the 2015 Nissan Leaf, respectively. The Leaf has an average degradation rate of 4.2%, while the Model S is 2.3%. Good thermal management means better protection against battery degradation.
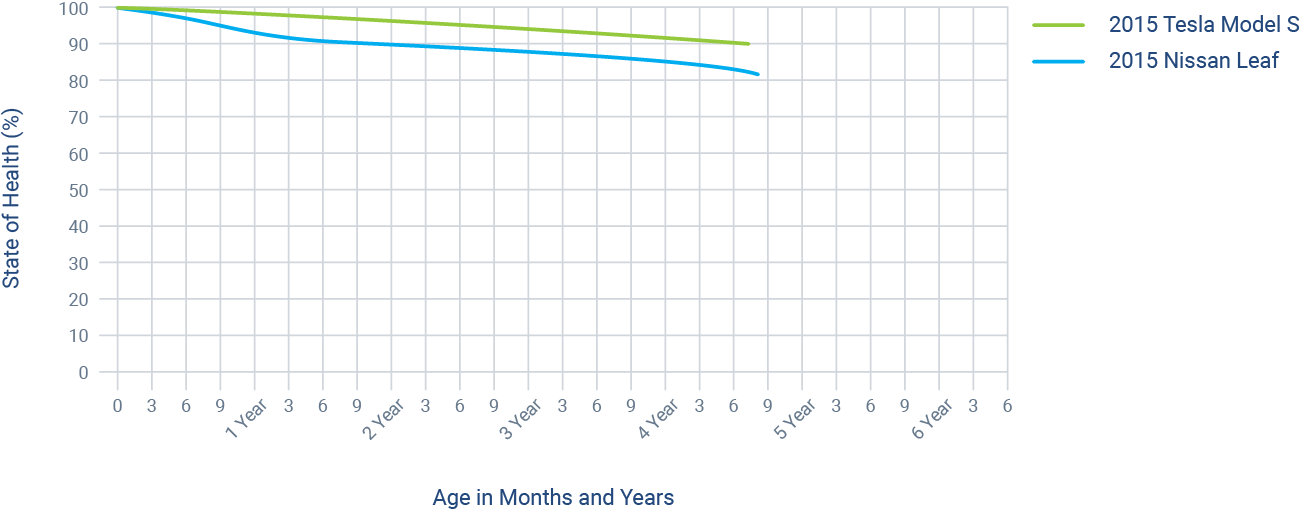
Figure 2: Battery degradation comparison of the 2015 Tesla Model S (liquid cooling) vs. the 2015 Nissan Leaf (passive air cooling).
EV battery lifespan is protected by state of charge and the buffer effect
State of charge (SOC) refers to the amount of capacity an EV battery currently has available compared to its rated capacity. Simply put, a fully charged battery has a SOC of 100%; a discharged battery has a SOC of 0%; and a half-charged battery, 50%. However, the “usable” charge is different from the “absolute” charge.
Since operating a battery near absolute full or empty has implications on battery health, manufacturers use buffers to limit the maximum and minimum charge vehicles can reach (shown in the chart below). As a result, how vehicles control their state of charge is another reason electric car battery life differs between manufacturers
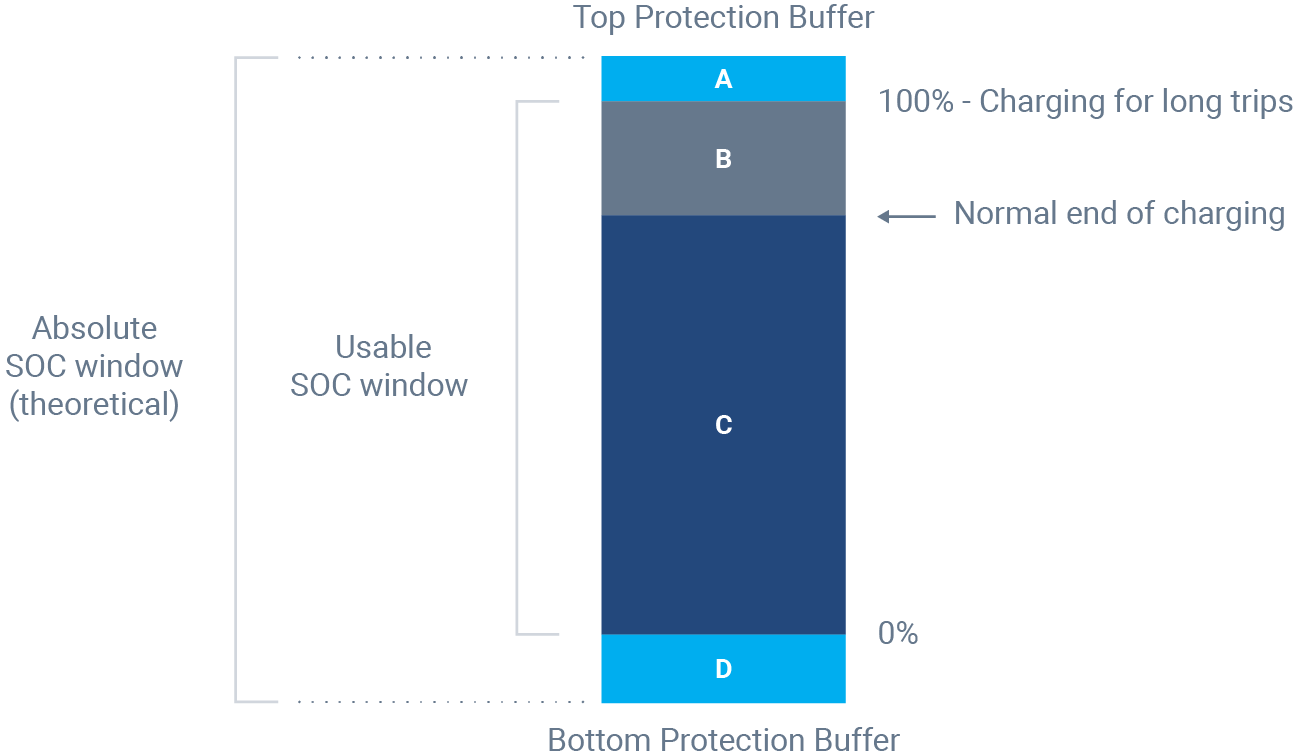
Figure 3: Battery protection buffers control the usable state of charge window for an EV.
Did you know? Charging buffers protect electric car battery life and make driving safer
Limiting extreme low or high charging is not only done for battery health but also for safe vehicle operation. At the extreme ends, the battery wouldn’t be able to accept or deliver full power and the driving experience would be impacted.
Thanks to over-the-air software upgrades, it’s possible that the size of the buffer can change over time, as discovered by some Tesla owners in 2019 when they noticed a decrease in their top range. Tesla confirmed the upgrade was “to protect the battery and improve longevity.”
In addition, some automakers have adjustable charge ceilings, so the user can set their own maximum charge (e.g., they can tell the vehicle to stop charging at 75% instead of 100%). This owner-discretionary region (B in the graphic above) works in combination with the non-discretionary buffer (A) to limit battery operation in areas of higher degradation.
Consider how the Chevrolet Volt uses buffers to increase the lifespan of its EV batteries
The Chevrolet Volt, especially in the early model years, has comparatively large top and bottom protection buffers (regions A and D) that dynamically change as the battery ages. While the larger buffers mean less energy for driving, it should result in a longer-lasting battery pack. Given the larger SOC buffers, liquid thermal management, and dynamic (decreasing) buffer size, slower-than-average degradation rates should be expected on the Volt.
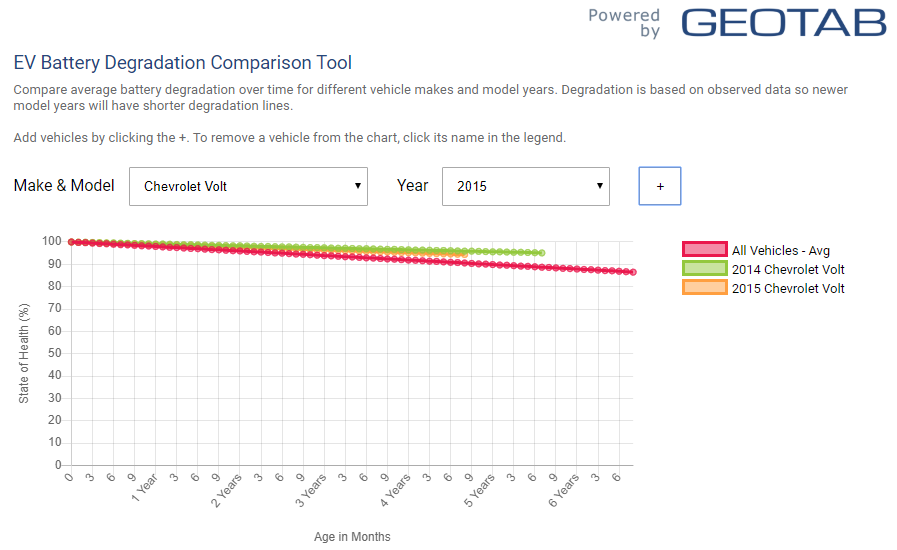
Figure 4: Battery degradation over time for a Chevrolet Volt vs. all vehicles.
High vehicle use does not equal higher battery degradation
One exciting piece of information we gleaned from the data was that electric vehicles with high use did not show significantly higher battery degradation. This should be welcome news since you don’t benefit from an EV if it’s just sitting in the fleet yard.
The takeaway? Don’t be afraid to put your EVs in high-use duty cycles. Their battery life won't be negatively impacted as long as they are within their daily driving range. One caveat: if high use requires routine DC fast charging, read the section below on the impact of charging type.
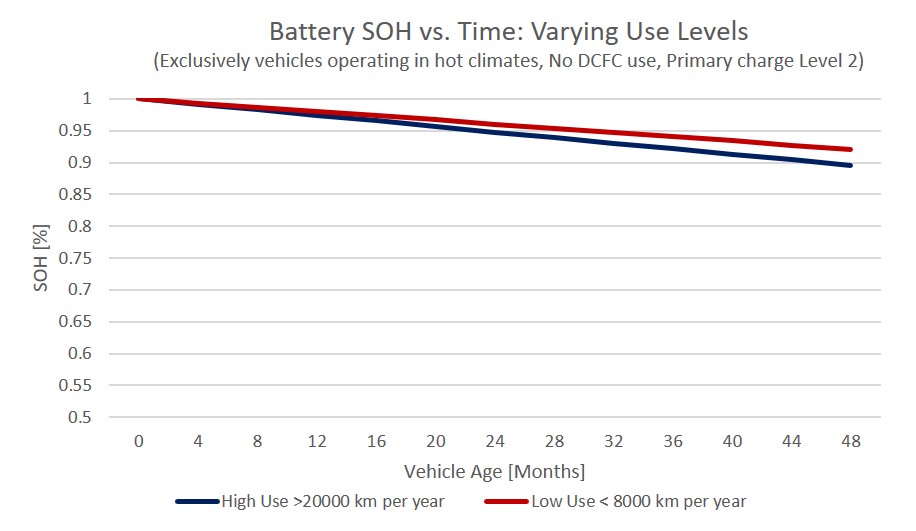
Figure 5: Amount of use doesn’t appear to have much impact on degradation rates.
Vehicles driven in hot temperatures show faster battery degradation
A battery exposed to very hot temperatures will be prone to more damage, but by how much? Will an EV in Arizona have a different battery life than the same car driven in Norway? To find out, we grouped the vehicles based on the following climate conditions:
- Temperate: Fewer than five days per year over 80 F (27 C) or under 23 F (-5 C).
- Hot: More than five days per year over 80 F (27 C).
As illustrated below, vehicles driven in hot climates showed a notably faster rate of decline than those driven in moderate climates. This is not great news if you and your fleet toil under the hot sun.
Heat and cold weather also impact your day-to-day range.
To understand how, take a look at our analysis detailing how temperature affects EV range.
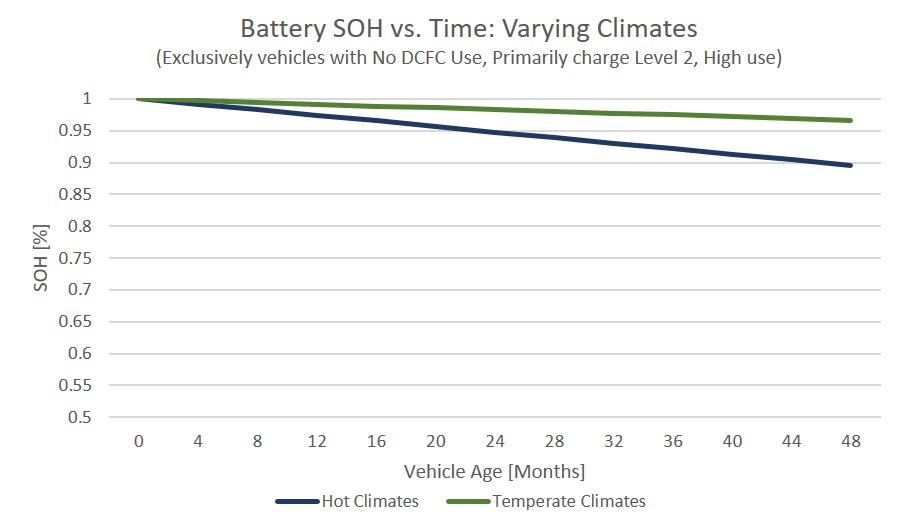
Figure 6: Batteries exposed to hot days degrade faster than those in temperate climates.
What is the impact of charge type on how long electric car batteries last?
We were able to look at the predominant charging level used for the EVs in our system. North American EV charging stations are categorized into three common types:
- AC Level 1 (120 volts) – a regular home outlet in North America
- AC Level 2 (240 volts) – typical for home or fleet charging
- Direct current fast charger (DCFC) – for faster top-ups
For an overview of charging and related costs, read our simple guide to EV charging.
Charging in most of Europe is referred to as AC charging (which is generally equivalent to Level 2 in North America) and DC charging (DCFC, as described above).
There is an observable difference in battery health between cars that routinely charge on Level 2 compared to those that used Level 1. However, the difference is not beyond the level of statistical significance.
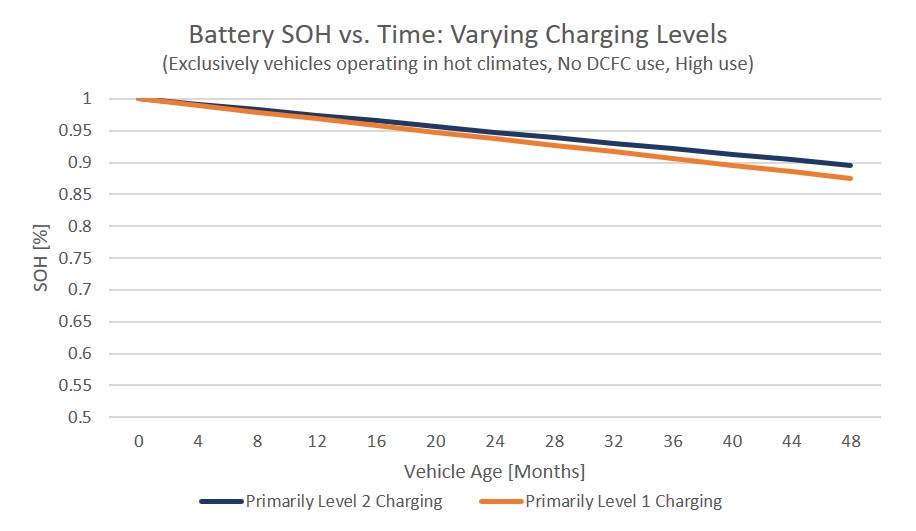
Figure 7: Battery degradation for vehicles that primarily charge on Level 1 compared with Level 2.
However, the use of DCFCs does appear to significantly impact the rate at which batteries degrade. Rapidly charging a battery means high currents resulting in high temperatures, which are both known to strain batteries. In fact, many automakers suggest drivers and fleet managers limit the use of DCFC to prolong their electric vehicles’ battery life.
Below, we look at all battery electric vehicles operating in hot climate conditions based on how frequently they used a DCFC: never, occasionally (1-3 times per month) or frequently (3+ times per month).
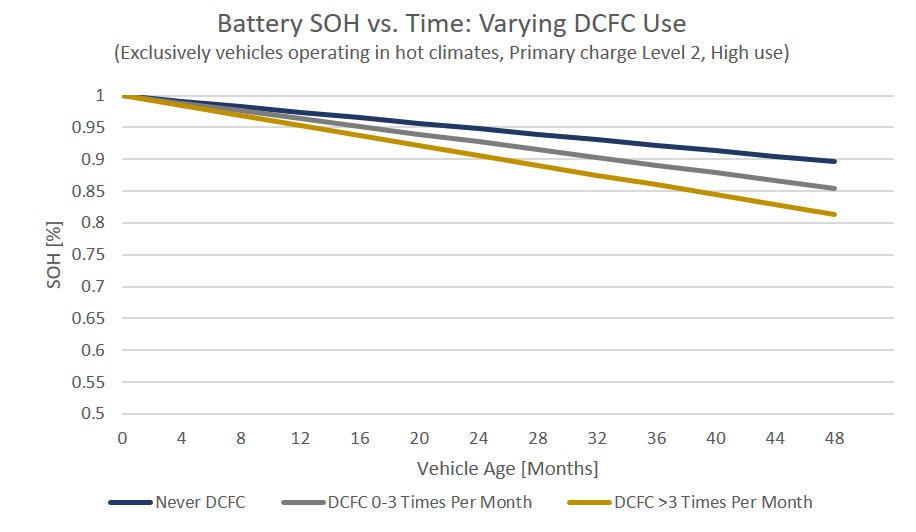
Figure 8: Battery degradation appears to be strongly correlated with DCFC use for vehicles in seasonal or hot climates.
The difference between those vehicles that never used DCFC and those that used it even occasionally in seasonal or hot climates was notable. While other factors may be at play (we want to stress that this wasn’t a controlled experiment), charging via lower power Level 2 charging should be prioritized.
How to extend EV battery life
While EV battery degradation varies by model and external conditions, such as climate and charging type, most electric vehicles today have not experienced a significant decline in battery life. Overall battery degradation has been very modest, with an average capacity loss of just 2.3% per year. Under ideal climate and charging conditions, the loss is 1.6%.
While some things are out of an operator’s control, there are ways you can extend the life of your EV’s battery.
EV battery charging best practices
- Avoid keeping your car sitting with a full or empty charge. Ideally, keep your state of charge between 20-80%, particularly when leaving it for longer periods. Only charge it fully for long-distance trips.
- Minimize direct current fast charging. Some high-use duty cycles will need a faster charge, but Level 2 should be sufficient for most of your charging needs if your vehicle sits overnight.
- Climate is not within a driver’s control, but do what you can to avoid extreme hot temperatures, such as choosing shade when parked on hot days.
- High use is not a concern for EV battery lifespan, so fleets shouldn’t hesitate to put electric vehicles to work. An EV isn’t useful sitting idle and putting on more miles per vehicle is a better fleet management practice overall.
Final thought: Operators can be confident that their EV batteries will perform as long as they need them
So, how long do electric car batteries last? As we learned in our research, numerous factors determine an electric vehicle battery’s lifespan. Drivers can control some of these factors but not others. However, the most important takeaway is that, on average, EV batteries will outlast the useful life of their vehicle, especially if drivers follow charging and driving best practices.
Warranties are reassuring, and so is the fact that battery costs are decreasing significantly year over year. Since 2010, the price of an average Lithium-ion battery pack has dropped by over 80%.
An automaker’s guarantee of their battery technology and the promise of decreasing costs should inspire confidence. However, we recommend you try the EV battery degradation tool to better understand how electric cars fit your circumstances.
When you’ve assessed the available makes and models of electric vehicles, get in touch to answer your questions or get more details on tracking and managing EV battery life.
As electric vehicles come out with larger battery packs, losing some capacity may not impact your day-to-day driving needs. However, accurate state-of-health information, made possible by comprehensive telematics data, is key to helping fleets match the right vehicle to the right job. Geotab’s EV Battery Health report allows fleets to know the real battery capacity of their EVs, understand the rate of degradation and make replacement decisions based on the remaining battery capacity, so they can use their vehicles with confidence and replace them when it makes the most sense.
Visit geotab.com/ev for more information.
* Notes about the analysis:
- The degradation curves displayed are the average trend line from the data analyzed.
- These graphs can offer insight into average EV battery life over time, but they should not be interpreted as precise predictions for any specific vehicle.
- A subset of vehicle makes, models and years are not available in the visualization. We have excluded vehicles with insufficient data, so don’t be alarmed if your car of choice is missing.
Originally published on December 13, 2019. Updated May 14, 2024.
If you liked this post, let us know!

Disclaimer
Geotab's blog posts are intended to provide information and encourage discussion on topics of interest to the telematics community at large. Geotab is not providing technical, professional or legal advice through these blog posts. While every effort has been made to ensure the information in this blog post is timely and accurate, errors and omissions may occur, and the information presented here may become out-of-date with the passage of time.
Get industry tips and insights
Sign up for monthly news and tips from our award-winning fleet management blog. You can unsubscribe at any time.
Other posts you might like

In the Driver’s Seat: Mike Branch’s Insights from Geotab’s State of Commercial Transportation Report
May 9, 2024

Home EV Charging Reimbursement: A New Frontier for Employers in North America
May 7, 2024

Leveraging an EV ecosystem for a smooth and successful transition
April 30, 2024

Public sector fleet electrification: Sharing insights from learned experiences at Connect 2024
April 18, 2024