Europe's congestion is costing fleets millions in wasted fuel, new Geotab data reveals
Geotab's European Urban Freight Efficiency Index finds Dublin 3rd overall. Passenger vehicles waste 12.9% of fuel idling; Paris hits commercial fleets hardest.
July 14, 2026
•3 minute read
€2.6 million in fuel burned while stationary across Europe's major capitals in 2025
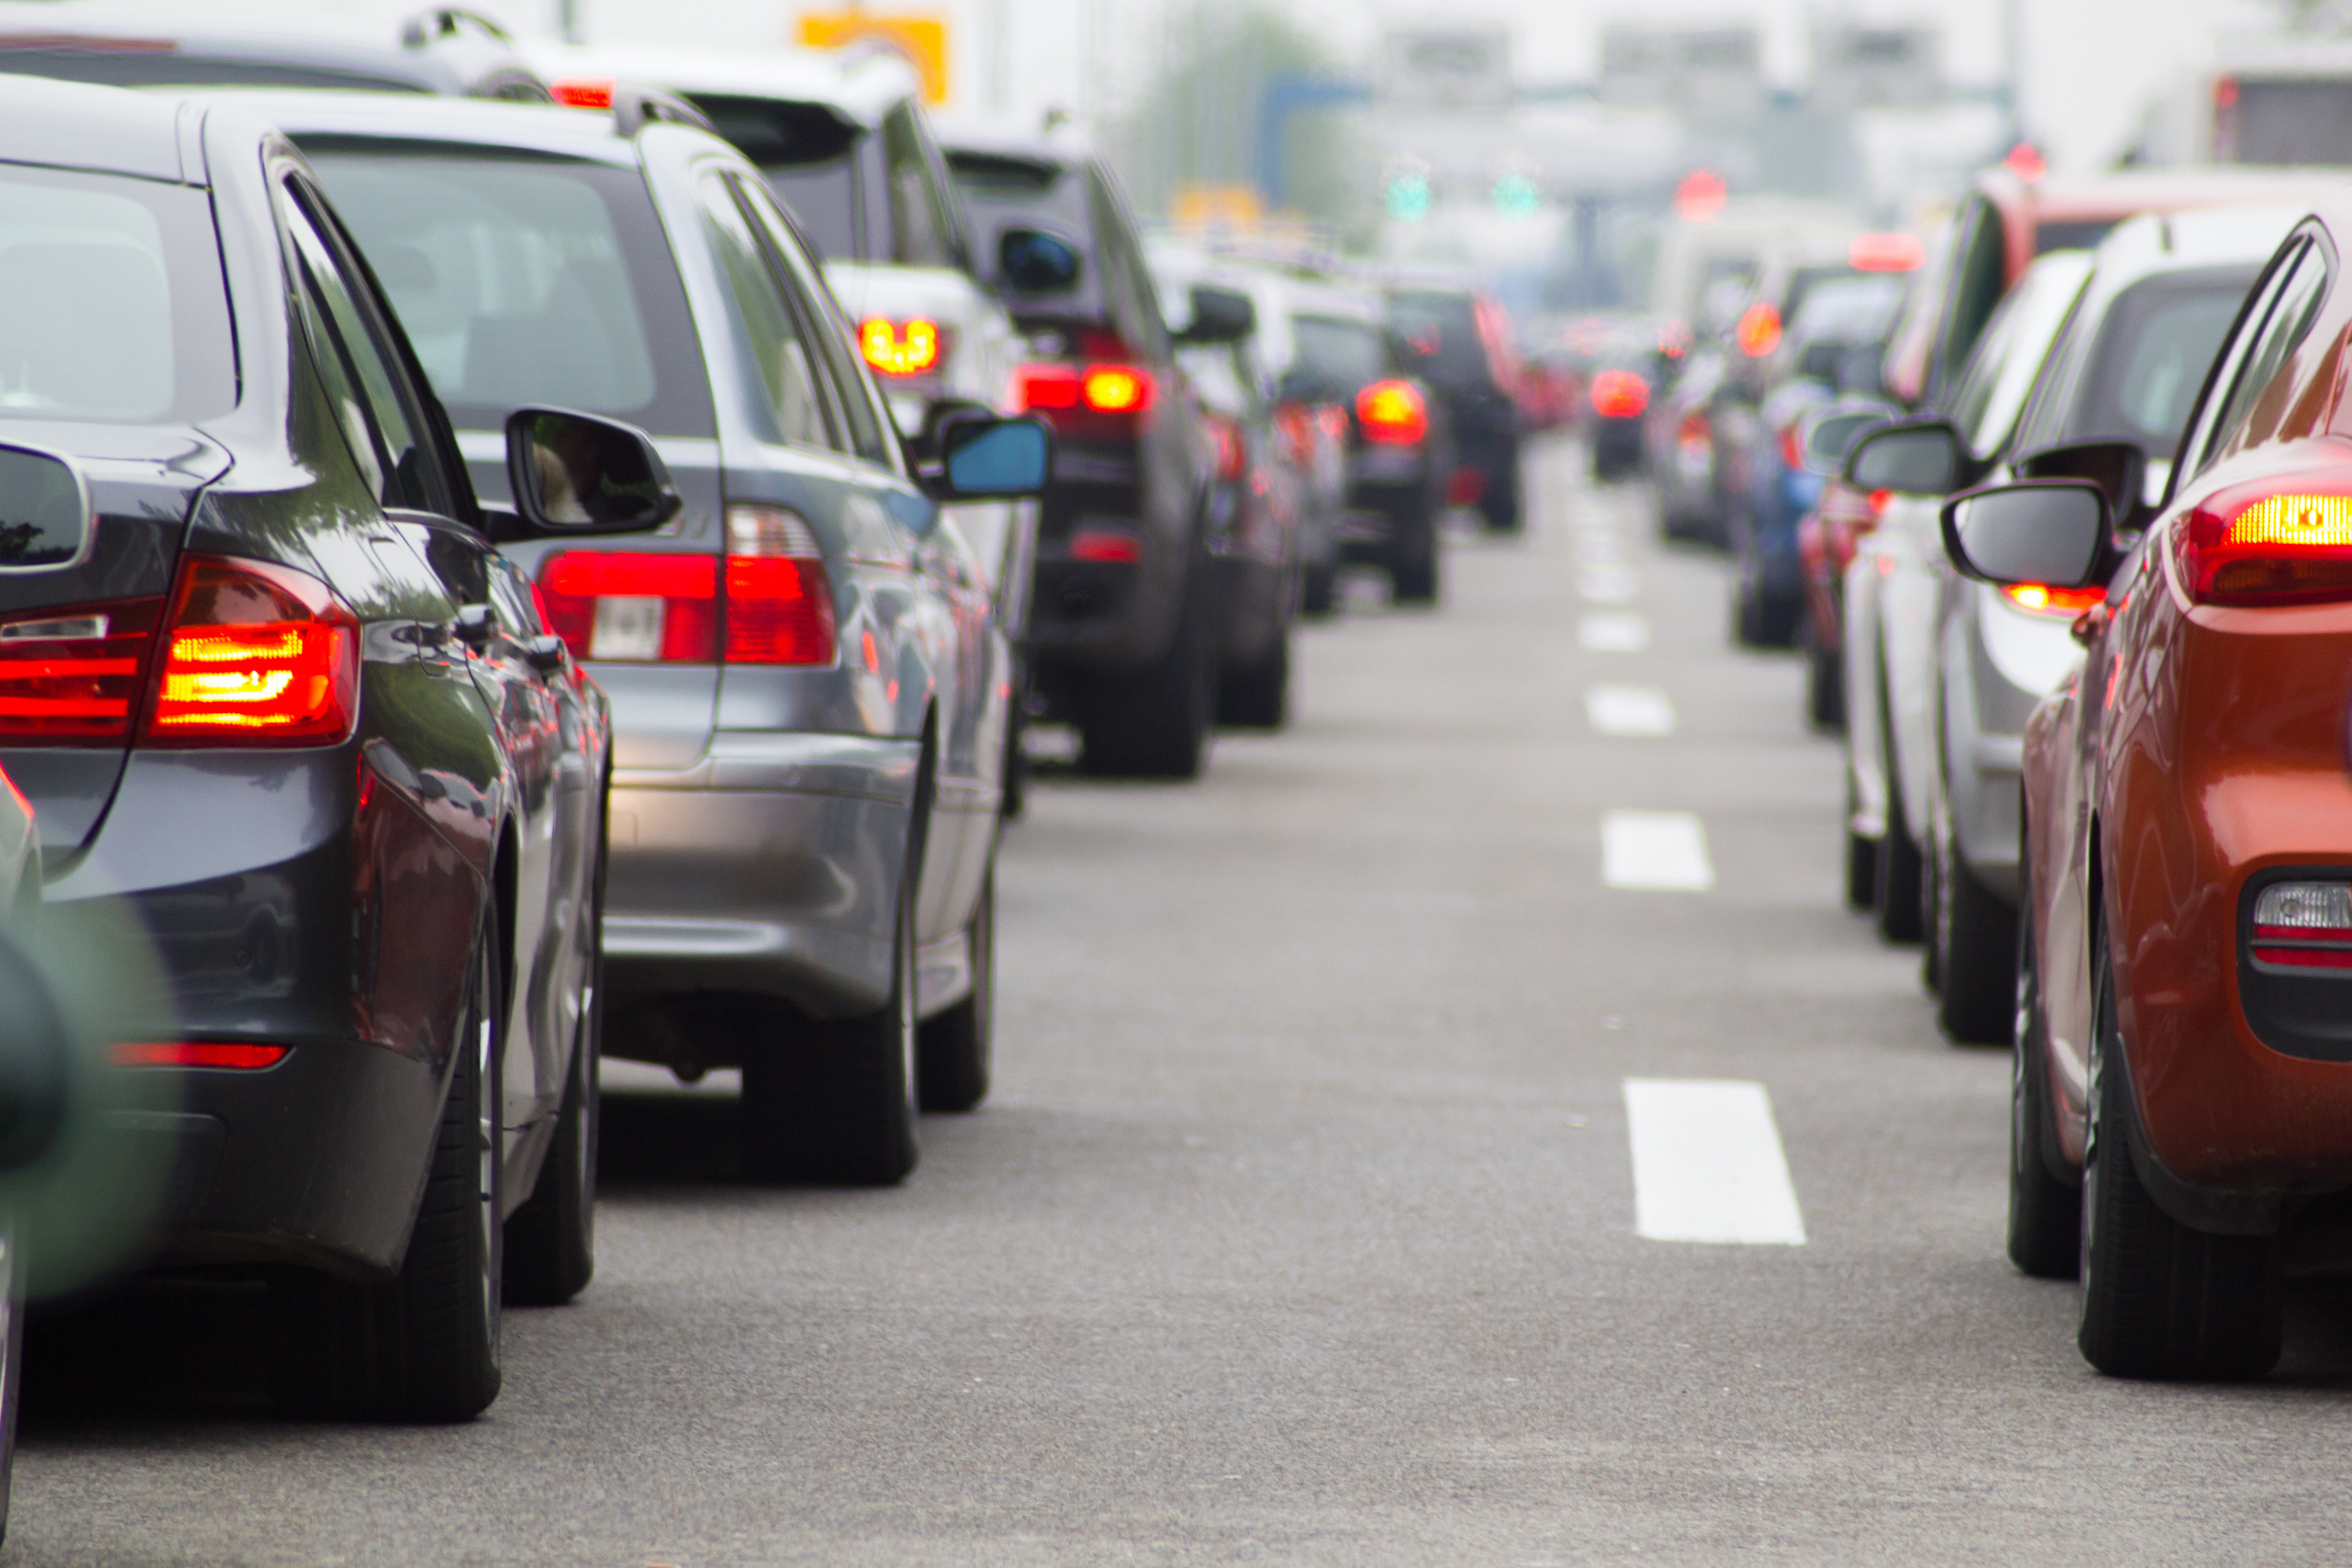
Dublin, Ireland — 14 July 2026 — Geotab, a global leader in connected vehicle and asset management solutions, today revealed that more than 1.58 million litres of fuel were burned while Geotab-connected vehicles sat stationary in traffic across Europe's major capitals during last year. Across the vehicles analysed, idle fuel waste reached an estimated €2.6 million over twelve months.
The stark findings form part of Geotab's European Urban Freight Efficiency Index, which analysed a full year of connected vehicle data across seven major capitals: Dublin, Berlin, Amsterdam, Rome, Paris, London and Madrid.
That figure reflects 2025 average European fuel prices. European diesel since rose above €2 per litre in the first half of the year , a 30% increase triggered by geopolitical instability in the Middle East, which would bring the cost of the same volume of idle waste to approximately €3.6 million.
Cities in Context
Across the seven cities in the study, the relationship between congestion and fuel efficiency diverges sharply depending on how traffic moves, not just how much of it there is. The most congested city is not necessarily the one costing fleets the most in fuel.
Dublin presents a distinctive pattern, ranking third overall with an Index score of 49. Despite moderate overall congestion, passenger vehicles waste 12.9% of fuel idling, among the higher rates in the study. The city's stop-and-go arterial network generates concentrated idling rather than the steady, continuous movement that produces lower idle waste elsewhere. Commercial trucks performed markedly better at 5.8% idle waste, benefiting from off-peak scheduling that passenger fleets cannot as easily replicate.
Paris tells the complete opposite story. Where Dublin's congestion disproportionately affects passenger vehicles, Paris shifts the burden almost entirely onto commercial fleets. Journey times are highly predictable, but commercial vehicles operating in the French capital lose almost one in every five litres of fuel while stationary, making it the highest truck idle waste rate in the study. The Périphérique and inner arrondissements generate the kind of stop-start conditions that burn fuel without forward progress but almost exclusively for commercial vehicles. Passenger vehicles, making longer trips that allow engines to run efficiently, idle at just 5.7% of total fuel consumed, the lowest passenger rate in the study. The 12-point gap between truck and passenger idle in Paris is the widest of any city analysed.
London represents the most challenging operating environment for fuel efficiency among the seven cities. Like Dublin, passenger vehicles bear a greater idle fuel penalty than commercial fleets, but London's heavier, less predictable congestion amplifies losses across both vehicle types. London is essentially Dublin under more severe congestion. Ranked sixth overall in the Index, its stop-start traffic patterns prevent engines from reaching operating temperature, while its unpredictability compounds the problem. London recorded the highest passenger vehicle fuel consumption of any city analysed, at 15.60 litres per 100 kilometres, with 13.6% of fuel consumed while stationary, almost two-and-a-half times higher than Paris. Commercial trucks performed comparatively better, idle at 11.1% of total fuel consumed. Lower than the passenger rate, but still among the higher truck figures across the study, reflecting the loading restrictions, bus lane exclusions and concentrated delivery windows that make London uniquely challenging for commercial vehicle operations.
Berlin serves as the closest thing to a benchmark operating environment, leading with an overall Index of 61. Journey times are reliable, harsh event rates are low, and the network’s predictability means scheduling commitments are achievable. The city records truck idle waste of 8.5%, fuel consumed with engines running and wheels stationary in comparison to total fuel consumed. Its polycentric road network distributes traffic across the city, limiting the stop-start conditions that drive up fuel consumption. Passenger vehicles idle at a higher rate of 13.2%, consistent with the broader study finding that professionally managed commercial fleets extract more from the same road network than general traffic.
Edward Kulperger, Senior Vice President, EMEA at Geotab, said:
Congestion has traditionally been measured through the lens of time. How long journeys take, how busy roads become and how delays affect operations. What this analysis shows is that there is another layer of cost sitting beneath that discussion.
When vehicles are idling, fleets are effectively burning money. Our data shows it costs them millions: fuel consumed with engines running and wheels going nowhere. Every litre of that is also an emissions cost. Beyond the time lost, the burden of congestion is financial and environmental. The fleets navigating it best are those with the clearest picture of where those costs are falling.
Read the full report here.
Methodology
The European Urban Freight Efficiency Index scores each city on a scale of 0 to 100, based on two dimensions evaluated separately for passenger vehicles and trucks, then combined using a 60/40 weighting (passenger/truck) to reflect that most road demand comes from passenger vehicles while the truck component captures logistics efficiency specifically.
The first dimension, how traffic flows, accounts for 75% of each vehicle score and measures three things: congestion burden (cumulative congestion across the day, 50% weight), uncongested windows (hours per day of free-flowing traffic, 25% weight), and travel time variability (journey time predictability, 25% weight). The second dimension, what congestion costs, accounts for the remaining 25%, measuring mid-trip vehicle idling as a proxy for waste produced by the system. Higher idle ratios indicate congestion, poor signal timing and bottlenecks.
Idle fuel costs were estimated using 2025 average pump prices from the European Commission's Weekly Oil Bulletin for EU cities, and the UK Government's Weekly Road Fuel Prices dataset for London, converted at the 2025 average GBP/EUR rate of 1.185.
All scores are based on full-year 2025 data (January–December) from Geotab's connected vehicle platform across seven cities: Berlin, Amsterdam, Dublin, Rome, Paris, London and Madrid. Scores represent normalised, relative comparisons from a sample of connected vehicles, not a census.
Media Contact
pr@geotab.com
About Geotab
Geotab is a global leader in connected operations, video telematics and AI-powered insights. Trusted by more than 100,000 customers — from small and mid-size fleets to Fortune 500 enterprises and public-sector organisations, including the U.S. federal government, Geotab connects approximately 6 million vehicles and assets and processes 100 billion data points daily. With ISO/IEC 27001:2022, SOC2, FIPS 140-3 and FedRAMP authorisations, Geotab’s open platform and 700+ partner ecosystem unify safety, compliance and operations in a single system. Our mission: a safer, more efficient, and more sustainable world in motion. Learn more at www.geotab.com/ie and follow us on LinkedIn or visit our blog.
GEOTAB and GEOTAB MARKETPLACE are registered trademarks of Geotab Inc. in Canada, the United States and/or other countries.
Related News
.png)
Clearly Goes Live on the Geotab Marketplace Across Five Markets
October 5, 2026
2 minute read

Geotab launches Investigations and new safety capabilities to help fleets make every journey safer
September 14, 2026
3 minute read
Dublin trucks outperform passenger vehicles on urban road efficiency, Geotab data reveals
September 8, 2026
3 minute read

Fleet Insurance: How SMB fleets can stay insurable in a high-cost market
June 15, 2026
3 minute read