Asset Utilisation
Get instant visibility into how your fleet is being used
Right-size your fleet: Compare utilisation across vehicles, groups and time periods to identify underused and overused assets. Make confident buy, sell and lease decisions backed by consistent, standardised data.
Faster time to insight: Key metrics are available out of the box — no Excel downloads, no analyst support required. Access the answers you need immediately, without downloading or configuring a single report.
One source of truth: Consistent utilisation data across MyGeotab, Excel and Geotab Data Connect (GDC)/PowerBI eliminates conflicting numbers and keeps your whole team aligned on fleet performance.
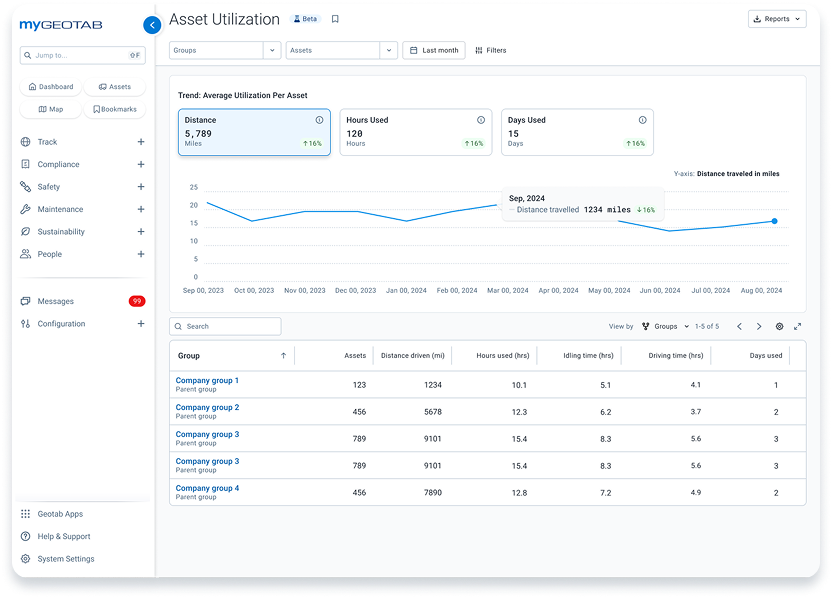
What is fleet utilisation?
Asset utilisation is a measure of how effectively your fleet vehicles and equipment are being put to work. Are your assets driving revenue, sitting idle, or running outside working hours? Asset Utilisation in MyGeotab answers these questions automatically, surfacing days used, hours driven, distance travelled and idle vs. drive time for every vehicle in your fleet.
Where fleet managers once relied on complex Excel reports and manual data wrangling to answer basic questions about vehicle usage, Asset Utilisation delivers a single, consistent, always-accessible view. Whether you’re right-sizing a fleet of 50 or 5,000, the data is ready the moment you need it.
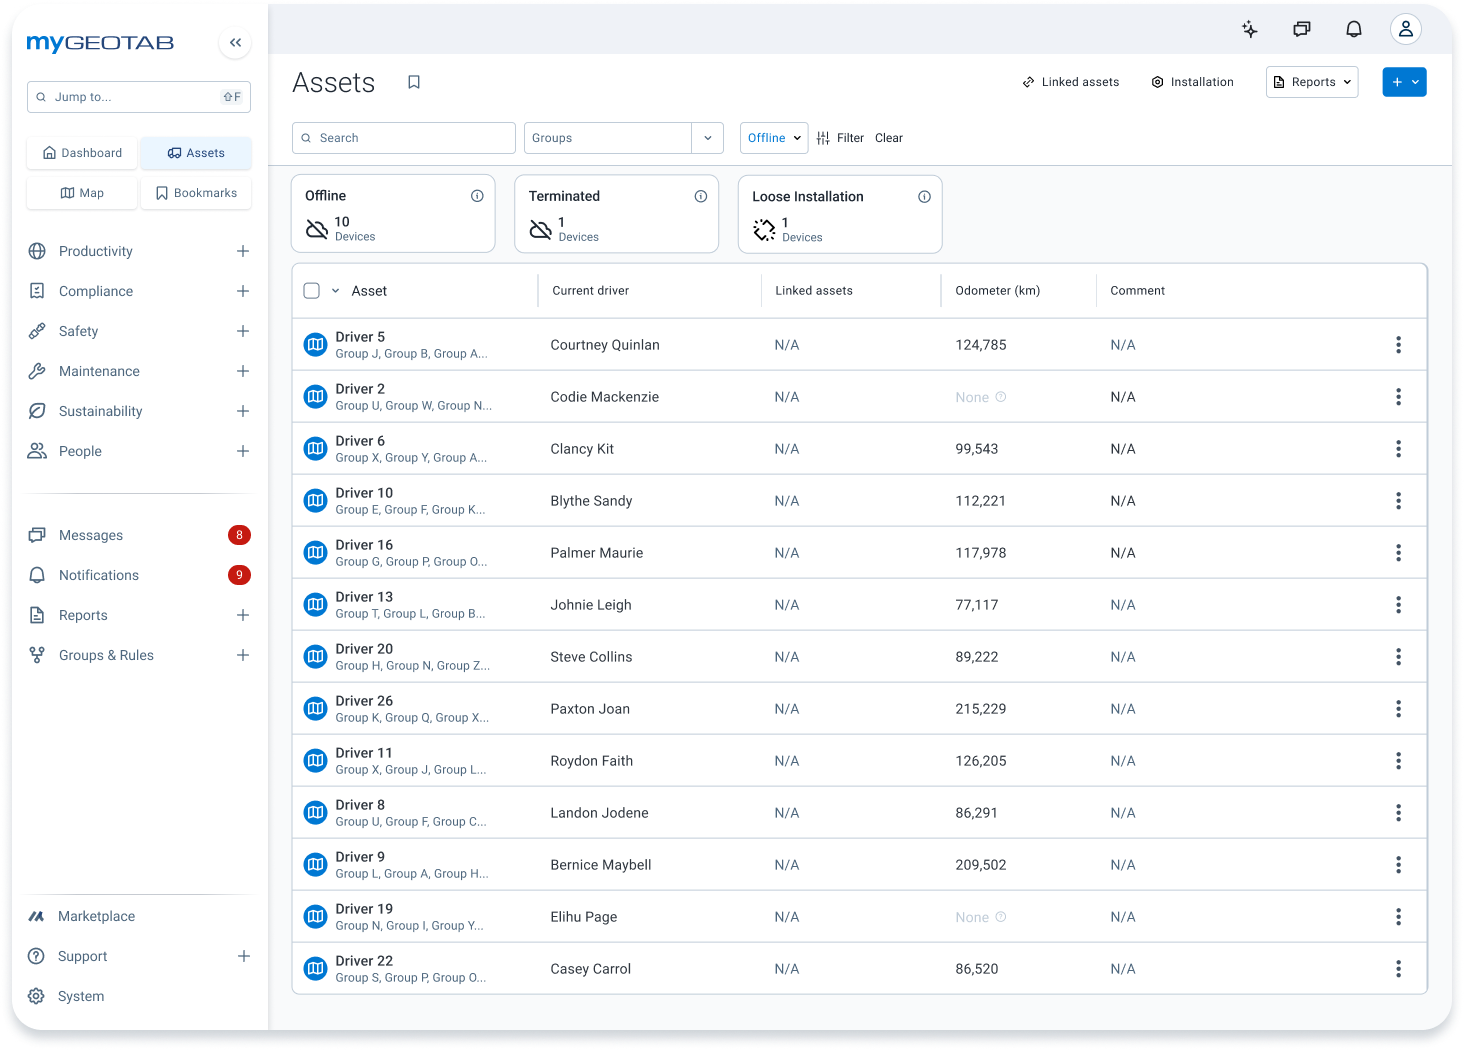

Fleet right-sizing
Fleet right-sizing and utilisation planning has long meant hours of manual work; downloading Excel reports, applying inconsistent formulas and reconciling data across multiple tools. Asset Utilisation brings standardised metrics directly into MyGeotab, giving fleet managers instant visibility into days used, hours driven, distance travelled and idle vs. drive time across every vehicle in their fleet. No configuration. No spreadsheets. No data analyst required.
Monitor fleet usage
Fleet managers can track how fleet usage changes over time: across weeks, months, and years. By monitoring trends at the group, depot, or vehicle type level, fleet managers can spot seasonal patterns, catch gradual underperformance before it becomes a problem, and build a reliable baseline for long-term planning.


Understand and optimise fleet utilisation
Every fleet operates differently, making true utilisation harder to measure than simple mileage or hours. Asset Utilisation combines core metrics—days used, hours driven and distance travelled—with deeper context like idle time, after-hours activity and cross-group comparisons to deliver a clear, standardised view of how assets are used. With consistent reporting across MyGeotab, Excel and BI tools, you get a single source of truth to uncover inefficiencies, improve performance and make smarter decisions about fleet size, costs and long-term strategy.
Benefits of Asset Utilisation with Geotab:
- Access core utilisation metrics instantly, with no setup required
- Distinguish productive driving from idle time to reduce waste
- Monitor asset usage inside and outside working hours
- Compare performance across teams, regions and fleet types
- Maintain consistency across platforms with standardised metrics
- Export clean, ready-to-use Excel reports without extra processing
- Identify inefficiencies and opportunities for cost savings
- Build a foundation for advanced analytics and long-term planning
Frequently asked questions
What is asset utilisation in fleet management?
Asset utilisation measures how actively and efficiently your fleet vehicles are being used. Key metrics include days used, hours driven, distance travelled and the ratio of drive time to idle time. Very High utilisation means assets could be experiencing accelerated wear and tear; High utilisation means assets are delivering value; low utilisation can signal candidates for reallocation or retirement. Fleet managers get instant visibility into days used, hours driven and idle time directly inside MyGeotab — no downloads or manual configuration required.
How does Geotab calculate asset utilisation?
Geotab’s Asset Utilisation draws on telematics data collected directly from connected vehicles. Metrics like days used, hours driven and idle time are calculated automatically and standardised across all vehicle types and groups. The same numbers appear consistently in MyGeotab, Excel exports and Geotab Data Connect (GDC)/PowerBI — so every team is working from the same source of truth.
How is this different from the existing Excel utilisation reports?
Legacy Excel utilisation reports require users to download large files, apply manual configuration and navigate non-obvious settings — like enabling "daily subperiods" just to calculate days used. Data is often inconsistent between reports and difficult to find. Geotab’s Asset Utilisation replaces that workflow with a native, out-of-the-box page in MyGeotab. Metrics are pre-calculated, always current and accessible to any user without technical expertise.
See how your fleet is really performing.
Asset Utilisation is built into MyGeotab. No extra tools, no configuration required. Get instant visibility into days used, hours driven, idle time and more across your entire fleet.