
Driver safety scorecards: the first step to a safer fleet
Table of Contents
- The cost of unsafe driving behavior
- How Can Telematics Improve Safety?
- What Does the Driver Safety Scorecard Focus On?
- Vehicle Class
- Seat Belt Usage
- Seat Belt Detection
- How Does the Driver Safety Scorecard Report Work?
- Where Can I Find the Driver Safety Scorecard Report?
- How Are the Safety Scores Calculated?
- What Other Features Are Available
- Conclusion
- References
The cost of unsafe driving behavior
High procurement and operating costs mean fleets are constantly looking for savings and profit opportunities. We often think of achieving these by increasing productivity, reducing expenses, and mitigating vehicle downtime. However, one of the most overlooked costs of operating a fleet, regardless of industry or size, is driver safety.
Why safety?
A company's greatest asset is its employees — the culture, the competitive advantages, and the ability to drive businesses forward begins and ends with human capital. Tragically, motor vehicle crashes are the leading cause of death and injury for all ages, and for fleets this is a major concern.1 Accidents that happen on and off the job “have far-reaching financial and psychological effects on employees, their co-workers, family, and employers [1]." This is why investing in your employees’ safety and well-being is essential.
The National Highway Traffic Safety Association (NHTSA), Network of Employers for Traffic Safety (NETS), and US Occupational Safety & Health Administration (OSHA) strongly believe all fleets should have a safety program in place for their employees. The purpose of a driver safety program is to 1) save lives and reduce the risk of life-altering injuries; 2) protect your organization’s human and financial resources; and 3) guard against potential company and personal liabilities [1]. Driver safety programs can also act as a positive employee relations tool while simultaneously enhancing a company’s fleet safety.
Direct costs
The cost of ignoring safety can lead to expensive medical fees, court litigation and, in some cases, businesses being shut down. Employers collectively pay $60 billion annually for motor vehicle crashes involving their employees, and OSHA reports that each fatal car crash averages a payout of $500,000 [1]. This expense can exceed $1,000,000, depending on the severity and legal outcome [1]. Furthermore, accidents can increase employee benefits costs such as workers’ compensation, social security, and health and disability insurance.
Indirect costs
In addition to direct costs, indirect costs can take a toll on fleets’ operations and may not be easy to account for. A fleet’s productivity is significantly impacted when vehicles have to undergo replacement or maintenance repairs, and beyond the impact to assets, administrative costs1 can quickly add up when the employee(s) is unable to work.
There may also be instances where the company’s brand equity is negatively impacted due to the inability to meet customer service requirements, loss of business, or bad publicity. Other examples of indirect costs1 facing supervisors and fleet Managers include:
- Rescheduling or making special arrangements.
- Fleet manager's time to coordinate vehicle repair/replacement.
- Reassignment of personnel to cover for missing employee(s).
- Overtime pay to cover work of missing employee(s).
- Re-entry and retraining of injured employee(s).
- Administrative costs (documentation of injuries, treatment, abscences).
- Accident investigation costs.
Direct and indirect costs of vehicle collisions for fleets
Direct costs:
- Average Cost of Property Damage: $16,500
- Average Cost of Non-Fatal Injury: $74,000
- Average Cost of Fatality: $500,000
Indirect costs:
- Supervisor and Fleet Manager Time
- Vehicle Repair Downtime
- Reassignment of personnel to cover for missing employee(s)
- Overtime pay to cover work of missing employee(s)
- Re-entry and retraining of injured employee(s)
- Administration cost (documentation of injuries, treatment and abscences)
- Accident Investigation Cost
Statistics reported by OSHA [1]
Driver Safety
The United States Department Of Labor reports that “every 12 minutes someone dies in a motor vehicle crash, every 10 seconds an injury occurs, and every 5 seconds a crash occurs.” Just as alarming is the fact that many of these incidents occur on the job, or during the daily commute. Whether you employ a fleet of professional drivers, a mobile sales team, or the average commuter, employers often bear the cost of work-related motor vehicle accidents. By developing safe driving policies, employers reduce the risk to their employees, and to their bottom line [1].
A driver’s actions leading up to an accident will have the greatest impact on outcome and severity. There are times where drivers have little control over the circumstances, but NHTSA has found that 94% of car accidents are a result of what the driver did or did not do [7]. This means that with proper coaching and safety measures in place the majority of accidents are avoidable. According to NETS, investing in road safety can reduce a fleet’s crash rate by 50% which in turn, protects the lives of employees as well as other drivers on the road [3].
How Can Telematics Improve Safety?
Fleet telematics can be used to improve fleets’ safety performance. From real-time audible alerts to actionable information empowered by detailed reporting, telematics offers a wide spectrum of safety performance tools for all types of fleets.
Insurance Benefits
Using a fleet telematics platform can have a direct impact on insurance costs, with some companies realizing up to a 25% reduction in associated fees [6]. Insurance companies have found the use of telematics can lead to a 45% drop in accidents which may translate to lower insurance rates [2]. Telematics not only improves fleet safety, it can offer a direct return on investment by lowering costs associated with unnecessary insurance claims.
Driver Feedback
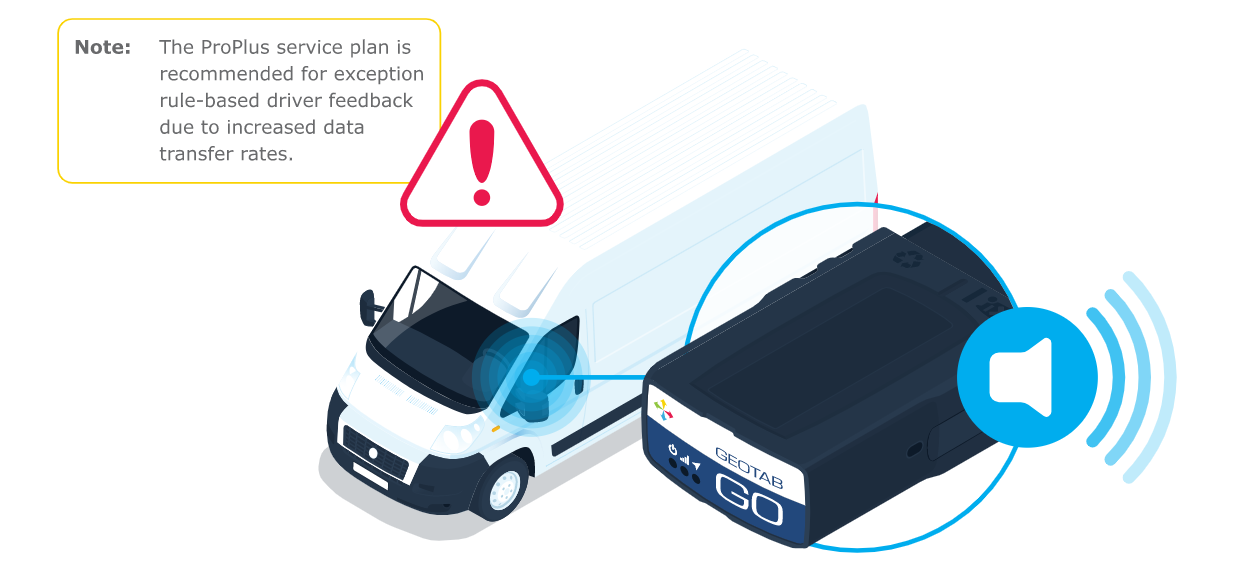
Driver feedback is a coaching tool that triggers an audible response from the GO device in the form of beeping. The two types of driver feedback are device-based and exception rule-based. Device-based driver feedback can be enabled in the MyGeotab Vehicles tab under the Driver Feedback section, and triggers a continuous string of beeps until the specific warning threshold is no longer being broken. Device-based driver feedback comes directly from the GO device through real-time detection of engine and speed data, which allows an immediate, true real-time audible response.
Exception rule-based driver feedback, also known as server-side feedback, is based on data that must first be processed by MyGeotab before alerting the driver. For example, a GO device sends vehicle speed data to MyGeotab to be compared with the posted road speed within the exception rule’s conditions. If those conditions are fulfilled, MyGeotab triggers the audible response from the GO device. The speed at which data is exchanged between the GO device and MyGeotab is dependant on the data transfer rate set by the Geotab service plan. If the data transfer rate is slower than the communication rate between the GO device and MyGeotab, driver feedback may be delayed. Exception rule-based feedback can be set up for exception rules under the MyGeotab Rules & Groups tab in the Exceptions page. View Geotab’s How-to video on setting up driver feedback on Geotab’s YouTube Channel.
What Does the Driver Safety Scorecard Focus On?
The Driver Safety Scorecard Report focuses on three primary elements of unsafe driving: aggressive driving, seat belt usage, and speeding. The report does not take into account distracted driving behavior; however, symptoms of distracted driving often overlap with other forms of unsafe driving.
Aggressive Driving
Aggressive driving can emerge in different ways. There may be times where a driver is not focusing on the road ahead and accelerates hard to catch up to the moving traffic. Moreover, a driver might not be focusing on traffic ahead and brakes harshly to avoid a collision. Distracted driving can lead to aggressive driving behavior, even if accidental.
On the other hand, driving conditions, especially for those who drive often and for long distances, can be stressful. Stressful driving can translate to frustrated driving, and frustrated drivers are more likely to exhibit aggressive driving behavior. There are many reasons why drivers become frustrated, including rude behavior, tailgating, being cut off, failure to yield, and passing in the shoulder lane. These examples can be viewed as aggressive driving behavior as well.
Traffic Congestion
Another common frustration for drivers is traffic congestion. Most people do not like traffic because of the time strain it has on their personal lives, but for professional drivers, the negative effects of traffic congestion can have direct financial repercussions. Aside from the typical annoyances of spending long hours in traffic, drivers also feel their productivity is adversely affected. Drivers are often paid by the mile, and with the Federal Motor Carrier Safety Administration’s (FMCSA) Hours of Service limitations to consider, drivers are inherently motivated to drive as far as they can in the least amount of time. When stuck in traffic, routes become less efficient, and attempts to make up for lost time can lead to aggressive driving behavior [1].
Accelerometer Data
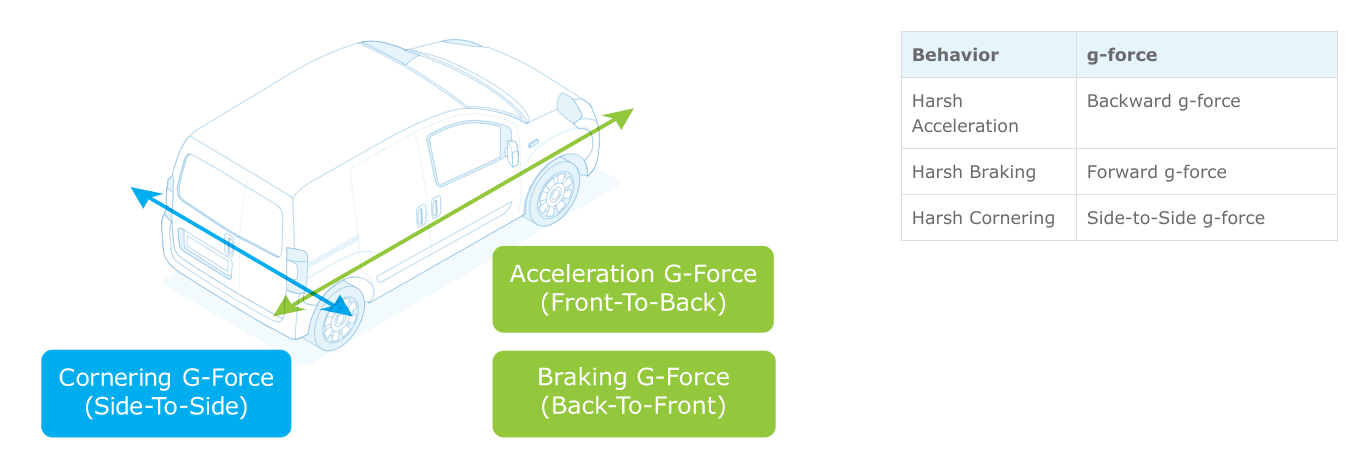
A sizable portion of the 6.8 million car accidents that occur each year are suspected to be caused by forms of aggressive driving, and this can be reduced through use of telematics [1]. While driving, g-force is exerted on different parts of the vehicle, and the GO device logs these events and uses conditional thresholds to determine the presence of aggressive driving. As vehicles experience jolting from hard acceleration, exertion from harsh braking, and side-to-side movement from harsh cornering, the GO device transmits these data points to Geotab’s Store and Forward servers for processing. The data is then pointed to a MyGeotab database where fleets can leverage accelerometer data-based exception rules and turn them into actionable coaching opportunities.
The illustration below displays the g-forces associated with the following aggressive driving behaviors:
Vehicle Class
Geotab collects billions of data points each day and through testing and analysis, has generated g-force benchmarks for different vehicle classes. These benchmarks have been integrated into MyGeotab to function as default performance thresholds for the Hard Acceleration, Harsh Braking, and Harsh Cornering exception rules. Fleets can use the default performance thresholds, arranged by vehicle class, to easily and accurately configure each accelerometer-based exception rule.
Note: If your fleet has more than one class of vehicle, we recommend creating Hard Acceleration, Harsh Braking, and Harsh Cornering rules for each class. You will also need to use a separate Driver Safety Scorecard report for each vehicle class.
Seat Belt Usage
Seat belts are the most effective safety instrument drivers have. According to the NHTSA, “buckling up” reduces the risk of death or serious injury for front seat occupants by 50%, and for truck drivers, wearing a seat belt reduces this risk by 60%.5 OSHA asserts that seat belt use can be credited with saving approximately 12,000 lives and preventing around 325,000 serious injuries each year in the US [1].
Wearing a seat belt is the easiest and most efficient preventative safety measure drivers can take, and instilling the importance of this is vital to a fleet’s overall safety. US employers spend an extra $5 billion dollars annually on traffic collisions involving employees who did not wear their seat belt while driving or riding as a passenger. Having knowledge of when employees fail to wear their seat belt is extremely important and highly useful in terms of coaching opportunities. Acting on this information can save the lives of your employees and significant costs to your business.
Seat Belt Detection
Geotab can detect when drivers are not wearing their seat belt. The information is sent to MyGeotab and can be referenced at any time regardless of there being an active seat belt exception rule. At the very least, Geotab strongly recommends turning on the default seat belt exception rule to enable exceptions reporting, which offers a facilitated look into which drivers are not buckling up.
Note: Seat belt data is gathered only if the vehicle can transmit it. Most vehicles support this functionality, but if one or more vehicles are not detecting seat belt, please contact your designated Product Support team for assistance.
Speeding
Speeding has been a factor in over 30% of US crash deaths since 2005.4 The NHTSA estimates the annual economic costs of speeding related crashes to be $40.8 billion, with employers picking up an $8.4 billion chunk of this total [1]. Speeding is arguably the most costly form of unsafe driving to US employers, and likewise the most preventable through telematics and proper coaching.
Posted Road Speed
Geotab Customers can define what constitutes speeding. Geotab utilizes the posted road speeds from HERE Maps and Open Street Maps (OSM) to determine when drivers are exceeding speeds based on the conditions they set in the speeding exception rules.
When creating a custom speeding exception rule, there are several posted road speed conditions to choose from. For the Road Speed Provider condition, the options are “All”, “Commercial”, and “Community”. If Commercial is selected the speeding rule only references posted road speeds provided by HERE Maps, while Community only references open-source posted road speeds provided by OSM. If the default option All is selected, the rule references the posted road speeds from both map providers using an algorithm to prioritize the more accurate speed based on what is “real” and what is “estimated”.
There are some roads, usually ones that are more remote, where the map provider does not have sufficient data to guarantee the road speed; in these instances, the map provider estimates posted road speeds. Geotab chooses the map provider with the most accurate road speed, but there is still a chance for the road speed in MyGeotab to be estimated. Customers can choose to include or exclude estimated posted road speeds by toggling the ON/OFF switch for “Exclude estimated speed limits”. If this switch is set to ON then the speeding rule conditions will exclude all estimated posted road speeds.
Customers can also use Geotab’s Update Posted Road Speed feature to instantly correct a road speed limit, or they can update the HERE Maps and OSM datasets directly through their respective websites. For reference, HERE Maps updates their posted road speed database once each quarter, and OSM updates their database on the first Monday of each month. Overall, referencing posted road speeds allows Geotab to dynamically compare vehicle speeds to the speed limit, offering Customers a powerful coaching tool to combat speeding.
How Does the Driver Safety Scorecard Report Work?
The Driver Safety Scorecard Report is designed to maximize driver safety and identify a fleet’s riskiest drivers. This report will complement any fleet’s safety measures, and act as a powerful tool for gauging their drivers’ safety risk.
Specifically, the Driver Safety Scorecard Report can help to:
- Increased driver safety
- Identify risky drivers
- Recognize safer drivers
- Reduce possible accidents
- Enhance internal safety policy
- Mitigate potential for traffic violations
- Lower vehicle maintenance costs
- Improve insurance rates
- Curb employee benefits costs
- Minimize vehicle downtime
Exception Rules
Exception rules are the grading tools used to measure driver’s safety performance, and having appropriate exception rule conditions is vital for the scorecard’s effectiveness. The report requires six exception rules and specifies exactly which rules are needed; however, thresholds and conditions within these exception rules are at the discretion of the fleet.
It is important to select the proper exception rule conditions to ensure you are capturing the desired data. Think of each exception rule condition as a filter, and until all conditions are met, the data is filtered from your visibility. If improper exception rule conditions are set, important data is filtered out, or unimportant data filtered in.
Since the Driver Safety Scorecard scores are based on this data, they too are impacted which can lead to an inaccurate depiction of safety performance. To avoid this, ensure the chosen accelerometer, seat belt, and speeding exception rules are set appropriately.
We also recommended using custom or advanced exception rules, particular to the fleet’s needs and coaching opportunities. Once all conditions are met, the rule starts collecting data and sequentially creates an exception rule event in MyGeotab. Watch Geotab’s How-to video on setting up exception rules.
Advanced Exception Rules
The Hard Acceleration, Harsh Braking, and Harsh Cornering (accelerometer) rules are based on the g-force threshold settings found on MyGeotab, and each rule is calibrated according to vehicle class. There may be a need to create custom versions of these rules if the default thresholds do not contain a suitable option. This same idea applies to seat belt, speeding, and excessive speeding rules. Custom variations of the default rules are not required, but are recommended to ensure your fleet is graded fairly and accurately. The required excessive speeding rule is not a default exception rule and must be created as a custom exception rule.
Common customization options for seat belt and speeding exception rules are the duration and distance conditions. For seat belt, the default speed threshold is 6.21 mph (10 kmph), which may need to be raised or lowered. A distance condition can also be added to a seat belt rule to only capture events after a certain distance has accrued (i.e. only capture events after the driver has not worn their seat belt for 100 meters). The default speeding rule has a duration condition of 20 seconds, which may be adjusted as well.
Although fleets can use the default seat belt and speeding rules in the Driver Safety Scorecard Report, implementing customized versions of these rules, specifically outfitted for the fleet, will lead to greater scoring accuracy. View Geotab’s How-to video on setting up custom rules.
False Positive Data
Seeing a questionable number of exception rule events (i.e too large or too small) could indicate false positive data. Signs of false positive data for accelerometer-based events can indicate that g-force threshold settings are too sensitive, or not sensitive enough. If this occurs, toggle the sensitivity for each rule to find the ideal threshold/conditions. False positive data can also originate from seat belt and speeding rules.
A GO device that does not properly detect seat belts can lead to an excessive number of events, or a lack of data altogether. The same can be said for speeding rules that do not reference accurate posted road speeds, or rely too heavily on estimated data. Be on the lookout for abnormally high or low exception rule events to prevent your drivers’ scores from being unfairly impacted. Even if the data looks slightly questionable, please contact your designated Product Support team for assistance.
Exception Rule Weights and Classifications
Exception rule weights and classifications offer an additional level of personalization to ensure effective, relevant and useful application of the Driver Safety Scorecard Report.
Exception Rule Weights
While exception rules are required, each rule’s weight is user-defined allowing each rule to reflect its importance to the fleet. As performance improves in one area the focus may shift to another, and the weights can be adjusted. Any weight can be applied to any rule, as long as the total equals 100%.
Exception Risk Classifications
The Driver Safety Scorecard Report gives fleets the ability to set the scoring ranges that coincide with each risk classification. It is important to fairly calibrate the risk classification ranges to accurately reflect each driver’s level of risk. The four risk classifications are Low Risk, Mild Risk, Medium Risk, and High Risk. Since operating a vehicle contains inherent risk, it is impossible for a driver to be completely without it, regardless of past and present safety performance.
Each driver receives a score ranging from 0-100 based on their driving behavior. The default ranges identify a driver as High Risk if their overall score falls below 60. However, depending on the sensitivity of the exception rule conditions, the ranges may need adjusting in order for the risk classification to align with the fleet’s safety performance expectations.
Where Can I Find the Driver Safety Scorecard Report?
The Driver Safety Scorecard report is available on the Geotab Marketplace. Several additional setup options are available. Geotab strongly encourages you to use these options to customize the report to your fleet safety program.
Learn more at marketplace.geotab.com

Considerations
Before generating the report, there are several features in the report and in MyGeotab that require attention as they can impact the report's accuracy and utility. They are the exception rules on which the scoring is based, the options concerning the weight of each exception rule, and the risk classifications for drivers. To learn how to import a report into MyGeotab, view our Reporting Basics training video here.
How Are the Safety Scores Calculated?
Geotab uses several calculation methods to determine driver safety risk in the Driver Safety Scorecard Report. The methods are designed to normalize scores for each exception rule category, ensuring they are uniformly scaled and calibrated in order to accurately gauge driver safety risk.
Methods
All scoring methods utilize Total Driving Distance. This is to ensure that scores stay proportional and fair regardless of distance driven. A driver who travels twice the distance of another driver is likely to incur twice the exception events; considering distance traveled allows for an accurate and fair grading system.
Note: The Driver Safety Scorecard Report takes into account the distance unit of measurement; meaning the scores will be the same regardless of whether the distance is in miles or kilometers.
1 — Event Count
This scoring method is the Exception Rule Event Count in relation to the Total Driving Distance. The scoring has been calibrated to award a score of 0 if a driver incurs 10 events or more, over 100 miles driven or fewer, or the equivalent (i.e. 5 events over 50 miles).
100 - (Exception Rule Event Count x 1000) / Total Driving Distance
For example, if a driver’s Exception Rule Event Count is 3 and their Total Driving Distance is 100 miles, the score would be 70.
100 - (3 events x 1000) / 100 miles = 70
2 — Violation Percentage
This scoring method considers the severity of the exception rule event(s) in relation to the Total Driving Distance. The Exception Rule Event Percentage is calculated by dividing the Exception Rule Event Distance (distance traveled in violation) by the Total Driving Distance (total distance traveled). This computes the percentage of distance traveled in violation. This percentage is then multiplied by the specific Multiplier which applies (see definition below) to determine the deduction factor, and then deducted from 100.
100 - (Exception Rule Event Distance / Total Driving Distance) x Multiplier
For example, if a driver’s Exception Rule Event Distance is 10 miles and their Total Driving Distance is 400 miles, their Exception Rule Percentage is 2.5%. The Multiplier for the percentile this Exception Rule Percentage falls in is 13, therefore the driver’s score would be 67.5.
100 - (10 miles / 400 miles) x 13 = 67.5
Multipliers:
The purpose of using multipliers to calculate driver safety scores is to normalize, calibrate and score exception rule events out of 100. The adjacent chart displays the Exception Rule Event Percentage range for each multiplier. For Driver Safety Scorecard calculations, the multiplier rises as the Exception Rule Event Percentage rises. In other words, the worse a driver performs, the greater the penalty to their score. When a driver repeats unsafe driving behavior, the multiplication factor increases proportionately and dramatically lowers their score. The more the behavior is repeated, the higher the risk profile, and the higher the visibility to the fleet manager. Repeated exceptions not only elevate the risk of the driver, they elevate the risk of the entire fleet. Conversely, the better a driver performs, the lower their multiplication factor, and the higher their safety score.
3 — Hybrid
This scoring method is a hybrid of the Event Count Method and Violation Percentage Method. The Hybrid Method assigns a weight to each of the scoring calculation methods to consider both the Exception Rule Event Count and the Exception Rule Event Percentage when evaluating safety risk. This scoring method puts a higher weight on the Exception Rule Event Percentage (70%) and a lower weight on the Exception Rule Event Count (30%) so that the severity of the exception rule event(s) remains the focal point of the scoring calculation methodology.
0.3 x Event Count Method + 0.7 x Violation Percentage Method
For example, a driver’s Exception Rule Event Count is 10, Exception Rule Event Distance is 5 miles, and Total Distance Traveled is 250 miles. Their Exception Rule Percentage is 2.0% with the Multiplier for this percentile being 12. The driver’s score would be 71.2.
Event Count Method Score: 100 - (10 events x 1000) / 250 = 60
Violation Percentage Method Score: 100 - (5 miles / 250 miles) x 12 = 76
Final [Hybrid Method] Score: 0.3(60) + 0.7(76) = 18 + 53.2 = 71.2
Calculations
Harsh Acceleration: 100 — (Event Count x 1000) / Total Driving Distance
Harsh Braking: 100 — (Event Count x 1000) / Total Driving Distance
Harsh Cornering: 100 — (Event Count x 1000) / Total Driving Distance
Seat Belt: 0.7(100 — ((Event Distance / Total Driving Distance) x Multiplier)))
+ 0.3(100 — (Event Count x 1000) / Total Driving Distance))
Speeding: 100 — ((Event Distance / Total Driving Distance) x Multiplier))
Excessive Speeding: 100 — (Event Count x 1000) / Total Driving Distance
What Other Features Are Available
The Driver Safety Scorecard Report offers several features that can help visualize your fleet’s safety performance. These features act as complements to the safety scores, and help expand on the report’s information.
Average Fleet Score
The Average Fleet Score gives the average fleet safety score for all vehicles or drivers. This helps gauge your fleet’s overall safety performance in relation to risk classification expectations (found on the Report tab of the Driver Safety Scorecard Report). The Micro Risk Breakdown graph is a miniature version of the risk breakdown graph found on the Risk Breakdown tab. The graph offers a visual breakdown of risk based on the risk classification expectations across the entire fleet.
Risk Breakdown
The Average Fleet Score gives the average fleet safety score for all vehicles or drivers. This helps gauge your fleet’s overall safety performance in relation to risk classification expectations (found on the Report tab of the Driver Safety Scorecard Report). The Micro Risk Breakdown graph is a miniature version of the risk breakdown graph found on the Risk Breakdown tab. The graph offers a visual breakdown of risk based on the risk classification expectations across the entire fleet.
The table (below) displays the number of vehicles that fall within each risk classification. Both of these features are available on the Risk Breakdown tab of the Driver Safety Scorecard.
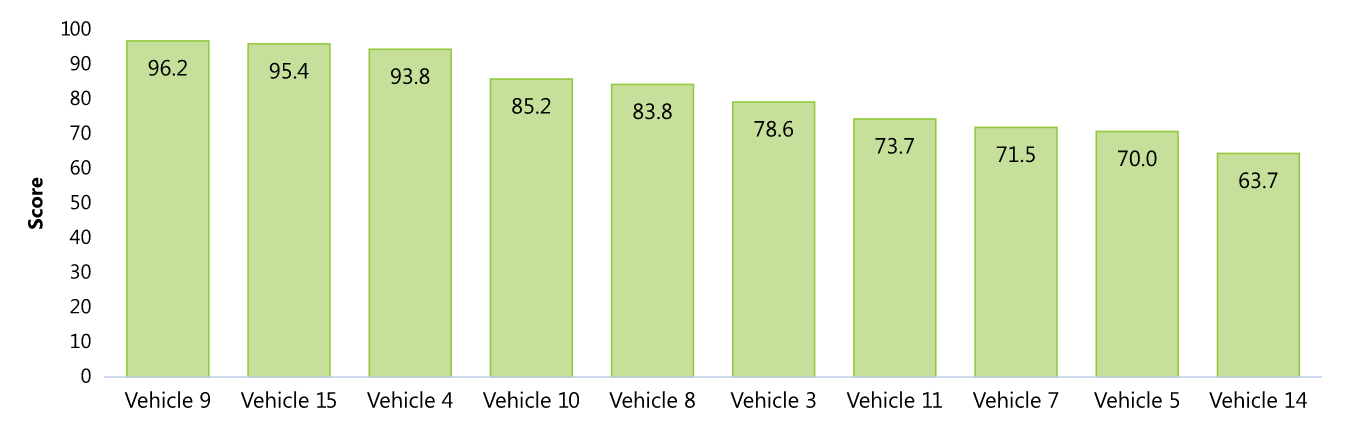
Top Performers
The Top Performers graph displays the top 10 performers based on their overall safety score. This graph helps visualize the highest performing drivers in your fleet, and complements any driver safety reward programs.
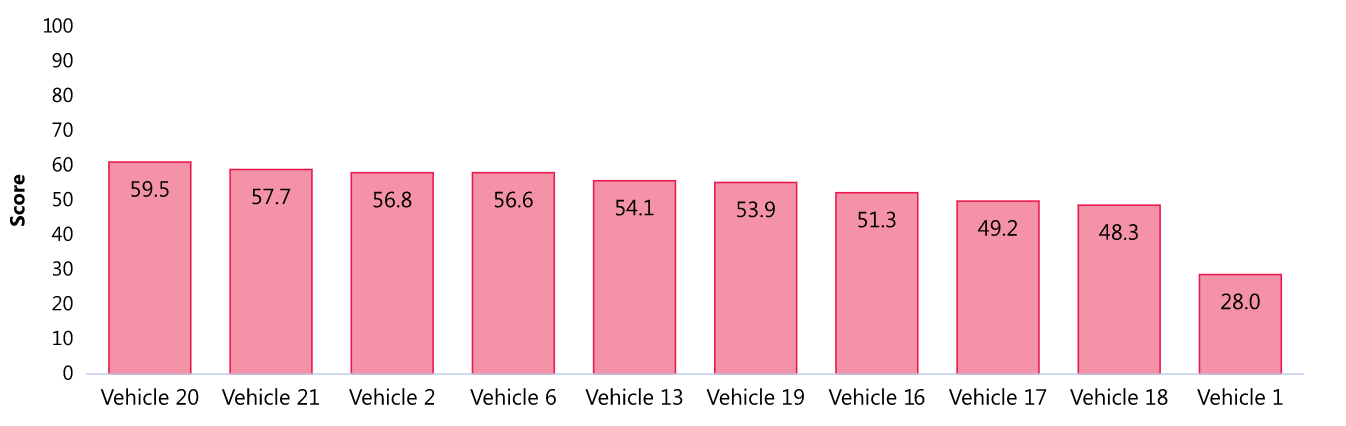
Bottom Performers
The Bottom Performers graph displays the bottom 10 performers based on their overall safety score. This graph helps visualize the lowest performing drivers in your fleet, and complements any driver safety coaching programs.
Differential
The Differential displays the difference between the average score of the top ten performers and the average score of the bottom ten performers. This data helps to understand the degree of disparity between the best and worst performing drivers in your fleet.
Conclusion
Safety is an essential part of managing a fleet and placing emphasis on safety practices can lead to a tremendously positive outcome for business health, culture, and profitability. The direct and indirect costs of unsafe driving behavior are largely avoidable, especially with effective coaching and well-established safety measures. Through telematics, fleets have direct visibility into unsafe driving behaviors, and the tools to set acceptable thresholds in which to analyze and measure them.
The Driver Safety Scorecard integrates seamlessly into Geotab’s extensive suite of solutions to capture aggressive driving, seat belt usage, and speeding data, transforming it into intelligible safety scores used to identify at-risk drivers. Proper and diligent use of the Driver Safety Scorecard helps fleets transform unsafe driving behaviors and accomplish safety objectives. By leveraging the Driver Safety Scorecard, fleets can help protect the lives of their employees, reduce insurance costs, and increase overall business profitability.
References
- United States Department of Labor, Occupational Safety and Health Administration. (n.d.). Guidelines for Employers to Reduce Motor Vehicle Crashes. [Online]. Available: https://www.osha.gov/Publications/motor_ vehicle_guide.pdf
- V. Taylor. (2014, Oct. 13). Attention Fleet Manager: Fleet Safety is Important Tool. Driver’s Alert. [Online]. Available: https://www.driversalert.com/attention-fleet-manager-fleet-safety-is-important-too/
- NETS. (2016, Mar.). Cost of Motor Vehicle Crashes to Employers — 2015TM. [Online]. Available: http://trafficsafety. org/costofcrashes/FindingsAtAGlance-NETSCostofCrashes-2015.pdf
- NHTSA. (2014, May). Traffic Safety Facts 2012 Data: Speeding. [Online]. Available: https://crashstats.nhtsa.dot. gov/Api/Public/ViewPublication/812021
- NHTSA. (n.d.). Seat Belts. [Online]. Available: https://www.nhtsa.gov/risky-driving/seat-belts
- Insurance Hunter Team. (2016, Jul. 21). How much could you save on car insurance with telematics? Insurance Hunters.ca. [Online]. Available: https://www.insurancehunter.ca/blog/how-much-could-you-save-car-insurance- telematics
- NHTSA. (2015, February). Traffic Safety Facts 2015 Crash Stats. Critical Reasons for Crashes Investigated in the National Motor Vehicle Crash Causation Survey. [Online]. Available: https://crashstats.nhtsa.dot.gov/Api/Public/ ViewPublication/812115
Post Tags
About Geotab
Geotab is a global leader in connected operations, video telematics and AI-powered insights. Trusted by more than 100,000 customers — from small and mid-size fleets to Fortune 500 enterprises and public-sector organisations, including the U.S. federal government, Geotab connects approximately 6 million vehicles and assets and processes 100 billion data points daily. With ISO/IEC 27001:2022, SOC2, FIPS 140-3 and FedRAMP authorisations, Geotab’s open platform and 700+ partner ecosystem unify safety, compliance and operations in a single system. Our mission: a safer, more efficient, and more sustainable world in motion. Learn more at www.geotab.com/apac/ and follow us on LinkedIn or visit Geotab News and Views.
GEOTAB and GEOTAB MARKETPLACE are registered trademarks of Geotab Inc. in Canada, the United States and/or other countries.
© 2026 Geotab Inc.All Rights Reserved.
This white paper is intended to provide information and encourage discussion on topics of interest to the telematics community. Geotab is not providing technical, professional or legal advice through this white paper. While every effort has been made to ensure that the information in this white paper is timely and accurate, errors and omissions may occur, and the information presented here may become out-of-date with the passage of time.
Recent News

Data-driven smart city insights: intelligent datasets and urban analytics for digital cities
September 26, 2022

Building a more agile fleet
September 26, 2022
.jpg)
Medium and heavy-duty electrification trends
September 26, 2022

Government fleet electrification: Making the transition to EVs
September 26, 2022