
Increasing fleet profitability with telematics: COI vs ROI
Table of Contents
The Challenge: Finding New Cost Savings
Today’s fleet managers are continuously looking for ways to manage their fleet’s total cost of ownership (TCO), minimize their operating expenses, and increase profitability. However, identifying new opportunities for savings can be difficult. The Fleet Savings Summary Report estimates a fleet’s existing and potential cost savings in the areas of safety, fuel, maintenance, and productivity based on rich telematics data. This white paper shows how fleets can use this new tool to identify strategic savings opportunities and grow their bottom line.
Step One: Get to Know Your Cost of Ignoring (COI)
Most fleet managers are familiar with the concept of Return on Investment (ROI). But what is the Cost of Ignoring (COI)? The Cost of Ignoring is the amount of lost savings resulting from a situation where a company fails to undertake a strategic business investment in an area that would otherwise improve operational efficiency. In other words, the cost of not making an investment in operating efficiency is lost savings, or higher costs.

Why is COI so important?
The current economic climate continues to challenge businesses across all industries. Consolidation, downsizing, and declining profit margins have become unfortunate realities. As a result, companies are being forced to focus efforts in areas that maximize bottom line returns as opposed to top line growth.
This is especially true for fleet managers, whose fleet management costs often make up the majority of their company’s total operating budget. Although the recent decline in oil prices has provided a much needed reprieve at the pumps, most (or all) of these savings are being eroded by weaker demand and increased competition. If revenues flatline, focus must shift to cost-reduction, which is at the core of a COI analysis.
Calculating COI with the Fleet Savings Summary Report
To illustrate the existing and potential savings associated with the effective deployment of telematics, Geotab created an Excel report based off of the standard monthly Geotab Risk Management report.
In this report, the potential savings (which can be thought of as the COI) represent cost reduction opportunities that could be achieved through investments in proactive driver management initiatives.
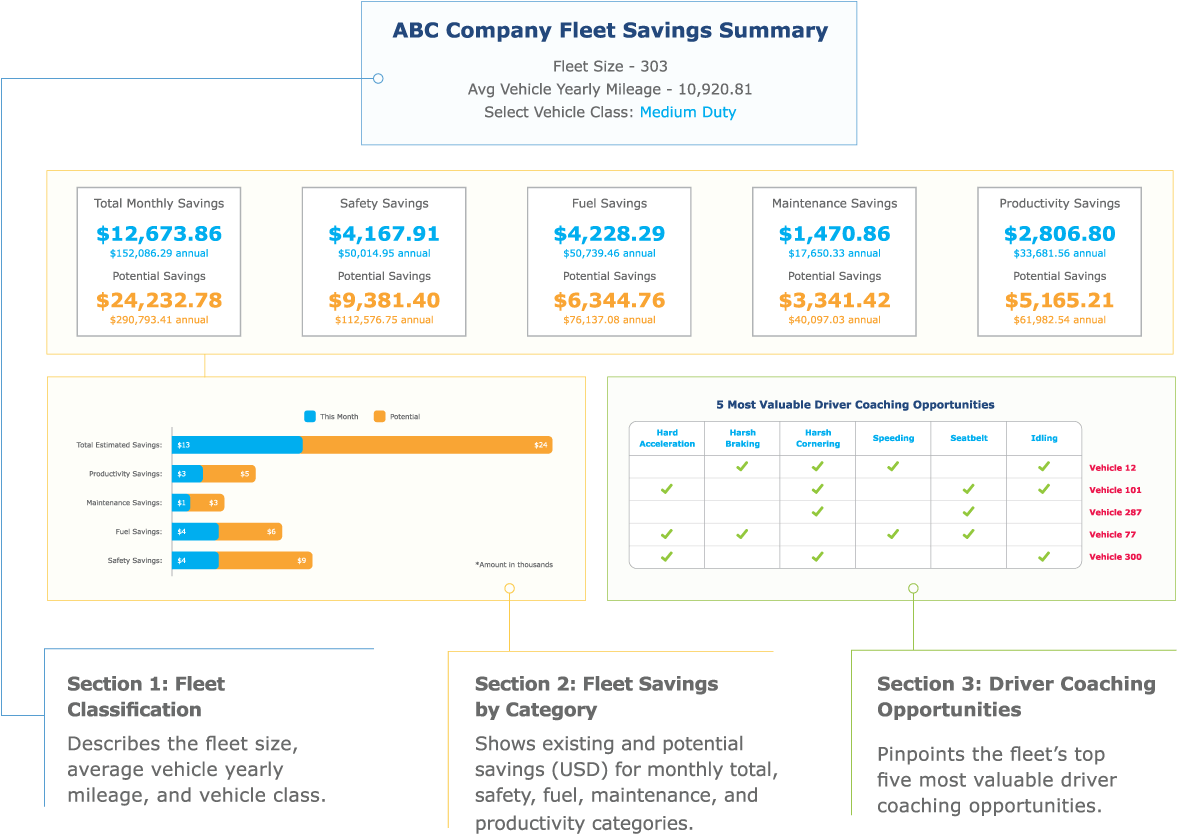
A Snapshot of Your Fleet’s Existing vs. Potential Savings
The following table quantifies the magnitude of these potential savings using the calculations summarized throughout this white paper. As seen below, telematics can have a significant positive impact on a fleet’s overall operating costs.
Estimated Potential Monthly Telematics Saving Per vehicle (USD) for HD, MD & LD Fleets

These savings were determined through the use of the Fleet Savings Summary Report and its proprietary driver scoring algorithms, as illustrated below.
The Nature of Fleet Costs: The Impact of Vehicle Class and Mileage
To calculate a fleet’s existing and potential telematics-related savings, a detailed breakdown of its operating costs were required. Geotab conducted a combination of primary and secondary North American market research to develop fleet-specific Cost-per-Mile (CpM) models, including sub-models for fixed vehicle-related costs, variable vehicle-related costs, and driver salary-related costs.
The variable nature of these models were found to be highly dependent on two specific fleet characteristics: 1) vehicle class and 2) vehicle mileage.
Vehicle Class — The vehicle makeup of a fleet has a big impact on its operating costs. For example, Heavy-Duty (HD) trucks have a very different CpM breakdown than Medium-Duty (MD) and Light-Duty (LD) vehicles. For this reason, the Fleet Savings Summary Report segregates CpM data into three vehicle classifications: HD, MD, and LD. HD represents a fleet composed of Class 6, 7, and 8+ trucks, MD represents a fleet composed of Class 3, 4, and 5 vehicles, and LD represents a fleet composed of Class 1 and 2 vehicles(1).
In each case, a different CpM model was determined and is used in the report. For HD trucks, Geotab used data from the American Transportation Research Industry (ATRI)(2). For MD and LD vehicles, data was referenced from statistics by Automotive Fleet(3).
Vehicle Mileage - Similar to vehicle class, a vehicle’s annual mileage can have large effects on its CpM values. This is true for two reasons:
- Fixed vehicle and driver costs will be spread over less total miles.
- Vehicles that drive fewer miles will likely spend a larger portion of their driving time on municipal roads rather than highways or freeways, which can increase the vehicle’s variable costs per mile (e.g. lower MPG, higher maintenance per mile, etc.).
Consequently, CpM is almost always negatively correlated to a vehicle’s annual mileage. In other words, the more miles that a vehicle drives in a given month, the lower its CpM will be.
In order to determine a fleet’s average annual mileage, the Fleet Savings Summary Report automatically calculates an average monthly mileage for the entire fleet, and multiplies it by twelve to get the estimated annual value. The results can be seen in the “Avg. Vehicle Yearly Mileage” box in Section 1 of the Fleet Savings Summary Report. The report subsequently uses this estimated annual mileage to adjust the CpM data for each vehicle based on the same research referenced above.
Scoring Methodology
To calculate a fleet’s COI, each driver in the report is scored in each of the respective savings categories described below: safety, fuel, maintenance, and productivity. Scoring is based on exceptions per engine-hour criteria using specific Geotab rulesets targeted to each savings category. These scores are subsequently normalized using proprietary Geotab performance benchmarks so as to characterize “good” versus “bad” drivers. Based on the output of this driver benchmarking exercise, an adjusted driver score is applied to the available cost savings defined in the sections below to arrive at existing and potential savings values for each vehicle. By summing each individual vehicle’s savings, an overall monthly savings is determined and presented in Section 2 of the Fleet Savings Summary Report.
Report Validation
In addition to the secondary market research described above, primary market research was used to validate the findings. The resulting HD, MD, and LD CpM data was sent to a number of fleet managers, who were asked to verify and edit the data as required. The resulting changes were integrated into the report to ensure the highest level of accuracy.
Step Two: Identify Key Opportunities for Cost-Savings
When reviewing the market research referenced throughout this white paper, four specific telematics-related cost savings categories were identified: safety, fuel, maintenance, and productivity.
Safety: Reducing Costly Vehicle Collisions
Work-related vehicle crashes can cause devastating financial losses for companies. The U.S. Occupational Health & Safety Administration (OSHA) reports the following figures(4):
Average cost to an employer:
Job-related collision: $16,500
Collision resulting in injury: $74,000
Collision involving a fatality: $500,000+
Collisions, speeding, and aggressive driving behaviors were found to be a contributing factor in 31% of all fatal crashes, while seat belt use was found to decrease the risk of a fatality by between 45% and 60% (4).
Quantifying Driver Safety Savings
As described above, aggressive driving behavior can have a big impact on a fleet’s safety-related operating costs. Consequently, fleet managers can improve profitability by monitoring driver behaviors and proactively coaching drivers via the use of telematics.
Advanced in-cab driver feedback tools (such as GO TALKTM) and real-time audible alerts can drastically reduce the likelihood of an on-duty accident. In fact, insurance companies have reported a 45% reduction in accidents and a 50% reduction in accident payout costs via the use of telematics(5). Moreover, this reduction in accident claims can translate into a 5% to 25% reduction in comprehensive insurance costs(6).
To quantify these savings, the Fleet Savings Summary Report uses a proprietary safety-scoring algorithm to determine the existing and potential savings for a fleet. The resulting savings are summarized in Section 2 of the Fleet Savings Summary Report, in both numerical and graphical representations.
Fuel: Controlling Runaway Fuel Costs
For many fleets, fuel is one of the largest expenses(7). Managing fuel costs can be a complicated endeavor involving a number of variables, including fluctuating gas prices and inconsistent driver behavior. In fact, the U.S. Department of Energy reports that rapid acceleration and heavy braking can reduce fuel economy by up to 33% for highway driving and 5% on city roads(8). Idling and speeding can also have drastic impacts on MPG(8).
Quantifying Fuel Savings
Market research has shown that the effective use of telematics can reduce fuel costs by as much as 14% (9). Once again, driver coaching is instrumental in achieving these cost reductions. For example, for every 5 mph over 50 mph, a driver can reduce their MPG by approximately 7-14% (10). Therefore, getting drivers to slow down and observe the speed limit translates into saved money. Furthermore, real-time driver idling alerts can be used to drastically cut down on vehicle idling costs and wasted fuel.
Similar to the safety-scoring methodology described above, the Fleet Savings Summary Report uses a proprietary fuel scoring algorithm to determine a fleet’s existing and potential fuel-related savings. In doing so, driver speeding incidents and idle time were found to be the largest contributor to fuel waste, which resulted in fuel-related savings as summarized in Section 2 of the Fleet Savings Summary Report.
Maintenance: Reducing Planned and Unplanned Repair and Maintenance
Preventive maintenance is a regular part of vehicle ownership, but additional repairs due to aggressive driving and vehicle misuse are an unnecessary cost to a fleet. Market research suggests that excessive maintenance-related costs are primarily driven by aggressive driving behaviors. In particular, hard accelerations, harsh cornering, and harsh braking cause harmful wear and tear on critical vehicle components, drastically increasing a vehicle’s variable CpM. These effects materialize as reduced tire life, reduced brake life, more frequent scheduled maintenance, and most significantly, more frequent non-scheduled maintenance and repair. These non-scheduled events often result in large losses to a company that relies on its fleet assets for day-to-day operations. In fact, a non-scheduled maintenance interruption can result in lost profits of between $400 to $700 per day, in addition to the cost of repairs(11).
Quantifying Maintenance and Repair Savings
The Organization for Economic Co-operation and Development (OECD) reports that telematics technology can help a company reduce maintenance and repair costs by as much as 14%.13 As described above, much of these savings are tied to driver behavior, and therefore real-time driver management tools and in-cab alerts are the best way to minimize unnecessary wear and tear on your fleet’s vehicles.
By managing a fleet’s aggressive driving behaviors, fleet managers can minimize their maintenance and repair costs, and in turn generate savings similar to those summarized in Section 2 of the Fleet Savings Summary Report.
Productivity: Increasing Work Efficiency
Driver compensation is often a large portion of a fleet’s operating budget, and as a result, inefficient labor can be very expensive for fleet managers. Among the many ways to calculate labor productivity, vehicle idle time is an important metric. Even though idle time only captures a component of employee productivity, it is the only metric that the Fleet Savings Summary Report utilizes for its productivity-based scoring algorithm. As acknowledged in the beginning of this white paper, this is a generalization that will be addressed in subsequent releases of this fleet savings tool.
Quantifying Productivity Savings
Market research suggests that telematics can increase workforce productivity and reduce labor costs by up to 12% (14).This allows companies to make more customer stops and cut out unproductive mileage. The net effect is higher revenues and lower costs.
Using the Fleet Savings Summary Report’s proprietary productivity-based scoring algorithm, this increase in workforce productivity translates into productivity-related savings as summarized in Section 2 of the Fleet Savings Summary Report. To maximize these savings, fleet managers must limit their fleet’s idle labor, which is approximated using vehicle idle hours per trip.
Step Three: Proactively Manage Driver Behavior
The Fleet Savings Summary Report highlights your fleet’s top five most valuable driver coaching opportunities by vehicle, as shown in Section 3 of the Fleet Savings Summary Report. These drivers can be interpreted as a fleet’s most costly drivers, and therefore represent the best “bang for your buck” driver coaching opportunities.
By focusing real-time driver coaching efforts on the most costly drivers, a fleet can maximize their savings and take a step towards increased profitability. As a result, a fleet manager should expect to see different drivers on this list from month-to-month as driver coaching efforts take effect.
Proactive management is key. Aberdeen Group reports that top performing organizations are “96% more likely than their peers to utilize technology that alerts management, and the driver, of exceptions being made (i.e., speeding, harsh cornering, etc).”(15)

Tools for Driver Behavior Management
Geotab offers a number of tools to help fleet managers proactively manage driver behavior. Here are some top recommendations. Visit the Geotab Marketplace for more Add-Ons, MyGeotab Add-Ins, free custom reports, software solutions, and mobile apps.
Reporting
Safety Driver Scorecard
MyGeotab dashboard or emailed report. See risk & safety scores of drivers. Identify which drivers need training and measure driver performance against company goals.
- Increase driver safety
- Reduce possible accidents
- Proactively manage behavior
- Identify risky drivers
Top 5 Speeding Violations Report
MyGeotab dashboard or email reports. Know which drivers in your fleet are the worst speeders and therefore create the most risk.
- View your top 5 speeders
- Set custom time periods
- Increase fleet safety
Last 3 Months Fuel Trend Report
MyGeotab dashboard or emailed report. View total fuel used by fleet. Determine whether or not fuel usage has decreased after implementing new company policies for drivers, especially if also compared with miles driven and idling statistics
- Cut fuel costs
- Easily sport trends
- 3 month horizon
Weekly Idle Cost Daily Time Report
MyGeotab dashboard or emailed report. Shows the overall idle costs for an entire fleet. Trended data shows how your fleet is performing over time.
- Determine COI for idle times
- Reduce costs and keep a healthier fleet
- Set the current fuel price to get a true cost of idling
MyGeotab Standard Reports for Productivity & Fleet Optimization
Boost fleet and driver productivity with MyGeotab's reports on Customer Visits, Driver Congregation, and more. Cut costs with Fuel Usage and Fill-Ups reports. Maintenance History, and Maintenance Reminders
- Confirm Job Completion
- Monitor Productivity
- Monitor Fuel Consumption
- Reduce downtime
Driver Feedback
Geotab GO TALK in-Vehicle Verbal Feedback
In-cab spoken alerts notify drivers of critical driving events such as speeding, harsh braking, seat belt unbuckle, and excessive idling. Set warning for engine light on and low tire pressure. Custom rules feature for personalized messaging
- Improve driver behavior
- Manage aggressive driving
- Reduce accident rates and liability costs
- Minimize vehicle wear and tear
- Improve fuel economy
Mobileye Advanced Collision Prevention
Collision avoidance system mounts to the inside of the windshield and is about the size of a toll pass tag. The system provides visual and audible alerts to the driver in case of imminent collisions.
- Reduce the number and severity of accidents, driver infractions
- Reduce fuel and maintenance costs
Get Your Copy of the Fleet Savings Summary Report
To determine your fleet’s potential savings and opportunities, request your own Fleet Savings Summary Report from the Geotab Marketplace. The report will be sent to you along with instructions on how to load and run it. If you have any questions, please contact your Authorized Geotab Reseller.
Conclusion
Today’s fleet managers are under extreme pressure to manage their fleet costs despite deteriorating economic conditions. These costs include the procurement and disposal of the vehicles, fixed and variable operating costs, labor costs, as well as collision and insurance claims.
Using telematics data, fleet managers can discover new cost savings opportunities across their entire fleet. By pursuing these savings opportunities, a fleet manager can reduce their COI, improve their fleet’s operating efficiency, and grow their bottom line. Conversely, managing a fleet without a telematics platform is likely to result in higher costs and poor visibility for improvement.
This paper demonstrates that telematics is a valuable tool that fleet managers should use to better understand and proactively manage their vehicles and drivers, and ultimately run a more profitable fleet.
Future Considerations
In an ongoing effort to provide industry leading actionable data solutions to our customers, Geotab is already working towards a second-generation solution that will improve the overall effectiveness and accuracy of this tool. The first priority for this second-generation solution will be to develop better and more applicable driver scoring criteria to address the issues identified throughout this white paper. By identifying better scoring tools that are more representative of a fleet’s actual savings opportunities, we can better determine where fleets should focus their efforts so as to maximize profitability. As we develop these second-generation tools, we will make them available to you.
Reporting Accuracy
Geotab has worked hard to ensure the accuracy of the information provided in this white paper and in the Fleet Savings Summary Report. It should be noted that all data herein is highly normalized, and therefore is only applicable to a generic fleet. Consequently, the savings values referenced throughout this paper and report do not represent exact fleet savings, and should only be used as an estimate of the existing and potential savings attributed to the use of telematics. Additionally, the Fleet Savings Summary Report is not suited for a mixed fleet of Heavy-Duty, Medium-Duty, and Light-Duty vehicles. For mixed fleets, vehicles should be grouped into their respective vehicle classifications, and the report should be run individually for each group. Lastly, it should be noted that the calculations described within this paper assume that a fleet’s savings are directly correlated to the number of Geotab-specific driving incidents/exceptions. Geotab acknowledges that this generalization is a source of error in the Fleet Savings Summary Report’s savings values.
Comments or questions related to this white paper can be emailed to: proftablefleet@geotab.com
For more fleet tips and best practices, visit: www.geotab.com/blog/
References
- U.S. Department of Transportation. Federal Highway Administration. (2013, May) Traffic Monitoring Guide. Retrieved from http://www.fhwa.dot.gov/policyinformation/tmguide/tmg_fhwa_pl_13_015.pdf
- American Transport Research Institute. (2015, September). An Analysis of the Operational Costs of Trucking: 2015 Update.
- Automotive Fleet. (2014). Statistics: Car Operating Costs. Retrieved from http://www.automotive-fleet.com/fc_resources/stats/affb14p36-38.pdf
- NETS, NTSHA & OSHA. (n.d.). Guidelines for Employers to Reduce Motor Vehicle Crashes. Retrieved from https://www.osha.gov/Publications/motor_vehicle_guide.pdf
- Taylor, V. (2014, October 13). Attention Fleet Manager: Fleet Safety is Important Too! Driver’s Alert. Retrieved from https://www.driversalert.com/attention-fleet-manager-fleet-safety-is-important-too/
- Zhukov, K. (2014, March 31). How Telematics Can Help You Save on Car Insurance. Navigators Insurance.
- Sandoval, K. and Wolski, C. (2016, May). Fleet Best Practices for Saving Money at the Pump. Automotive Fleet. Retrieved from http://www.automotive-fleet.com/channel/fuel-management/article/story/2016/05/fleet-best-practices-for-saving-money-at-the-pump.aspx
- U.S. Department of Energy. (n.d.) Many Factors Affect Fuel Economy. Retrieved from https://www.fueleconomy.gov/feg/factors.shtml
- Telematics to save fuel costs. (n.d.) Telematics Wire. Retrieved from http://telematicswire.net/telematics-to-save-fuel-costs/
- U.S. Department of Energy. (n.d.). Driving More Efficiently. Retrieved from https://www.fueleconomy.gov/feg/driveHabits.jsp
- Understanding the true cost of fleet vehicle downtime. (n.d.) Retrieved from http://fleetanswers.com/content/understanding-true-cost-fleet-vehicle-downtime
- Wisconsin Partners for Cleaner Air. (n.d.). Eco-Driving and Driving Behavior. Retrieved from http://www.cleanairwisconsin.org/airquality/ecodriving.php
- Wright, J. (2010, May). Towards smarter supply chains. OECD Observer, No 279. Retrieved from http://m. oecdobserver.org/news/fullstory.php/aid/3275/Towards_smarter_supply_chains.html
- Nolan, K. (2015, September). How to Increase Fleet Productivity Using Telematics. Retrieved from http://www.automotive-fleet.com/channel/gps-telematics/article/story/2016/02/how-telemetics-is-optimized-in-the-fleet-market.aspx
- Pinder Jr., A. (2014, August). Fleet Management Trends: Mobile Assets Move Beyond the Map. Retrieved from http://www.aberdeen.com/research/9405/rr-fleet-management-2014/content.aspx
Post Tags
About Geotab
Geotab is a global leader in connected operations, video telematics and AI-powered insights. Trusted by more than 100,000 customers — from small and mid-size fleets to Fortune 500 enterprises and public-sector organizations, including the U.S. federal government — Geotab connects approximately 6 million vehicles and assets and processes 100 billion data points daily. With ISO/IEC 27001:2022, SOC2, FIPS 140-3 and FedRAMP authorizations, Geotab's open platform and partner ecosystem unify safety, compliance and operations in a unified system. Our mission: a safer, more efficient and more sustainable world in motion. Learn more at www.geotab.com and follow us on LinkedIn or visit Geotab News and Views.
GEOTAB and GEOTAB MARKETPLACE are registered trademarks of Geotab Inc. in Canada, the United States and/or other countries.
© 2026 Geotab Inc.All Rights Reserved.
This white paper is intended to provide information and encourage discussion on topics of interest to the telematics community. Geotab is not providing technical, professional or legal advice through this white paper. While every effort has been made to ensure that the information in this white paper is timely and accurate, errors and omissions may occur, and the information presented here may become out-of-date with the passage of time.
Recent News
AOBRD vs ELD: What's the Difference?
June 18, 2024

Driver safety scorecards: the first step to a safer fleet
December 3, 2018

ELD best practices for fleet success: 9 helpful tips on electronic logging
November 2, 2018
Rethinking Last-Mile Delivery
July 9, 2026