
Driver safety reporting
Your employees are your company’s greatest asset. Understand how drivers are performing and where coaching is needed with Geotab driver safety reporting.
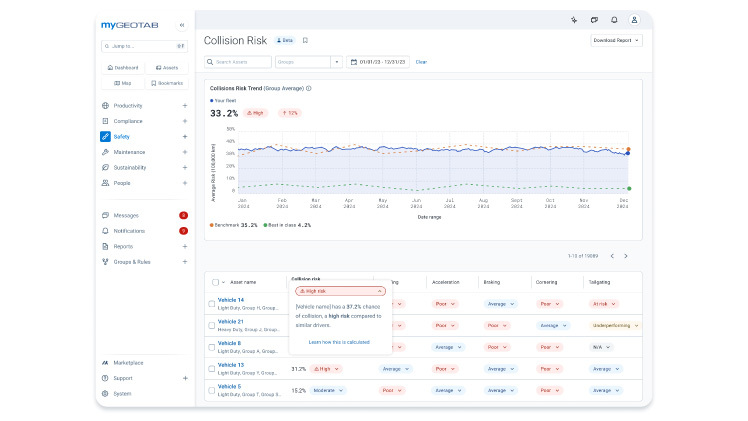
Understand driver safety trends
Safety dashboard reports provide a quick overview of your fleet’s riskiest drivers and overall safety performance score. Instead of traditional scorecards, predictive insights now highlight potential collision risks before they happen. Fleets can also access driver-specific reports and benchmarking, even in shared vehicles, to ensure fair and effective coaching.
90%
reduction in high risk driver ratios
PepsiCo
52%
reduction in hard-braking events
euroloo
Set up safety alerts
Don’t wait until after an incident to act. Create custom fleet rules and get email or text notification when violations occur. With GO Focus native AI dash cams you can go a step further and get instant in-cab voice feedback so drivers correct risky habits the moment they occur.
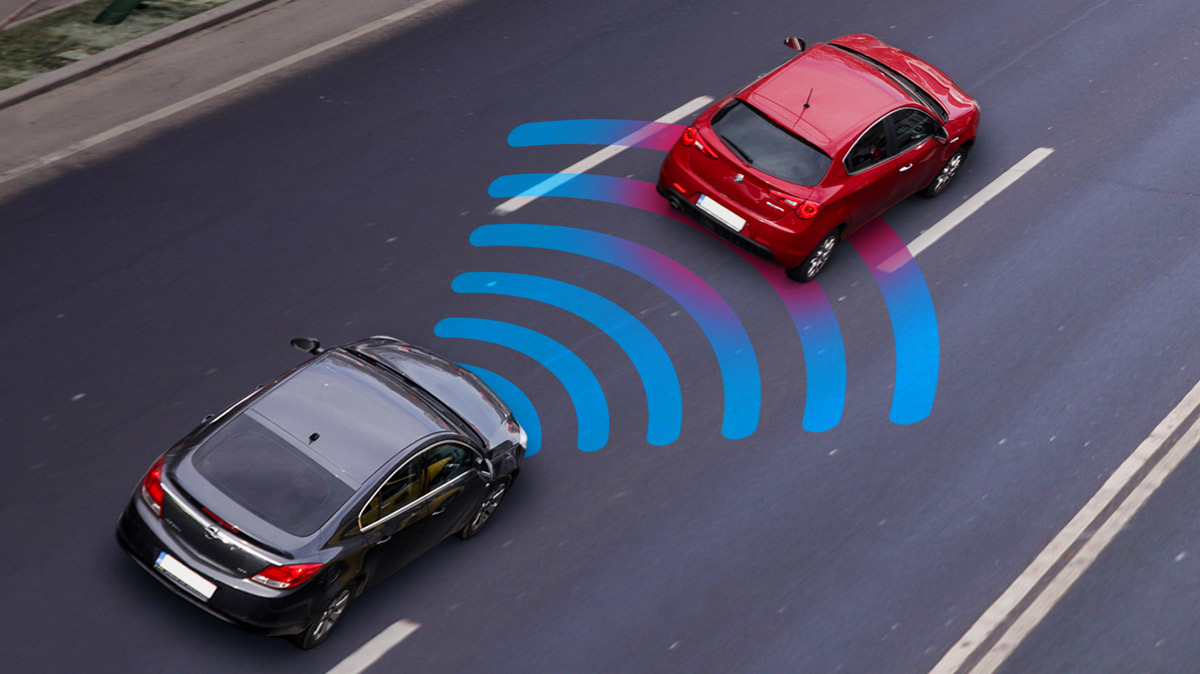
Advanced driver-assistance
Help your drivers recognize and avoid the risk of collision before it happens. ADAS insights give fleet managers clarity on patterns of risky behaviors for targeted improvements.

Do you know your cost of ignoring?
What you don’t know might be costing you. The costs related to vehicle collisions can add up. Tackle fleet safety head-on and invest in the well-being of your drivers with Geotab’s customizable driver safety reporting.
Monitor these metrics and more:
- Speeding over the posted speed limit
- Harsh braking
- Sharp cornering
- Tailgating
- Backing up while driving
- After hours use of vehicle
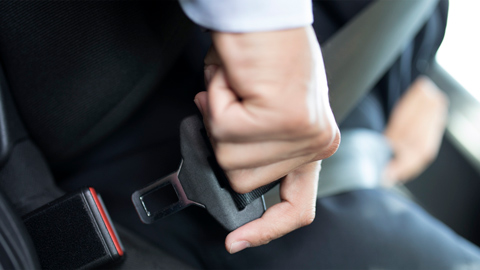
- Driving with no seat belt
- Distracted driving
- Driver fatigue
- Smoking or phone use
Reporting solutions from the Geotab Marketplace
Get specialized reports. Track HOS violations, see your fuel economy, estimate potential fleet savings, and assess driver safety.
Driver safety tips and tools

Commonly asked questions
What is a Driver Safety Report?
Driver safety reports use predictive insights to identify risks before they lead to collisions. Speeding, hard braking, and distraction are tracked in real time, giving fleets a clear view of where intervention is needed. New driver-specific reports and benchmarking tools ensure fair comparisons, helping managers focus coaching where it has the most impact.
How can the reports improve driver safety?
Driver safety reports can identify speeding offenses, driving hours, seat belt use, sharp turns and hard braking.
Why are driver safety reports important?
Driving behaviors are important factors in vehicle maintenance planning, such as brake and tire replacement. They are important tools for minimizing accidents, vehicle downtime and ensuring driver safety.
What kinds of driver safety report does Geotab offer?
Geotab offers: Driver safety scorecards that examine the following key points:
- Vehicle speed
- Seat belt use
- Use of the vehicle after working hours
- Aggressive driving behavior
- And more with GO Focus Family of dashcams
This data can be analyzed in relation to driving time or distance traveled.
Driving hours violation alerts, which help fleet managers and vehicle operators identify drivers who violate their country's driving hours laws. Identifying these trends is extremely important because tired drivers have slower reaction times and may even fall asleep at the wheel.
Ready to increase fleet safety?
Let us show you how simple it is to use our web-based software and native GO Focus family of dash cams to improve fleet safety.