Module III – How can you benchmark your fleet safety – and why?
On the road to fleet safety, knowing how you compare to like fleets helps you make sense of your safety metrics. Are you ahead, going with the flow or falling behind?
Committing to fleet safety means tracking and reporting safety metrics consistently and striving to improve continuously. Driver and fleet safety scores highlight how you are performing compared to your internal performance indicators, but how do you stand up next to similar fleets? How do your drivers and assets compare to drivers and vehicles at similar fleets?
This is where fleet benchmarking comes in. Benchmarking is the process of comparing your fleet's safety performance to like fleets, allowing you to identify areas where you excel and areas where you can improve and helping you set your safety goals.
What is safety benchmarking?
Safety benchmarking involves comparing your fleet against like fleets determined by vehicle classes, fleet sizes and use cases. These comparative insights help you understand which safety categories your fleet is excelling in, where it might be falling behind and what you can do to improve your drivers’ habits.
There are three types of benchmarks that help you understand your safety performance compared to other fleet. These include:
- Fleet benchmark – This compares your overall fleet's safety performance to a peer group of similar fleets. These fleets are chosen based on characteristics like the types of vehicles they have, the type of work they do and where they operate and where they operate.
- Asset benchmark – This compares the safety performance of an individual vehicle to a peer group of similar vehicles in other fleets.
- Driver benchmark – This compares a driver's safety performance to a peer group of similar drivers in other fleets.

3 ways to benchmark your fleet
Industry reports: Many organizations publish industry reports that provide aggregated data on fleet safety performance. These reports can give you a general sense of how your fleet compares to the industry average.
Networking and collaboration: Networking with other fleet managers and participating in industry events can provide valuable opportunities to learn about the fleet safety performance of your peers.
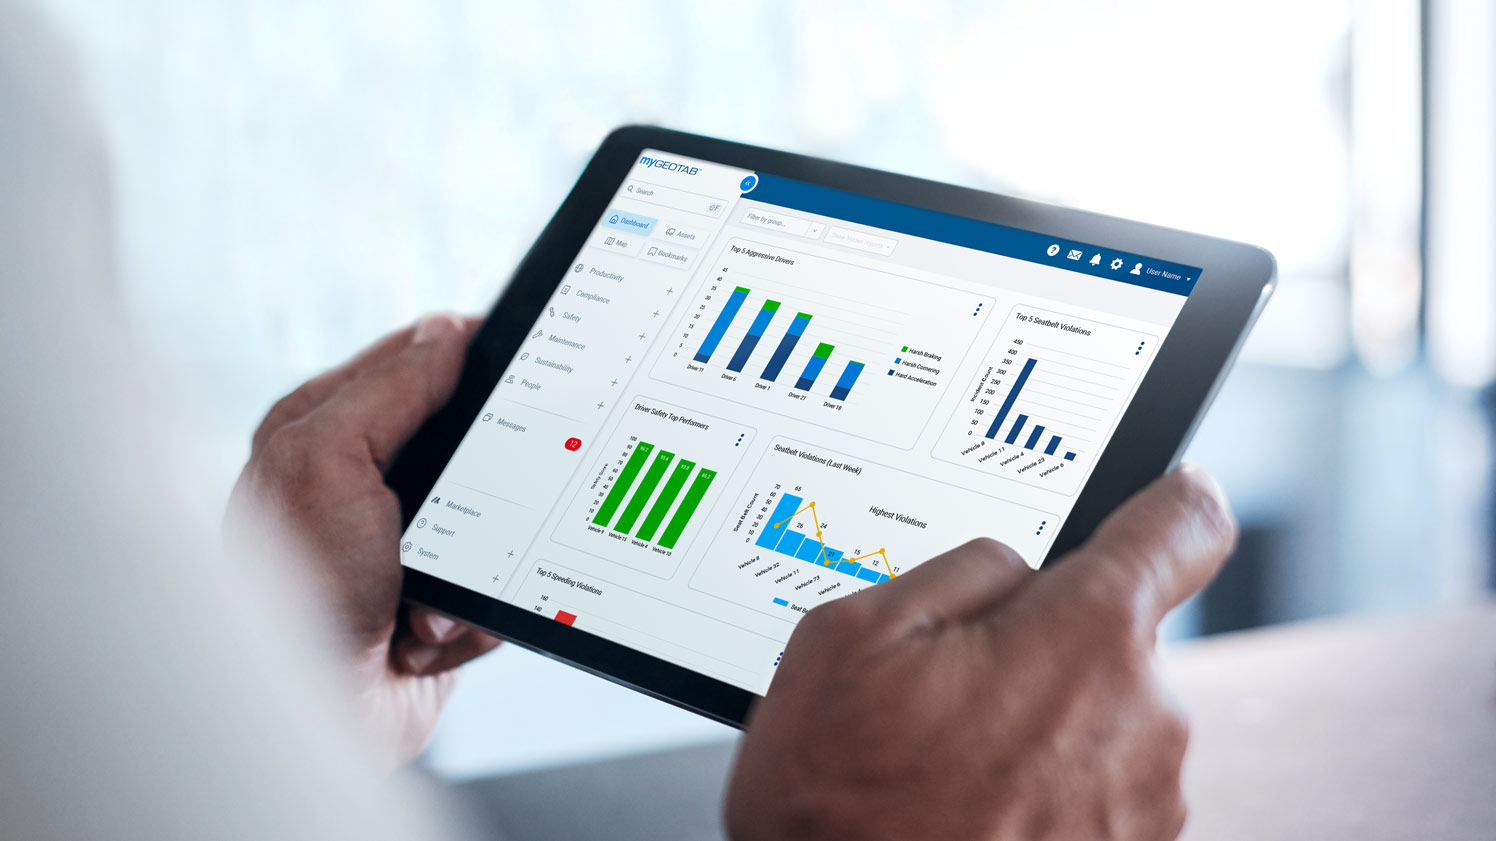
Telematics solutions: Telematics solutions like Geotab’s offer benchmarking tools, also known as digital twin benchmarking, that allow you to compare your fleet's safety performance using both driver scorecards and predictive collision risk score. It allows users to create different views based on vehicle usage or department to tailor their safety analysis and interventions to specific groups of drivers or vehicles. For example, a fleet manager could create separate views for drivers who operate heavy trucks versus those who drive light-duty vehicles, as the safety risks and priorities may differ between these groups.
How is AI leading to an evolution of safety benchmarking?
While driver scorecards have been the traditional method for benchmarking fleet safety, the emergence of advanced AI capabilities is enabling a shift to more accurate benchmarking using predictive collision risk rates. This transition allows for a more comprehensive and nuanced assessment of fleet safety performance, enabling more effective benchmarking and improvement strategies.
.svg)
Safety Benchmarking Using Driver Scorecards
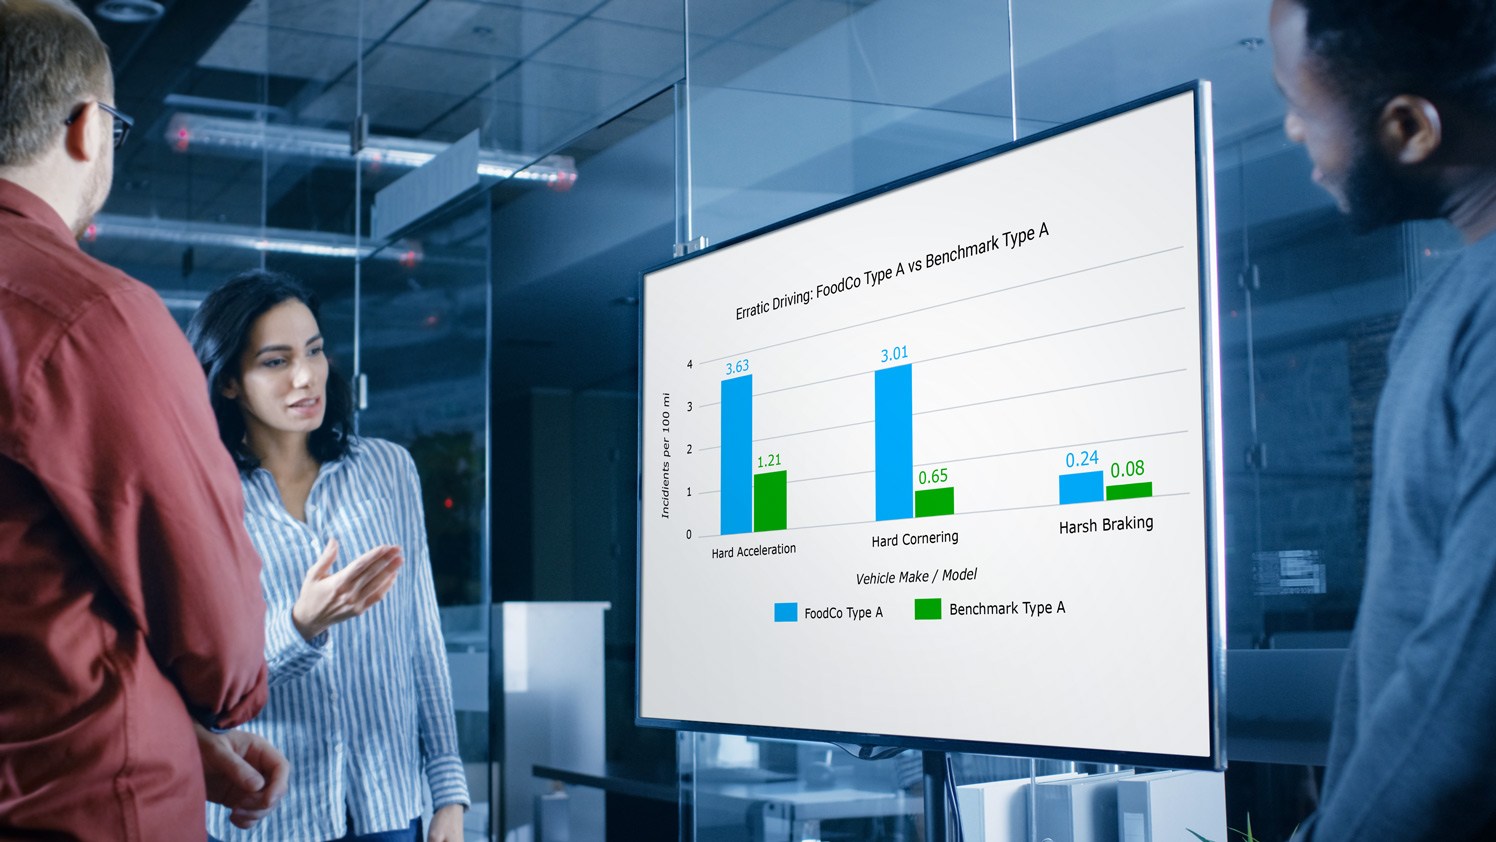
Traditionally, fleets have used driver safety scorecards to determine how their drivers perform in terms of speeding, harsh braking and other risky behaviors compared to similar fleets, such as those with comparable fleet sizes or operating in similar industries. However, it is important to be aware of the limitations of benchmarking using driver scorecards. Every fleet uses different weighting for calculating the safety metrics in their driver scorecards. For instance, one fleet might assign a higher weight to speeding violations while another prioritizes harsh braking incidents. As a result, even when benchmarking against similar fleets, there are important variables that likely do not match, leading to an "apples-to-oranges" comparison. This inconsistency makes it difficult to accurately compare safety performance between fleets. Driver scorecards also don’t account for contextual information like routes, road and weather conditions, times of day and vehicle types, which all play an important part in safety risk. A driver traveling a rural route at night with minimal traffic faces different safety risks than a driver navigating a congested urban area during rush hour.
Safety Benchmarking Using Predictive Collision Rates
Advancements in AI and machine learning are enabling a shift towards benchmarking by predictive collision risk rates, leading to a true apples-to-apples comparison between similar fleets. However, due to the complexity of the analysis, this is only possible using a telematics solution with advanced safety features, such as AI-powered risk assessment tools and predictive analytics capabilities.
An example of this is Geotab’s Predicted Collision Risk tool; it can predict the likelihood of collisions for fleets similar to yours with a proprietary AI model that clusters these like fleets into groups. This tool accounts for contextual factors like driver behavior, vehicle type, and operating environment to provide a more accurate assessment of collision risk. The model then compares them against all of Geotab’s anonymized data to determine the probability of a future collision. Both the average and the best collision likelihood for similar fleets to yours over the next 100,000 kilometers or miles is computed and presented, so you can see how your fleet fares in relation.
Learn more about predictive collision risk in Module II..
How can fleet benchmarking help enhance safety?
Fleet benchmarking can provide all types of government fleets with crucial information to help them improve their safety efforts.
Identify areas for improvement
By comparing your performance to that of other similar fleets, you can identify specific areas where your fleet needs improvement. This allows you to focus your efforts and resources on the areas that will have the greatest impact on safety. For example, if your fleet has a higher rate of backing incidents compared to similar fleets, targeted training on reversing procedures can be implemented.
Track progress over time
Benchmarking allows you to track your progress over time and measure the effectiveness of your safety interventions. Ongoing tracking helps you ensure that your safety program is making a real difference and is crucial for the long-term sustainability of safety initiatives.
Securing additional budget
Benchmarking data can help you secure additional budget requests for safety programs, especially if the data is backed by cost savings data.
Maintain legal and regulatory compliance
Benchmarking helps you align your safety practices with local, state and federal regulations, reducing legal risks. By benchmarking and documenting your performance, you can demonstrate compliance with legal requirements and standards. This proactive approach can help avoid penalties and lawsuits.
Enhance stakeholder engagement
Benchmarking and sharing results with stakeholders (e.g., city councils, unions, the public) increases transparency and accountability, fostering trust and support for safety initiatives. This can lead to greater buy-in and cooperation from all parties involved.
Build public trust
Demonstrating your commitment to safety through benchmarking and continuous improvement builds public trust and shows that you are taking proactive steps to protect your drivers and the community. Sharing benchmarking results with the public can increase transparency and accountability.
Regular users of Geotab’s safety benchmarking capabilities have seen:

Collision rates drop by 19.1%

Harsh braking decline by 11.8%

Harsh cornering go down by 5.6%

Speeding decrease by 6.4%
Fleet benchmarking lets you know your position on the road and the challenges you face
Fleet benchmarking is more than just a data exercise; it's a strategic tool for public administration agencies to navigate the complexities of fleet safety. By comparing your fleet performance against similar operations, you gain critical insights into areas needing improvement, discover best practices and maintain compliance with regulations.
Benchmarking is about knowing where you stand. It’s about the peace of mind that comes from understanding your fleet's strengths and weaknesses. It’s about the confidence of demonstrating to the community that you are actively working to enhance safety. It’s about the relief of knowing you're aligning with legal requirements and protecting your drivers.
By embracing fleet benchmarking, public administrators don't just manage fleets; they safeguard lives, build trust and pave the way for a safer future. Let benchmarking be the compass that guides your fleet toward excellence and helps keep every journey a safe one.