
Driver safety reporting
Understand driver safety trends

Set up safety alerts
Advanced collision avoidance


Do you know your cost of ignoring?
- Speeding over the posted speed limit
- Harsh braking
- Sharp cornering
- Backing up while driving
- After hours use of vehicle
- Driving with no seat belt
Reporting solutions from Geotab Marketplace
Find specialised reports tailored to different scenarios. Solutions include ways to determine fuel economy, estimate potential fleet savings, and assess driver safety.
Commonly asked questions
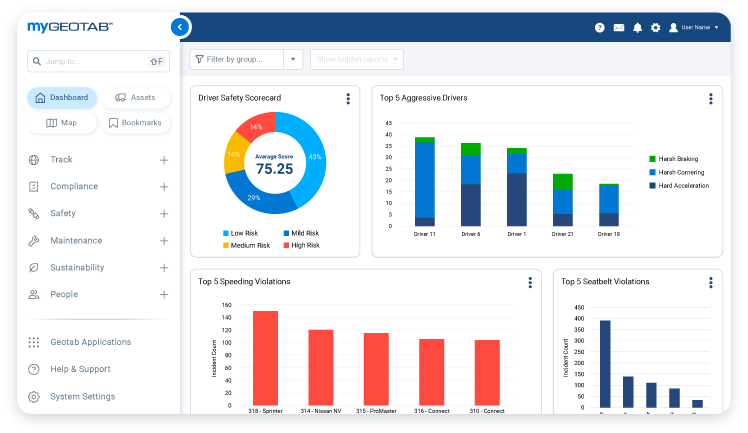
What is a Driver Safety Report?
Driver safety scorecards identify the most common traits in dangerous driving: aggressive driving, not using seat belts and speeding. They also identify symptoms of driver distraction such as hard braking and inconsistent speeds to compensate for traffic jams. Other reports provide information about collisions with other vehicles, pedestrians or objects such as poles or overhead obstacles.
How can the reports improve driver safety?
Safety reports provide essential information on driver behaviour that could not otherwise be collected when vehicles are not being monitored on the road. They identify both positive and negative behaviours, so drivers can be rewarded or accompanied if needed.
Driver safety reports can identify speeding offences, driving hours, seat belt use, sharp turns and hard braking.
What kinds of driver safety report does Geotab offer?
Geotab offers:
Driver safety scorecards that examine the following key points:
- Vehicle speed
- Seat belt use
- Use of the vehicle after working hours
- Aggressive driving behaviour
This data can be analysed in relation to driving time or distance travelled.
Driving hours violation alerts, which help fleet managers and vehicle operators identify drivers who violate their country's driving hours laws. Identifying these trends is extremely important because tired drivers have slower reaction times and may even fall asleep at the wheel.
Mobileye collision reports (available free of charge on the Geotab Marketplace) that identify and warn drivers and fleet managers of route changes, potential collisions with vehicles and pedestrians, and stopping distances. This data is calculated in relation to the distance travelled by the vehicles.
Why are driver safety reports important?
Driver safety reports can help fleet managers identify careful drivers and drivers' attitudes to the company's vehicles, productivity and reputation. They can also be used for monitoring to identify areas for improvement.
Driving behaviours are important factors in vehicle maintenance planning, such as brake and tire replacement. They are important tools for minimising accidents, vehicle downtime and ensuring driver safety.