Trucks outperform passenger vehicles for urban road efficiency in five of seven European capitals, Geotab data reveals
Geotab data reveals commercial fleets achieve better road efficiency than passenger cars in five out of seven European cities.
September 7, 2026
•3 minute read
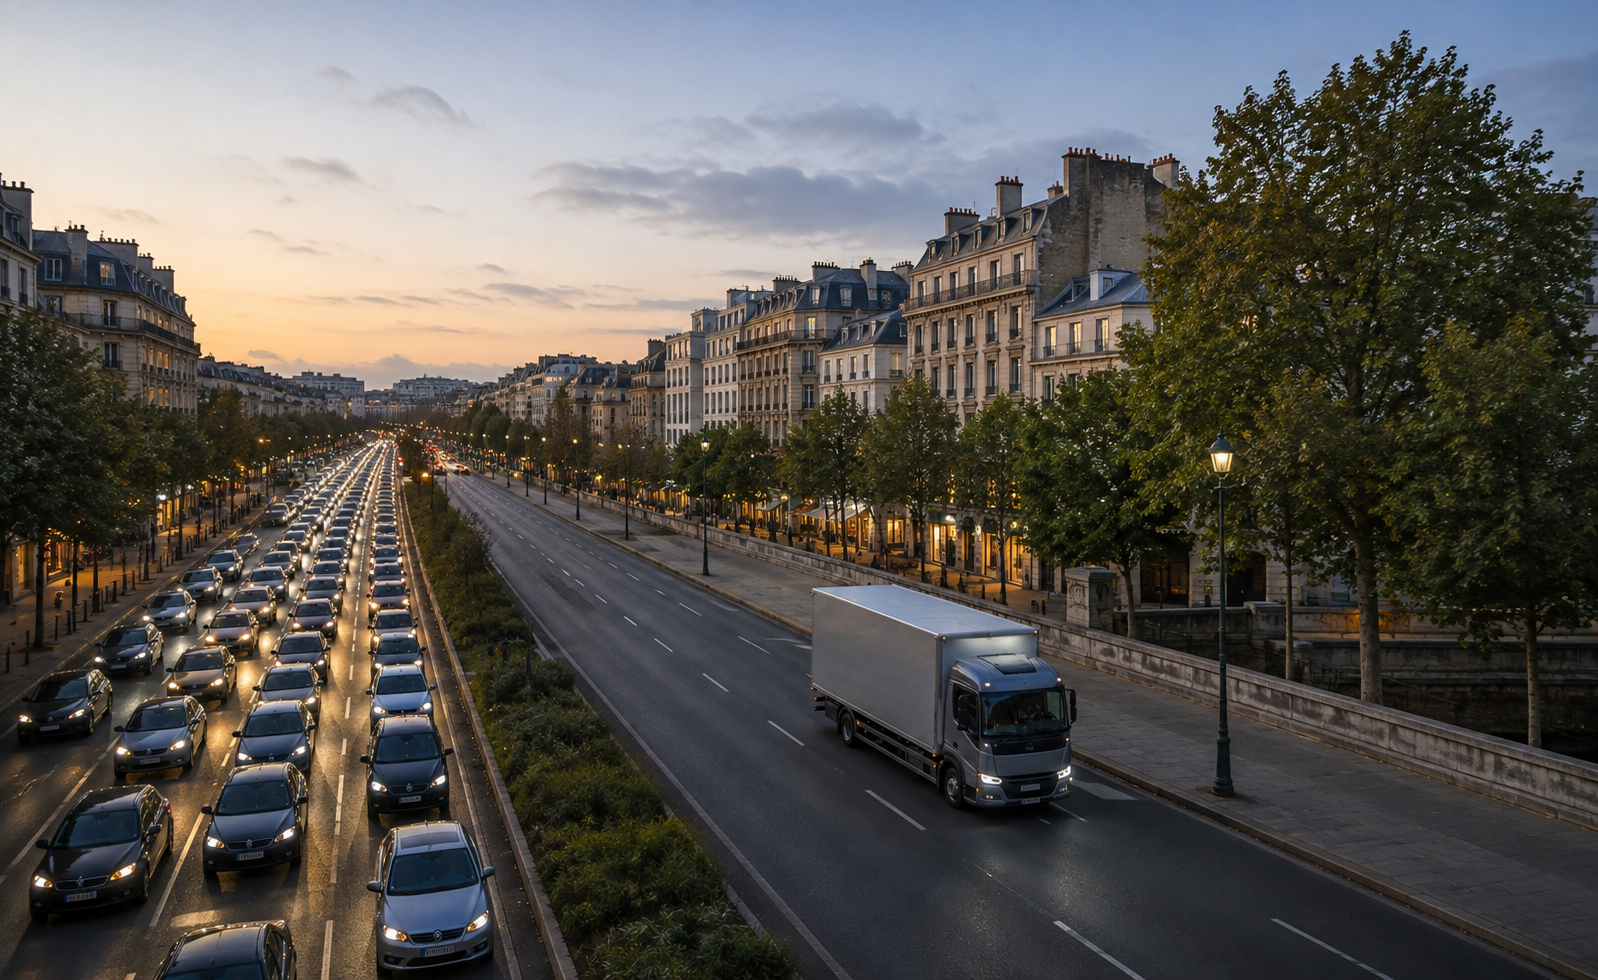
London and Madrid are the only cities where cars outperform trucks; Rome records the largest truck advantage at 26 points
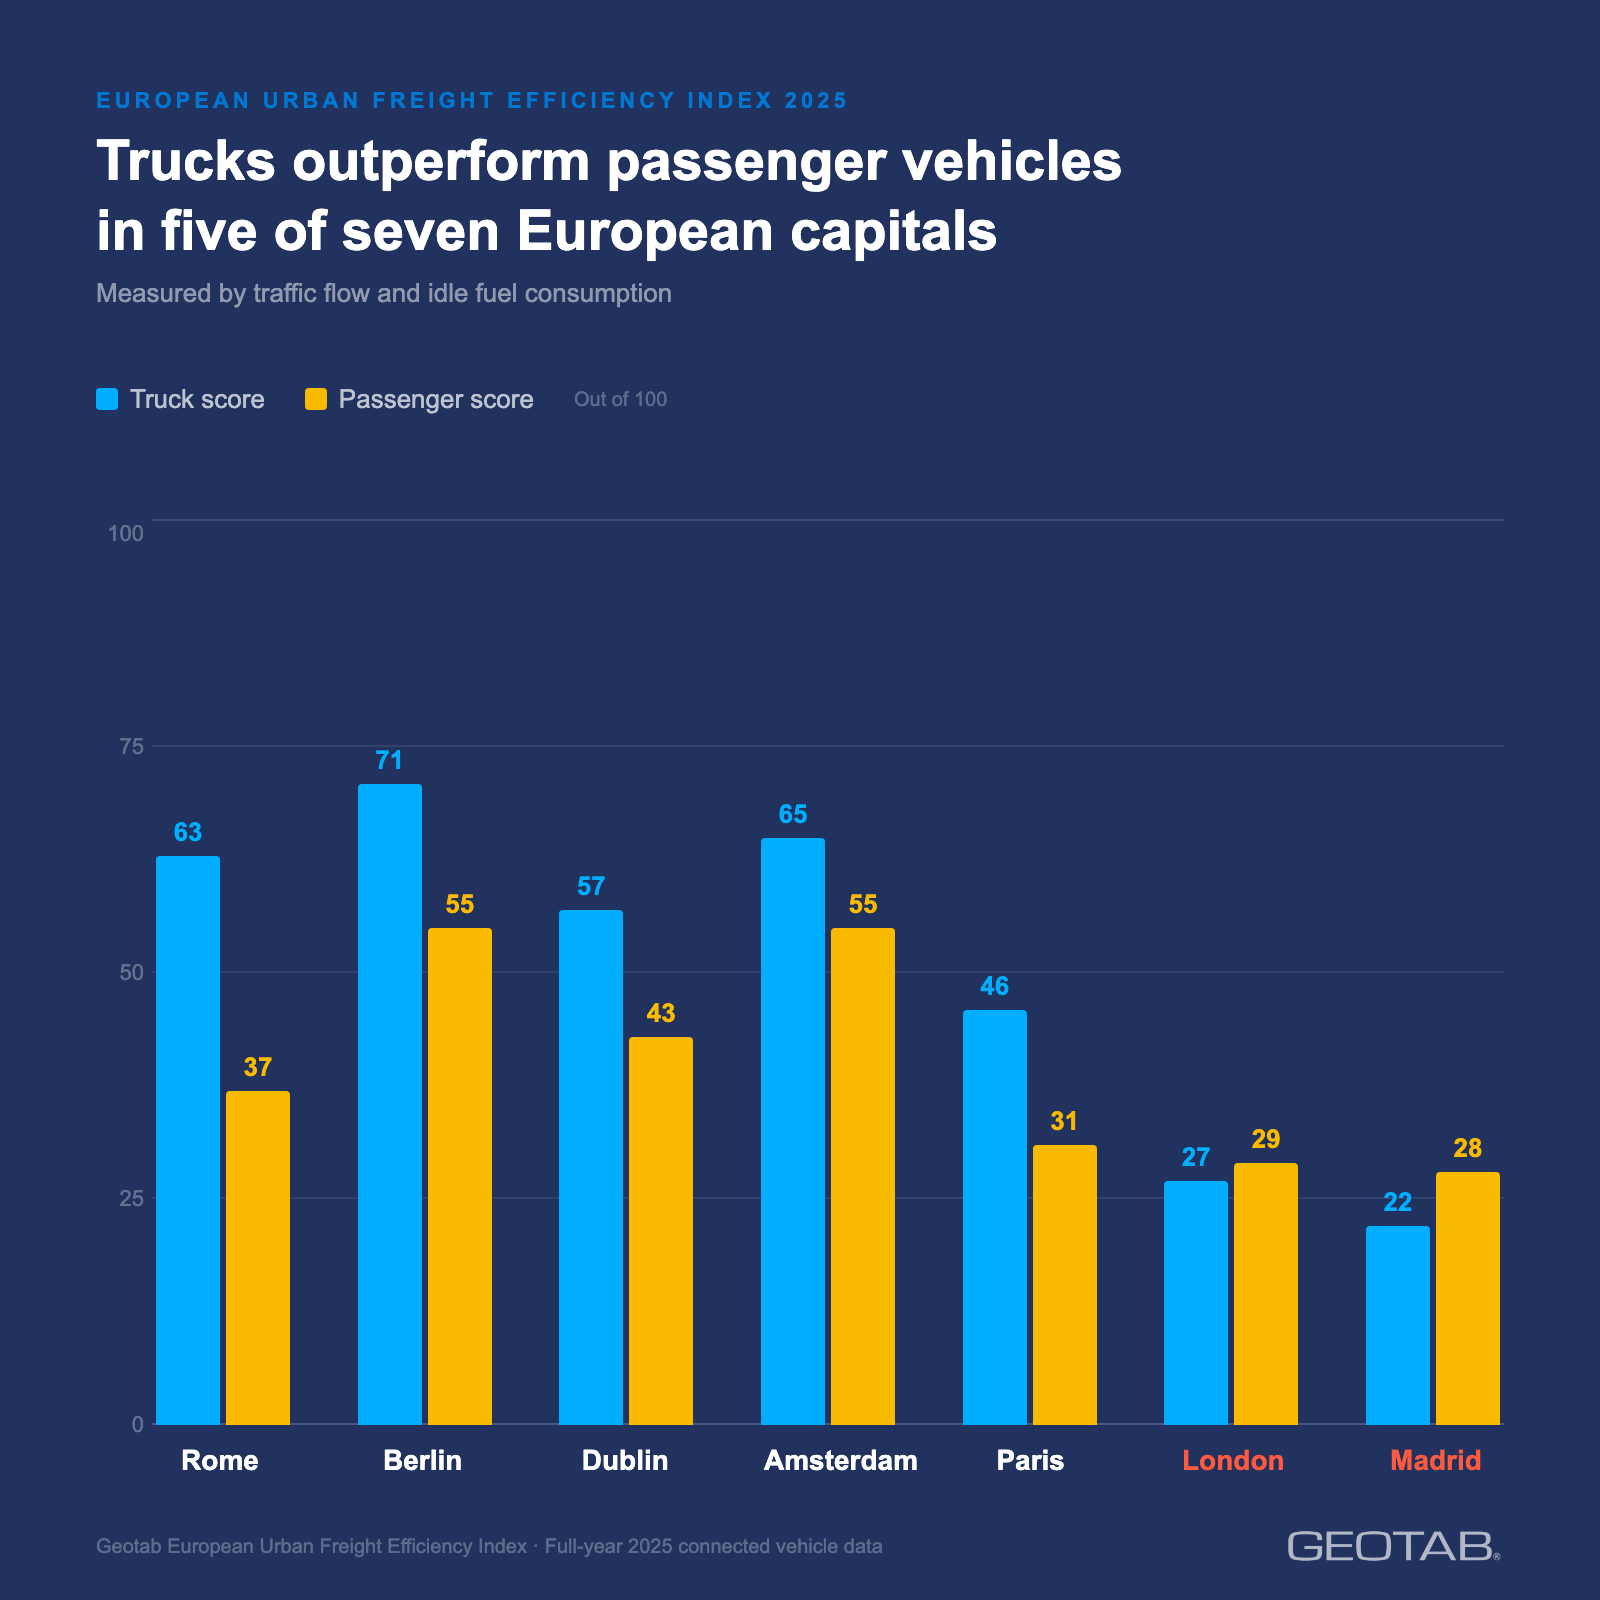
London, United Kingdom — September 8, 2026 — Geotab, a global leader in connected vehicle and asset management solutions, today published new findings from its European Urban Freight Efficiency Index showing that commercial vehicles outperformed passenger cars on road efficiency in five of the seven European cities analysed.
The Index scores each city's truck and passenger vehicle performance separately on a scale of 0 to 100, measuring how freely traffic moves and how much fuel is lost to idling. A higher score reflects a more efficient operational environment. The findings draw on full-year 2025 connected vehicle data across seven European cities. Where trucks outscore passenger vehicles, the data suggests this may partly reflect off-peak scheduling and professional routing that reduces exposure to the most congested conditions.
Across the seven cities, the truck-passenger gap ranges from +26 points in Rome to -6 in Madrid. Rome and Berlin show the largest truck advantages, reflecting freight access windows and distributed road networks that professional operations can exploit effectively. Dublin and Amsterdam follow, each with double-digit gaps in favour of trucks. Paris sits in a counterintuitive middle ground: trucks outperform passenger vehicles despite carrying the highest idle rate in the study, because cars face even worse conditions.
Only London and Madrid break the pattern — and for different reasons. London's results may reflect a regulatory environment that weighs particularly heavily on commercial vehicles: bus lane restrictions that trucks cannot use, loading regulations that concentrate deliveries into already-congested windows, and emission zone requirements whose compliance costs fall disproportionately on older commercial fleets. Madrid's challenge is more fundamental. Its truck readiness score of 8 is the lowest single measurement in the dataset, meaning the road network offers virtually no window of manageable conditions for commercial vehicles at any hour of the day.
London: the commercial vehicle exception
London is one of only two cities where passenger vehicles outperform trucks on overall efficiency, and the 2-point margin has real operational consequences. It's also the only city where truck fuel consumption is the highest of any city measured, at 36.75 litres per 100km. The data points to structural factors. Extensive bus lane restrictions may add journey time for commercial vehicles that can't use them. Narrow delivery streets in central areas, emission zone requirements, and complex loading regulations could be forcing deliveries into time windows that are already congested. Truck idle sits at 11.1% of total fuel consumed, lower than passenger vehicles at 13.6% but significantly worse than trucks in Rome, Madrid, or Dublin.
Rome: where the advantage is largest
Rome records the widest gap between truck and passenger vehicle efficiency of any city in the analysis: a truck score of 63 against a passenger score of 37. The data suggests commercial vehicles may benefit from designated freight windows and zones restricted to passenger cars, with professional routing potentially keeping them clear of the worst bottlenecks. Rome's trucks are also the most fuel-efficient of any city at 29.52 litres per 100km and idle at just 2.8% of total fuel consumed — the lowest truck idle rate in the dataset.
Berlin: reliable conditions, measurable returns
Berlin's truck advantage of 16 points (truck score 71, passenger score 55) is built on the widest boulevard infrastructure and the most distributed urban layout in the study. Its polycentric structure, with multiple centres rather than one single dominant hub, spreads demand more evenly across the network, preventing the extreme peak-hour concentration that overwhelms London and Madrid. For truck operators, this may translate into greater predictability: Berlin's truck journey time variability score reaches 95 out of 100, meaning operators can build reliable delivery schedules from historical data. Trucks idle at 8.5% of total fuel consumed, compared to 13.2% for passenger vehicles in the same city.
The professional fleet effect
The cities where that advantage breaks down are where the structural conditions imposed on commercial vehicles are so hostile that professional management alone can't fully compensate. For fleet operators, the data identifies both where the professional advantage is strongest and, just as usefully, where the fight is against infrastructure rather than operations, and where the case for regulatory change needs to be made with evidence.
Edward Kulperger, Senior Vice President, EMEA at Geotab said: "The assumption that trucks are always the primary source of urban road inefficiency doesn't hold up in this data. In most European cities, professional fleet operations outperform general passenger traffic by a significant margin; the product of structured routing, better scheduling, and data-driven decisions that private drivers simply don't have access to. For operators in every city, the message is the same: the clearer your picture of where the costs are falling, the better placed you are to do something about it."
Read the full report here.
Methodology
The European Urban Freight Efficiency Index scores each city on a scale of 0 to 100, based on two dimensions evaluated separately for passenger vehicles and trucks, then combined using a 60/40 weighting (passenger/truck) to reflect that most road demand comes from passenger vehicles while the truck component captures logistics efficiency specifically.
The first dimension, how traffic flows, accounts for 75% of each vehicle score and measures three things: congestion burden (cumulative congestion across the day, 50% weight), uncongested windows (hours per day of free-flowing traffic, 25% weight), and travel time variability (journey time predictability, 25% weight). The second dimension, what congestion costs, accounts for the remaining 25%, measuring mid-trip vehicle idling as a proxy for waste produced by the system. Higher idle ratios indicate congestion, poor signal timing and bottlenecks.
All scores are based on full-year 2025 data (January–December) from Geotab's connected vehicle platform across seven cities: Berlin, Amsterdam, Dublin, Rome, Paris, London and Madrid. Scores represent normalised, relative comparisons from a sample of connected vehicles, not a census.
Media Contact
pr@geotab.com
About Geotab
Geotab is a global leader in connected operations, video telematics and AI-powered insights. Trusted by more than 100,000 customers — from small and mid-size fleets to Fortune 500 enterprises and public-sector organisations, including the U.S. federal government, Geotab connects approximately 6 million vehicles and assets and processes 100 billion data points daily. With ISO/IEC 27001:2022, SOC2, FIPS 140-3 and FedRAMP authorisations, Geotab’s open platform and 700+ partner ecosystem unify safety, compliance and operations in a single system. Our mission: a safer, more efficient, and more sustainable world in motion. Learn more at www.geotab.com/uk and follow us on LinkedIn or visit our blog.
GEOTAB and GEOTAB MARKETPLACE are registered trademarks of Geotab Inc. in Canada, the United States and/or other countries.
Related News

Geotab launches Investigations and new safety capabilities to help fleets make every journey safer
September 14, 2026
3 minute read

Spain’s Summer Football Victory and Its Unexpected Impact on Traffic in Madrid
July 23, 2026
4 minute read
Europe's congestion is costing fleets millions in wasted fuel, new Geotab data reveals
July 14, 2026
3 minute read
Richfords achieves over 400% ROI from Geotab Vitality’s driver safety programme
July 8, 2026
2 minute read