Spain’s Summer Football Victory and Its Unexpected Impact on Traffic in Madrid
Geotab data shows traffic volumes fell up to 35% in Madrid during the tournament final, revealing unexpected urban mobility patterns.
July 23, 2026
•4 minute read
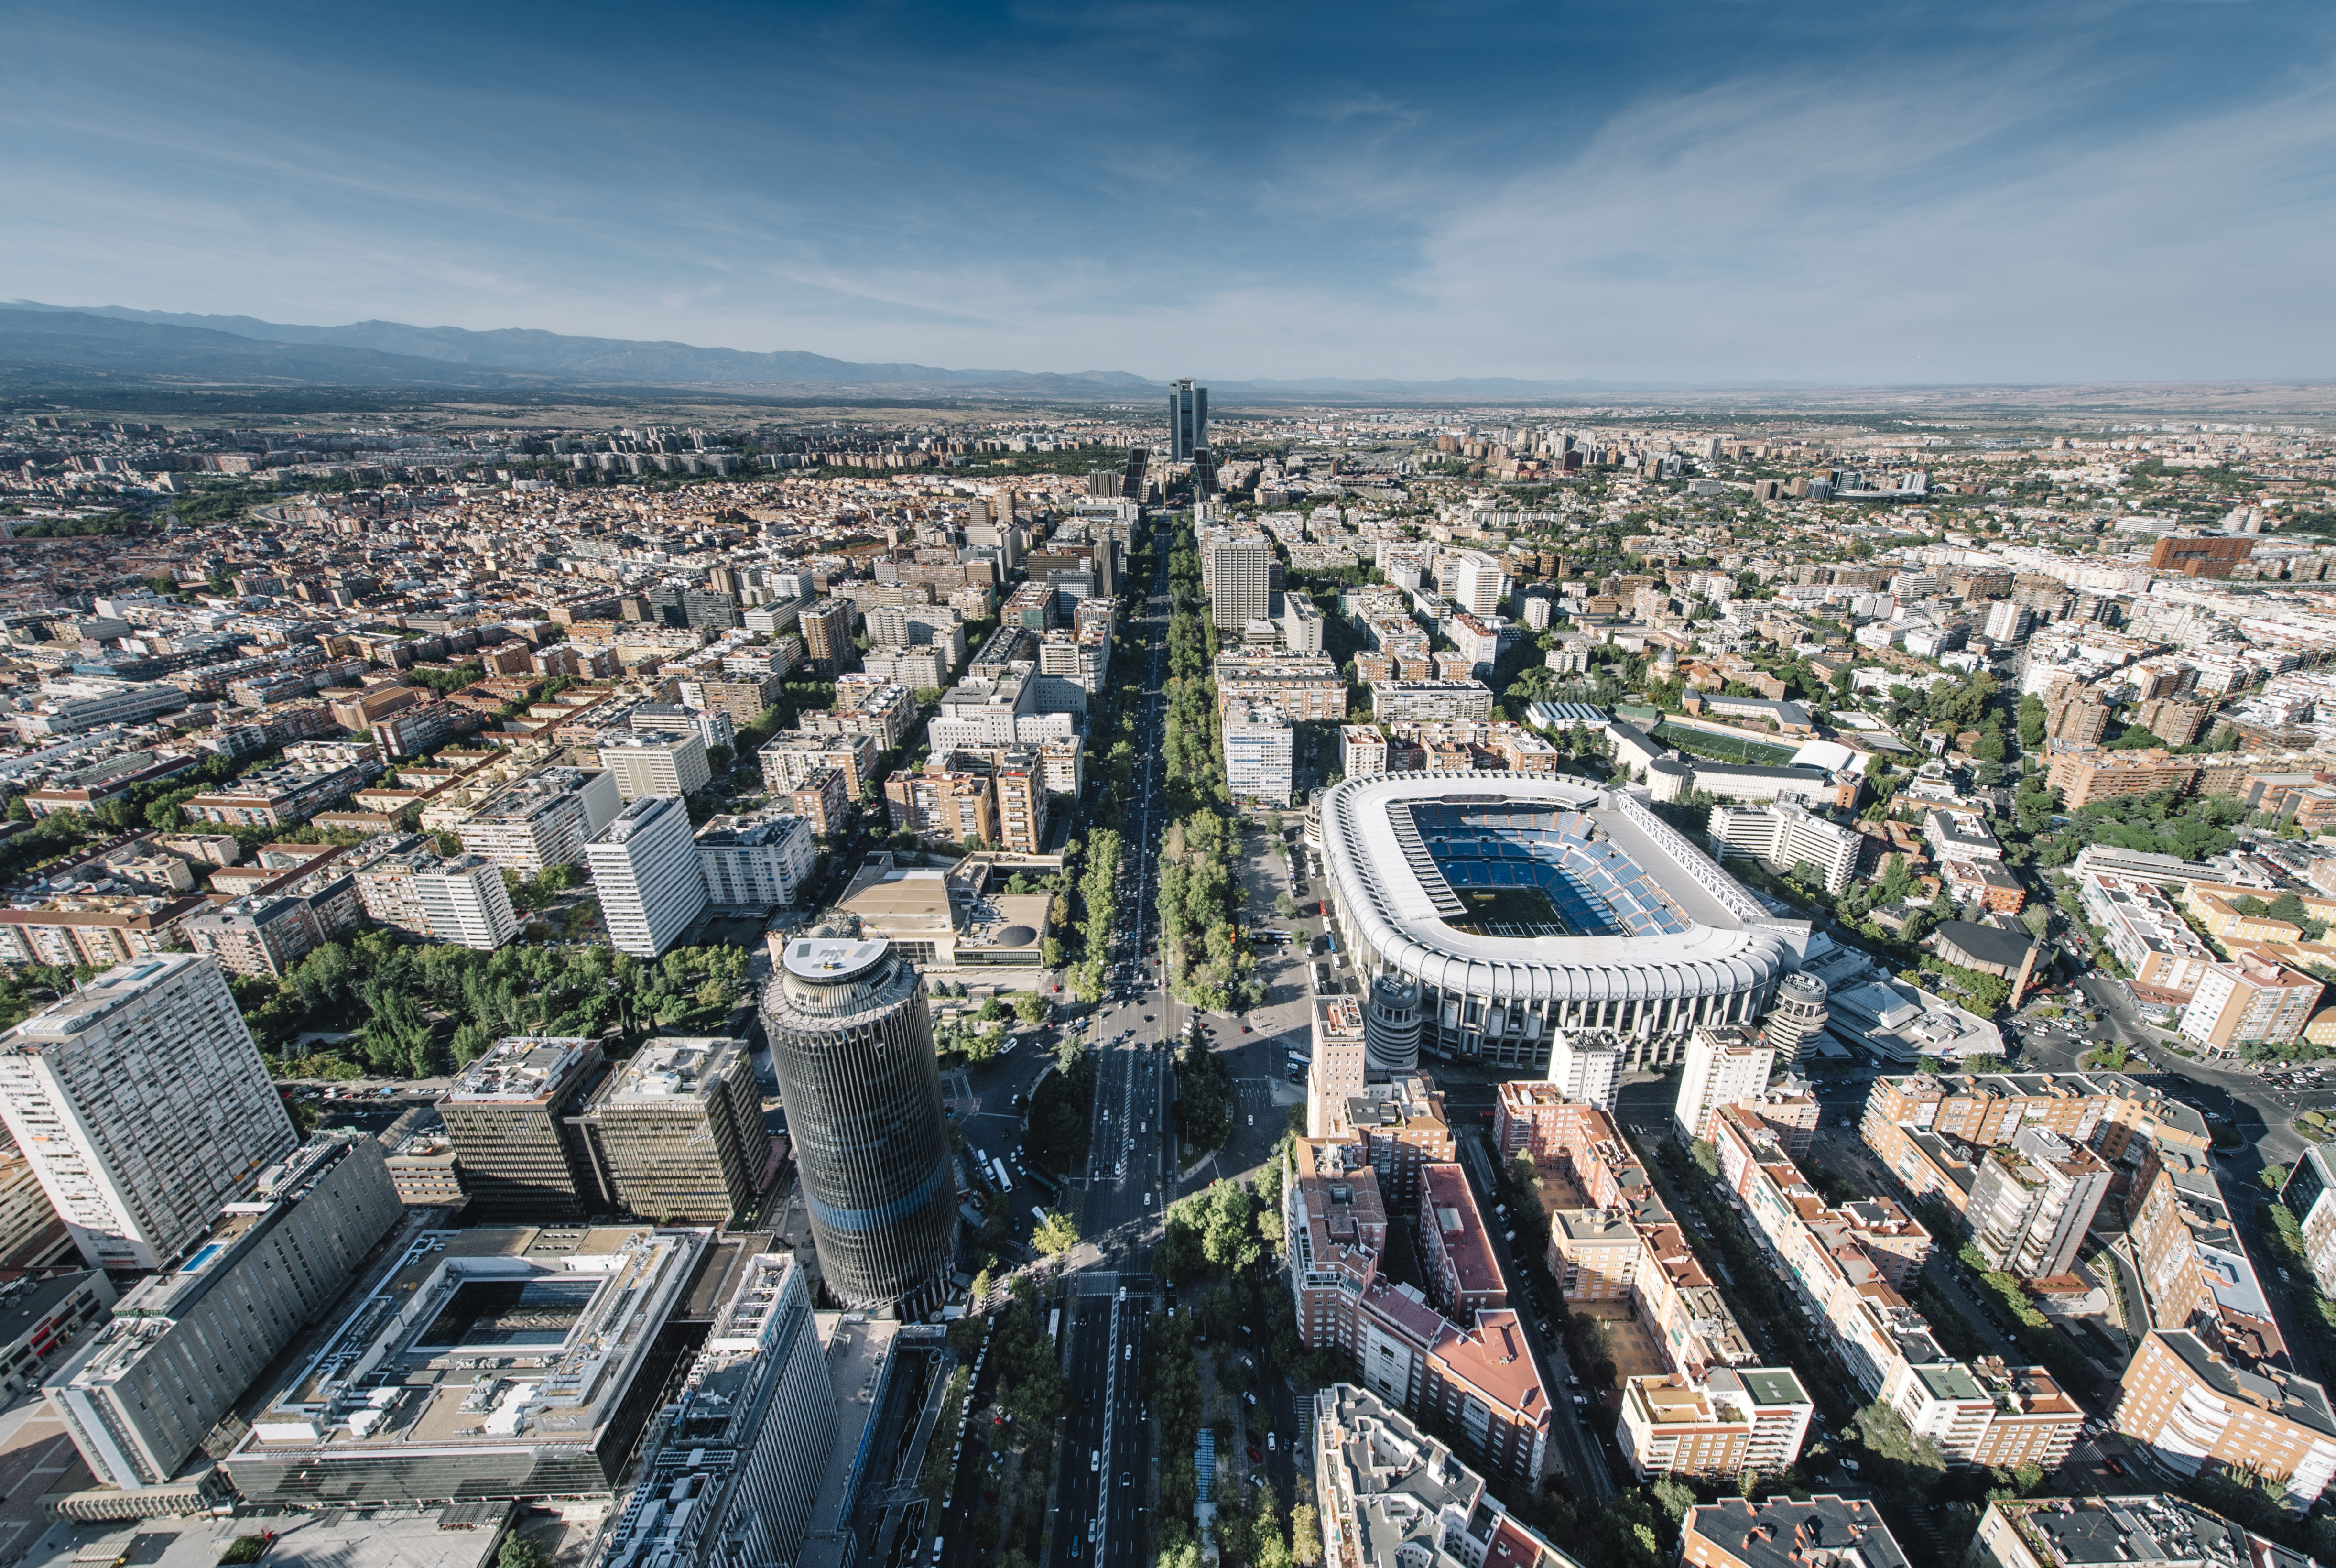
Geotab analysis shows traffic volumes fell by as much as 35% during the championship final, while Madrid recorded faster traffic speeds than on a typical Monday during the team's victory parade
Madrid, Spain - July 23, 2026 - Spain’s international football victory transformed mobility across Madrid for 48 hours. The final, spontaneous celebrations and the national team's victory parade all disrupted the city's usual traffic patterns. However, the impact varied significantly depending on the time of day and the area of the city.
Just when Madrid appeared destined for gridlock, something less intuitive happened: a significant share of the city's everyday traffic simply disappeared. The shift in normal travel behaviour allowed Madrid to absorb much of the impact of both the final and the official celebrations, with congestion largely confined to the corridors directly affected by the parade route.
An analysis by Geotab, a global leader in connected operations, video telematics and AI-powered insights, based on data from its connected vehicles operating across Madrid during the final match of the international football tournament (19 July) and the official celebrations (20 July), shows that urban mobility responded very differently depending on the stage of the event and the location across the city.
During the match: fewer trips and emptier streets
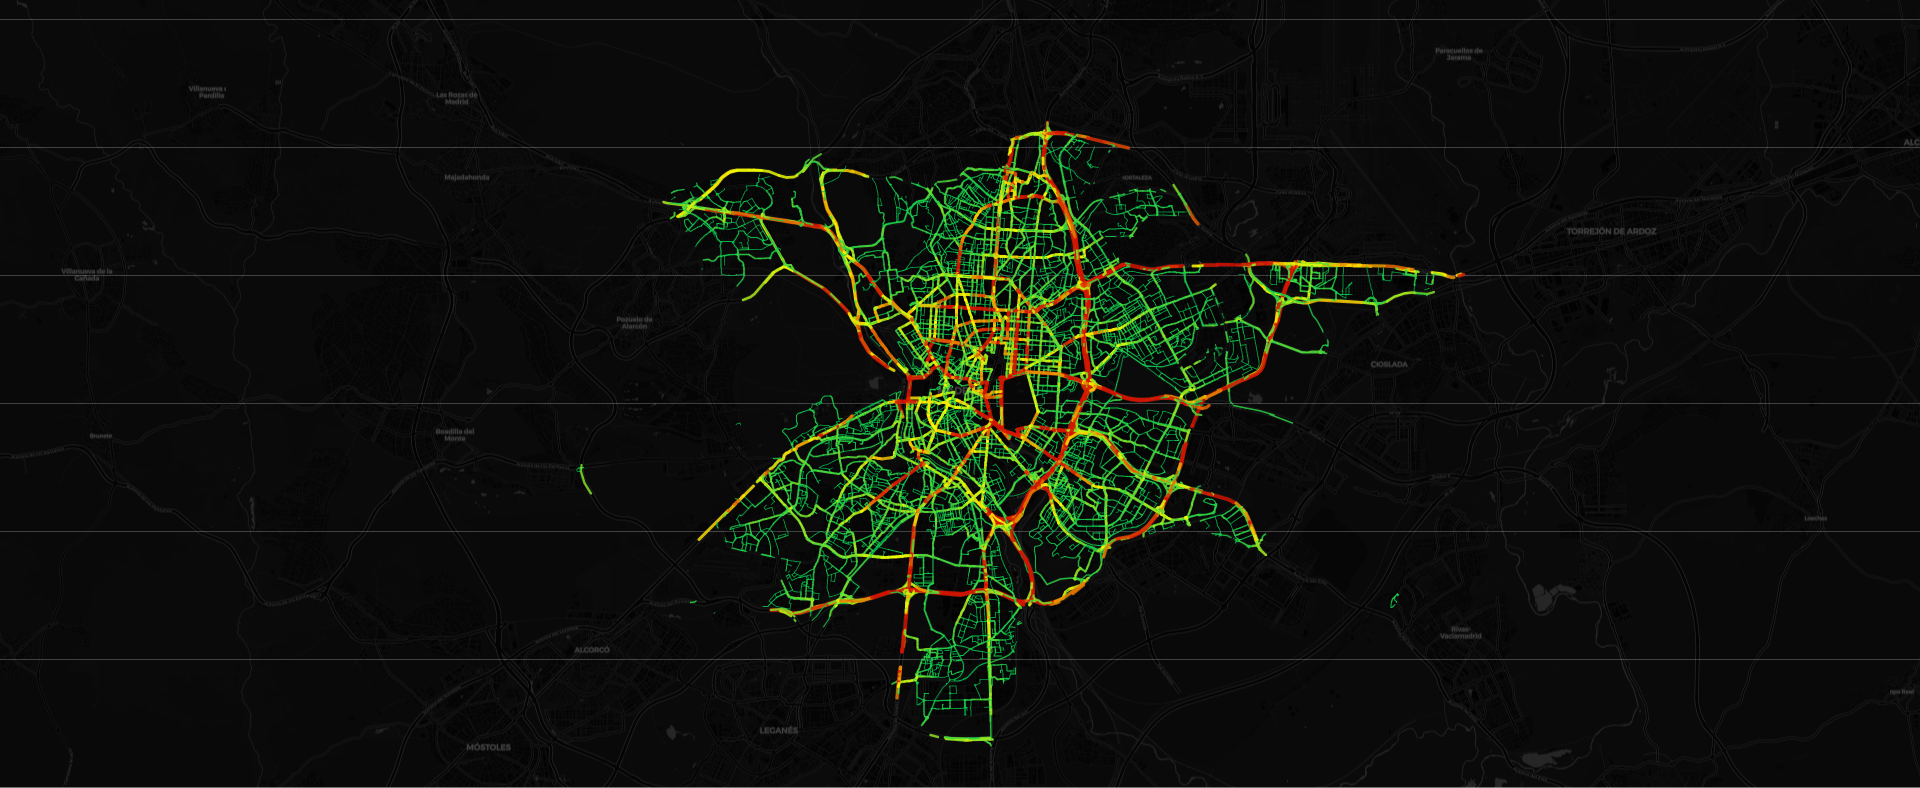
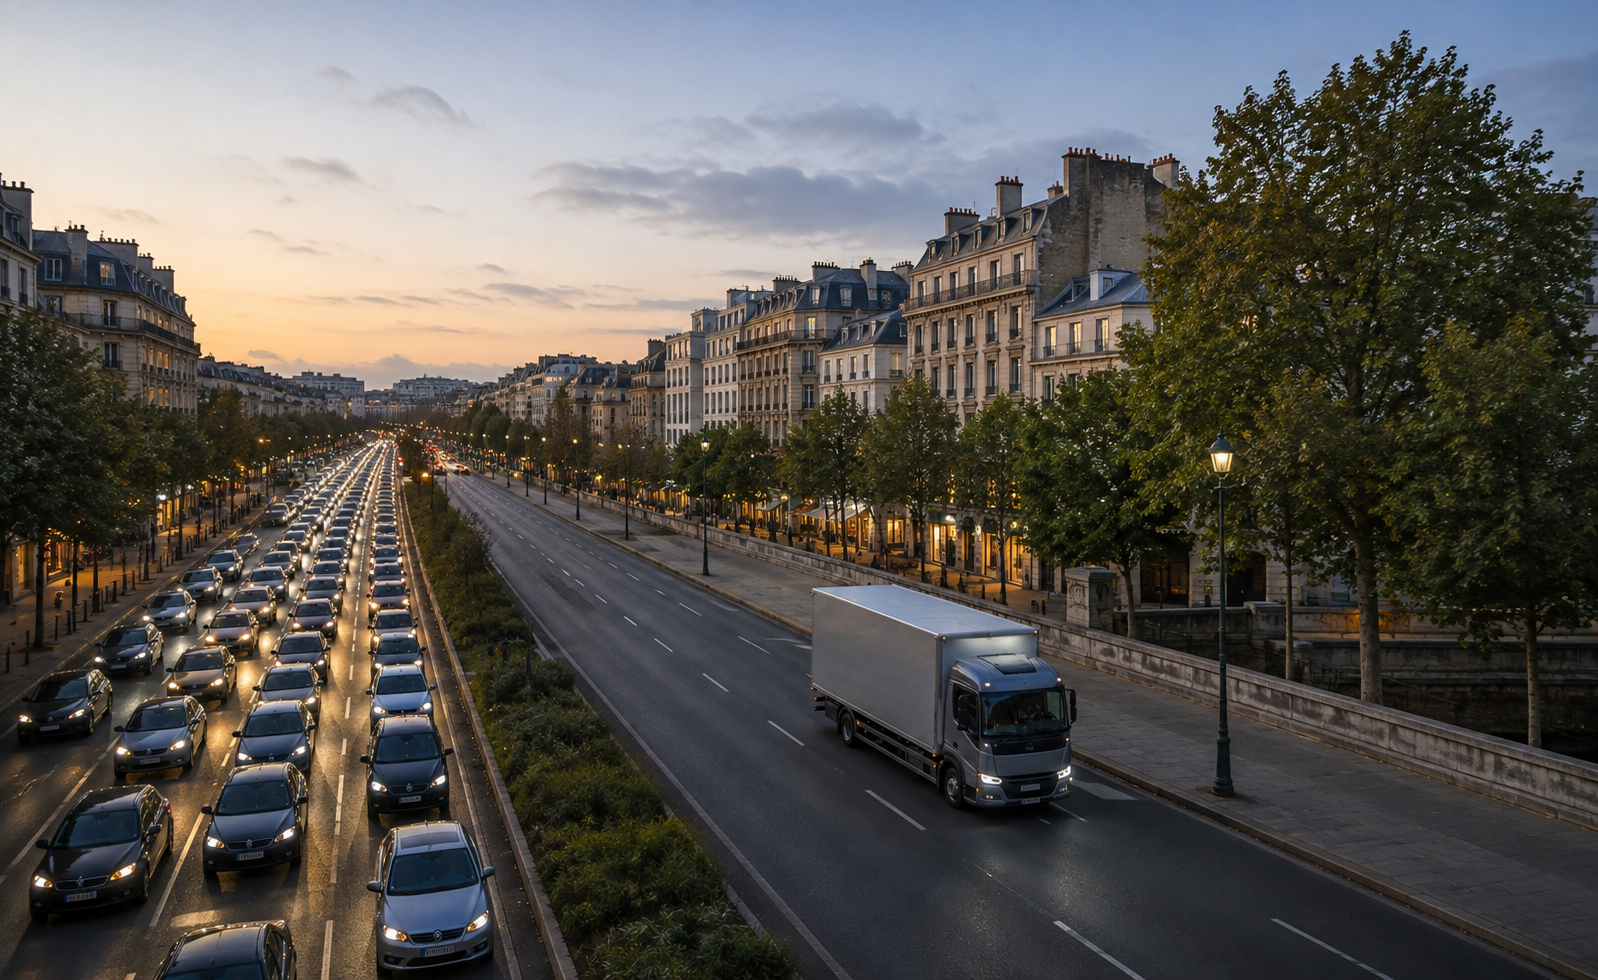
After: Trip volume across Madrid at 9 pm
(Sunday 19th July, during the final)
The first change became apparent during the final itself. On Sunday 19 July, the total number of trips was 5.8% lower than on Sunday 12 July, while average traffic speed fell by 6%, from 47.1 km/h to 44.3 km/h.
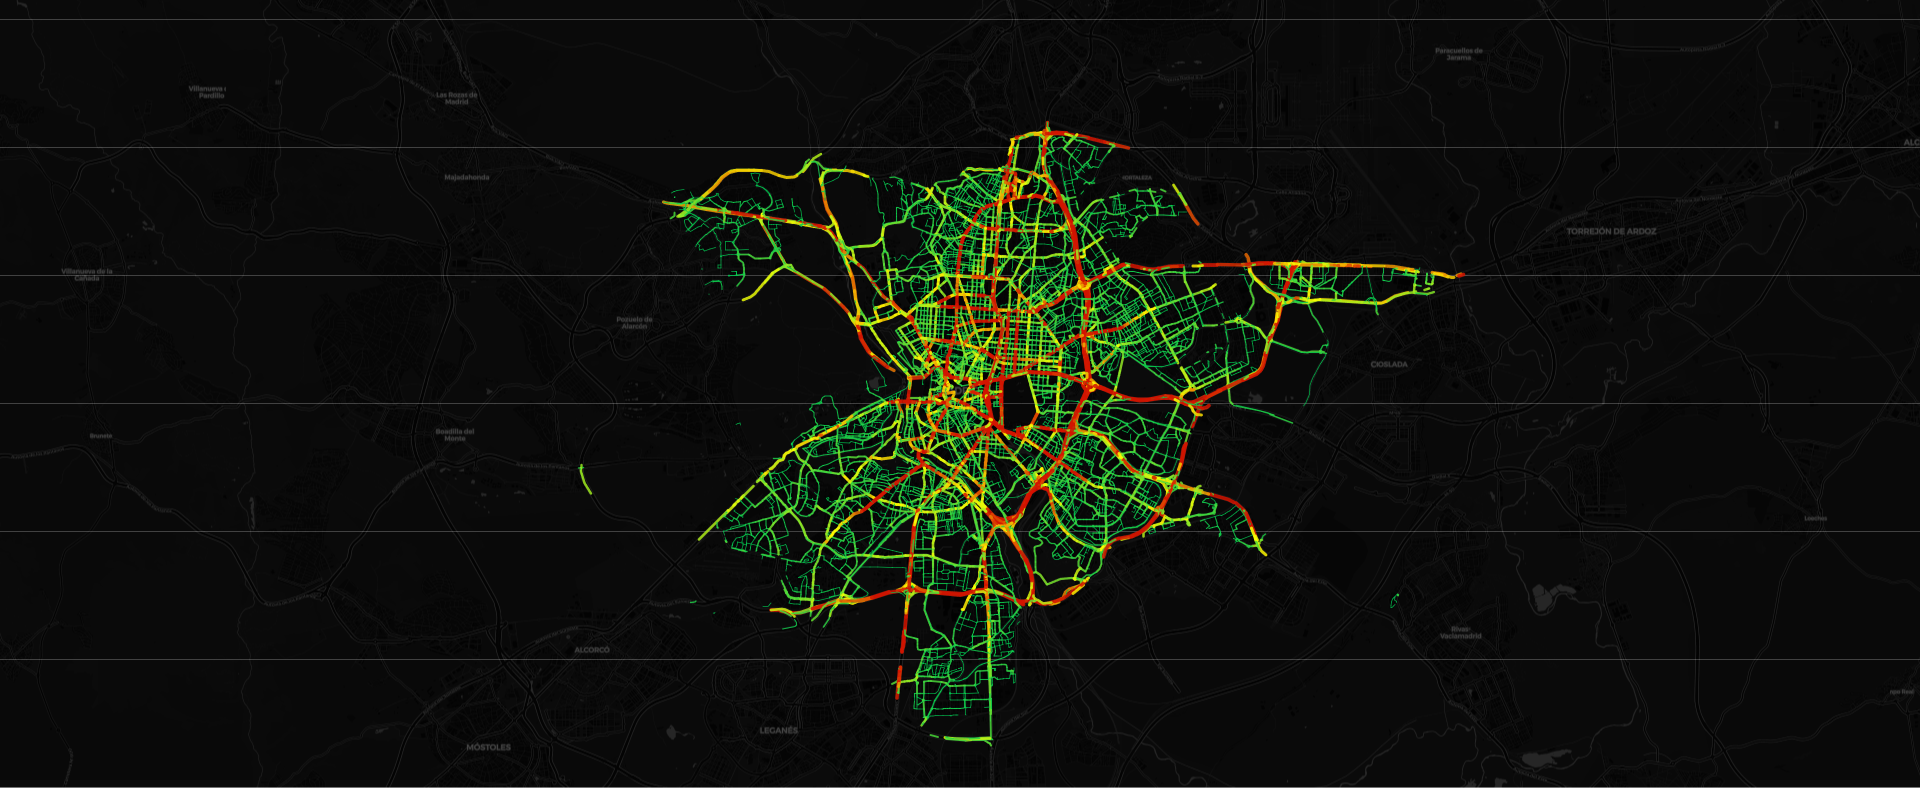
Before : Trip volume across Madrid at 9 pm
(Sunday 12th July, reference data)
However, during the match itself, between 9:00 pm and 11:00 pm, traffic behaviour changed significantly. Trip volumes dropped by between 32% and 35%, while average traffic speed increased by 14%, reflecting much quieter roads outside the areas where fans had gathered to watch the match.
The victory parade changed mobility... but not in the way many expected
On Monday 20 July, as the Spanish national team's victory parade made its way through central Madrid, another unusual traffic pattern emerged.
Although road closures directly affected several of the city's main arteries, between 12:00 pm and 6:00 pm average traffic speeds across Madrid were between 3% and 9% higher than on a typical Monday, compared with 13 July.
The analysis points to a clear demand displacement effect. The reduction in everyday traffic offset much of the disruption caused by road closures, allowing the city's road network to remain more fluid during the busiest hours of the official celebrations. However, this effect began to fade after 7:00 pm, as crowds dispersed and average traffic speeds fell by between 3.5% and 6.2% compared with the reference Monday.
"Major events do not always have the same impact on urban mobility that people perceive. The data shows that when everyday travel patterns change, cities can absorb a significant share of additional demand, even though certain areas experience very high traffic pressure. Access to near real-time data makes it possible to understand these dynamics with precision and can help both public authorities and businesses plan future operations much more effectively," said Iván Lequerica, Vice President, EMEA at Geotab.
One city, two very different realities
Although overall traffic conditions were better than expected, the situation differed significantly along the corridors directly affected by the victory parade.
The Jerónimos area, including Paseo del Prado and Plaza de Cibeles, experienced the greatest disruption in the analysis. Average traffic speed fell by 20% compared with the reference Monday, while trip volumes declined by 19.5%, reflecting the direct impact of road closures and large crowds.
In Goya, the main eastern access route to the parade, average traffic speed decreased by 10.8%, while trip volumes increased by 6.5%, indicating that many vehicles continued to use this corridor despite the restrictions, resulting in slower traffic flow.
Along Castellana (Colón–Recoletos), average speed fell by 8.5% across the day, while trip volumes remained broadly stable (-1.2%), suggesting that traffic continued to flow despite partial road closures.
By contrast, areas such as Cuatro Caminos experienced the opposite trend. Average traffic speed increased by 3.9%, while trip volumes fell by 10.1%, reflecting the broader reduction in travel demand across Madrid.
The hidden cost of the celebrations
Localised congestion also affected the energy efficiency of the connected internal combustion engine vehicles analysed by Geotab.
On the day of the celebrations, average fuel consumption rose to 5.22 litres per 100 kilometres, 59% higher than on the reference Monday (3.28 L/100 km). The daily increase was largely driven by congestion during the post-event dispersal period, despite faster traffic conditions across much of the city during the daytime. Aggregate CO₂ emissions increased by 49%, rising from 12.69 tonnes to 18.86 tonnes.
The greatest impact occurred in the hours following the celebrations. Between 12:00 am and 3:00 am, as people continued travelling home, the analysis recorded the worst traffic conditions of the period, with average speed dropping to 26.7 km/h at 1:00 am, 22.6% lower than on the reference Monday.
Telematics: understanding how cities really move
Beyond the immediate impact of the tournament celebrations, the analysis highlights the value of telematics in helping in understanding how cities respond to extraordinary events.
This type of analysis goes beyond public perception, providing a precise picture of where congestion actually occurs, when it develops, and how it can affect fuel consumption, emissions and overall traffic efficiency. These insights are becoming increasingly valuable for planning major events, improving urban mobility and helping both public authorities and commercial fleets operate more efficiently.
Methodology
The analysis is based on aggregated and anonymised data from vehicles connected to the Geotab network operating within the municipality of Madrid on 19 and 20 July 2026 (the final tournament match and the official victory parade), compared with the equivalent days of the previous week (12 and 13 July). Fuel consumption and emissions metrics relate exclusively to connected internal combustion engine vehicles.
Disclaimer:
Geotab is not an official sponsor of or affiliated with FIFA or the 2026 FIFA World Cup. This is an independent analysis based on Geotab's proprietary commercial vehicle data.
Media Contact
pr@geotab.com
About Geotab
Geotab is a global leader in connected operations, video telematics and AI-powered insights. Trusted by more than 100,000 customers — from small and mid-size fleets to Fortune 500 enterprises and public-sector organisations, including the U.S. federal government, Geotab connects approximately 6 million vehicles and assets and processes 100 billion data points daily. With ISO/IEC 27001:2022, SOC2, FIPS 140-3 and FedRAMP authorisations, Geotab’s open platform and 700+ partner ecosystem unify safety, compliance and operations in a single system. Our mission: a safer, more efficient, and more sustainable world in motion. Learn more at www.geotab.com/uk and follow us on LinkedIn or visit our blog.
GEOTAB and GEOTAB MARKETPLACE are registered trademarks of Geotab Inc. in Canada, the United States and/or other countries.
Related News

Geotab launches Investigations and new safety capabilities to help fleets make every journey safer
September 14, 2026
3 minute read
September 8, 2026
3 minute read
Europe's congestion is costing fleets millions in wasted fuel, new Geotab data reveals
July 14, 2026
3 minute read