Digging deeper into how temperature and speed impact EV range
Our interactive analysis showcases how an EV's maximum range can change depending on climate and driving behaviour.

Senior Manager, Fleet Electrification at Geotab
Feb 6, 2023
Updated: Aug 17, 2023
EV drivers know all too well that their vehicle's rated range is best used as a guideline. Their actual day-to-day range—how far one can realistically drive on a fully charged battery—can vary well below or above what was advertised. Just like internal combustion engine (ICE) cars, a vehicle's true operational efficiency is influenced by numerous factors including: road conditions, weather, topography, speed, tyre inflation and driving style.
An EV's maximum range is also directly linked to its battery capacity—how much energy (kWh) it can store—which degrades over time. You can read more about battery degradation in our study on EV battery health, which has shown an average of 2.3% degradation in storage capacity per year.
Knowing the exact range on a trip-by-trip basis has become less critical as battery capacity has increased with each new generation of EVs. Most light-duty EVs on the market provide more than enough range for most daily needs — including in fleet applications. For more on this, see our EV suitability analysis for passenger fleet vehicles in Europe.
That being said, understanding what causes range loss can increase confidence for EV drivers and fleet managers. It provides guidance on selecting the right vehicle for the job and conditions at hand.
Revisiting the impact of temperature on EV range
Temperature, particularly cold weather, is often referenced in range-drain discussions. As we showcased in our previous analysis, outdoor temperature can significantly impact an EV's range both positively and negatively. In optimal temperatures, the true range is on average 15% better than the rated range. On extremely cold days, the range can be reduced by as much as 50%. This is predominantly due to the energy required to keep the driver and batteries at a comfortable temperature. Fortunately, some measures can be taken to reduce this impact, such as pre-heating the cabin and taking advantage of heated seats rather than cranking the heater.
But is temperature the most significant factor that impacts range? Here we look to uncover the relative impact of temperature and a second key factor: speed.
Defining the role of speed and drag
Speed also affects vehicle efficiency, and consequently range. The impact of vehicle speed, or more specifically drag, applies to both ICE vehicles and EVs.
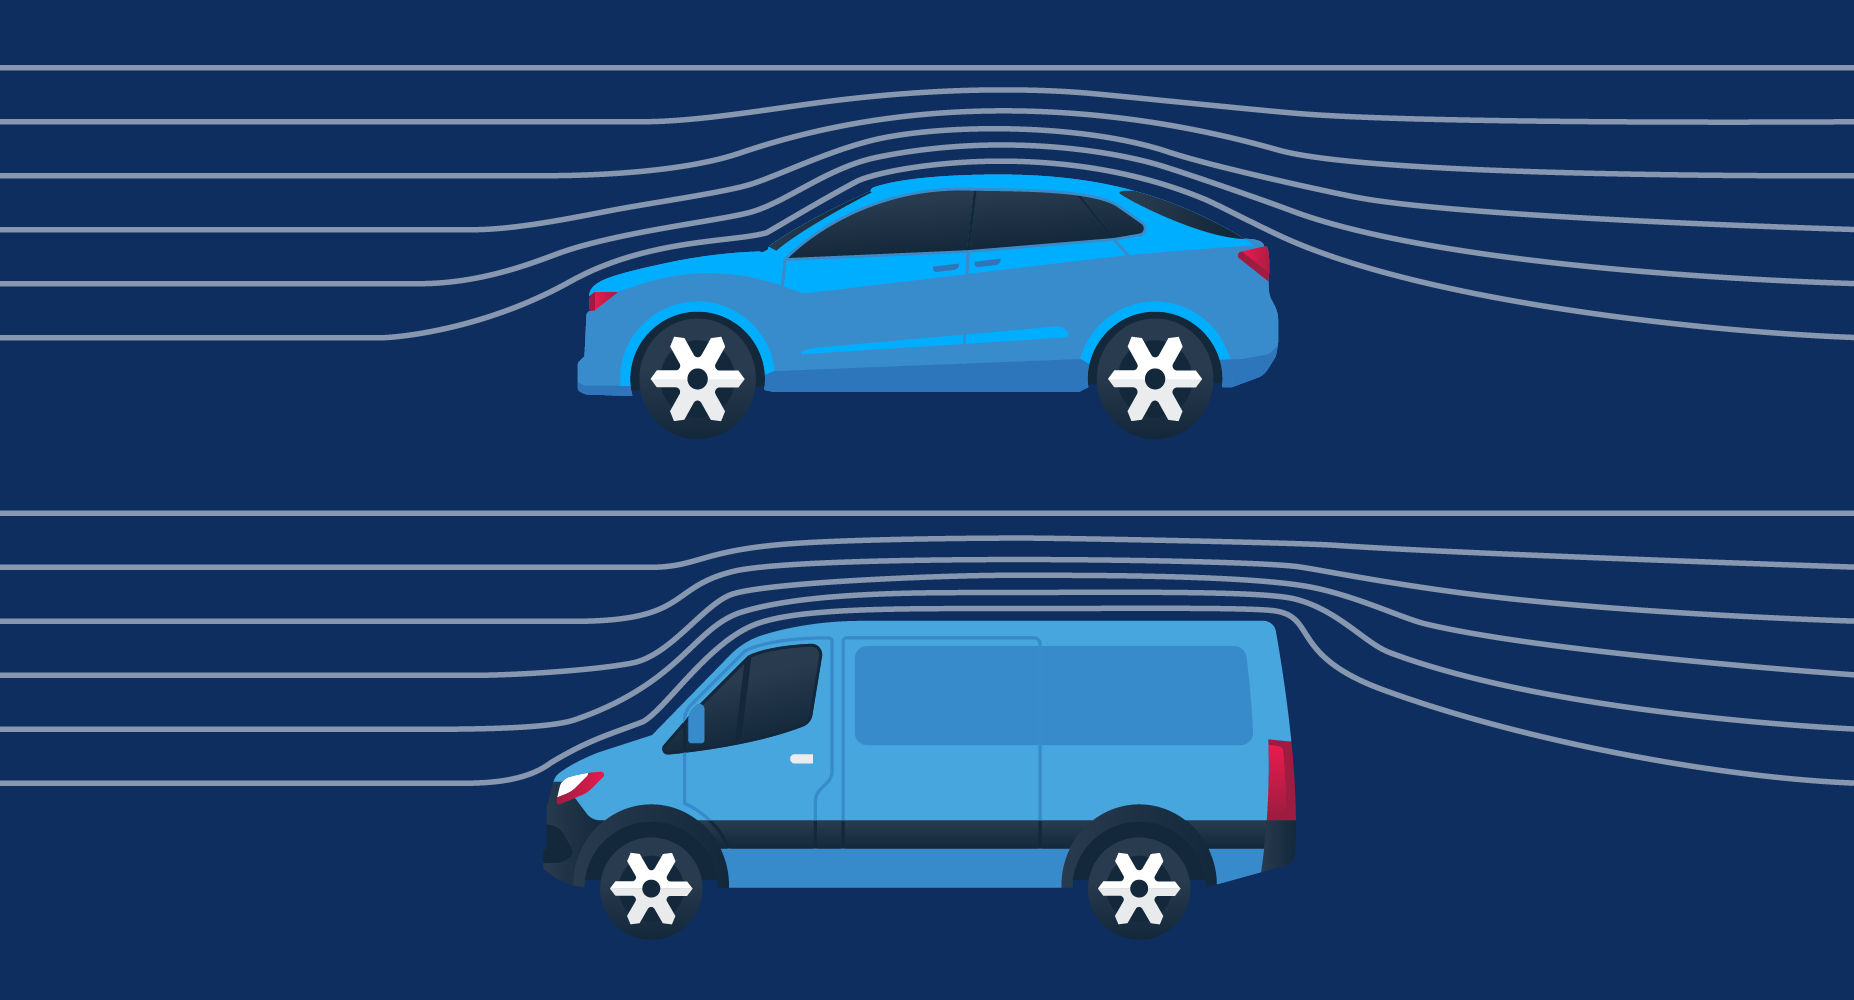
Drag is essentially the force that the vehicle needs to overcome in order to move through air. The amount of drag a vehicle encounters while travelling depends mostly on the aerodynamics of that vehicle, which is highly model-specific. The force of drag also changes with the speed of travel (in fact, drag increases proportionally to the square of the speed; if you double the speed, the drag goes up by a factor of four). Drag is additionally influenced by the density and characteristics of the air itself, which changes with wind speed, altitude, temperature and humidity (these factors are assumed to be constant in the following analysis).
Using aggregated telematics data to understand at what speed range is maximised
Using de-identified, aggregated trip data* at different temperatures and speeds, we generated efficiency models for a small car and a light van. The goal was to determine how speed impacts range and what happens to the speed efficiency curve at different temperatures.
*The car was modelled by analysing 350,000 trips from 500 cars, totalling over 180,000 hours of driving. The light van was modelled by analysing 2.8 million trips from 2000 vans, totalling over 370,000 hours of driving. Both models were adjusted to represent a 65 kWh battery. The simulation assumes constant speed.
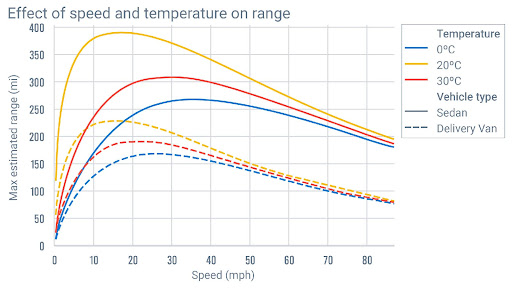
The chart above shows that the optimal temperature to maximise range is 20C for both the car (solid orange line) and the light van (dotted orange line). However, the ideal speed where range is maximised changes with the temperature. For example, at 20C the sedan's range is maximised at a sluggish speed of about 19 mph, whereas at 0C the optimal speed is doubled to 37 mph.
This is the result of a trade-off between the amount of energy required to overcome drag and the energy needed to keep the vehicle cabin at a comfortable temperature. Faster speeds will get you to your destination more quickly, meaning less total energy spent on HVAC, which is good for range. However, faster speeds also mean more energy is needed to overcome drag, which is bad for range.
Now let's compare this with the van. Because the force of drag is stronger on a van, efficiency peaks at even slower speeds. At an ideal 20C temperature, the most efficient speed is 16 mph. This is not much different from the car, and just as impractical for actual driving purposes. However, at freezing temperatures, the optimal speed is still quite slow, at approximately 25 mph.
Does speed or temperature play the more dominant role?
Notice how both groups of lines converge as speed increases. For both the car (solid lines) and the light van (dotted lines), the relative role of temperature becomes much less significant the faster they go. At low speeds, a 5 to 6C change in temperature will have a much larger impact on range than any change in temperature at high speeds. In the case of the light van, the impact that temperature has at high speeds becomes almost insignificant. Remember, the force of drag is proportional to the square of speed; meaning it has a much greater influence the faster you drive.
Visualise the impact yourself
Geotab has used the findings of this analysis to create an interactive simulation to compare a representative car and light van, both with a 65 kWh battery. Adjust the temperature and speed to see the impact to range for yourself.
*A full bar (100%) is the vehicle's maximum theoretical range based on meeting the optimal conditions for both temperature and speed. This is not the same as a vehicle's rated range.
Consider the following scenario
Imagine it's a mild day, about 21C, and you have two options: take the motorway and drive at 70 mph, or take city roads and drive at 30 mph. If maximising range is your number one priority, then regardless of whether you're driving a car or a van, you're best to take the slower route.
Try it yourself: slide the temperature bar to 21C. Now slide the speed bar from 30 mph to 70 mph.
Let's say you want to take the same route in the winter and it's 0C. Your range would already be less than it would be in the spring, given that you're now drawing energy to warm yourself as well as the vehicle's batteries. Are you still better off taking the slower route?
Try it yourself: slide the temperature bar to 0C. Now slide the speed bar from 70 mph to 30 mph.
In the case of the car, there isn't a significant difference range-wise between the motorway and city roads. You're only using about 12% more energy by taking the motorway, but you'll get there more than twice as fast. However, in the light van, your loss is 28% in range by choosing the motorway route versus the city streets. When it comes to the light van, speed still plays a significant role.
So which has the biggest effect on range — temperature or speed?
You've probably surmised, there isn't a single answer to this question.
Generally speaking, speed becomes more dominant at higher speeds, and sticking to the speed limit en-route is the best way to conserve range. If you're driving a light van or a similarly larger vehicle, you shouldn't notice much seasonal difference in your vehicle's range, particularly if your routes are mostly motorway driving.
If you're in a smaller, more aerodynamic car, temperature has a more prominent impact on range, particularly on city-speed roads. As a result, using strategies to reduce that impact, as outlined here, will be more important.
The reality is that for most fleet applications, today's EVs can complete their trips on a single charge regardless of speed or temperature. For the longer routes, having an understanding of seasonal temperatures and road speeds can provide guidance on trip planning, and whether a charging stop should be part of the itinerary.
Looking for more information about EVs? Check out our Operate Electric Webpage to request a demo today!
Subscribe to the Geotab Blog

Senior Manager, Fleet Electrification at Geotab
Charlotte Argue joined Geotab in 2019 and is a thought leader on electric vehicles (EVs), working on accelerating EV uptake since 2009.
Table of contents
- Revisiting the impact of temperature on EV range
- Defining the role of speed and drag
- Using aggregated telematics data to understand at what speed range is maximised
- Does speed or temperature play the more dominant role?
- Visualise the impact yourself
- Consider the following scenario
- So which has the biggest effect on range — temperature or speed?
Subscribe to the Geotab Blog
Related posts

Geotab’s new fleet Sustainability Center simplifies fuel and emissions reduction
June 13, 2025
3 minute read
.jpg)
Lead with Trust: How Geotab Helps Businesses Navigate CSRD Compliance
March 19, 2025
2 minute read
2030 or 2035, the UK Needs Meaningful Action on EVs Now
September 6, 2024
2 minute read
Driving smarter: Insights from Geotab’s “Taking Charge” Report
August 8, 2024
2 minute read

The art of the possible: Insights from Geotab’s “Taking Charge” Report
June 20, 2024
3 minute read

