What can big data tell us about driver safety in the UK during COVID-19?
The challenge is that real world data collection methods employed today are antiquated and often reflect what happened many months ago. So how does one measure the impact of a disruptive and fast-moving phenomena such as COVID-19?

By Aaron Jarvis
Associate Vice President, Sales and Business Development, UK & Ireland
Aug 27, 2024

At Geotab, we believe in actionable insights, while we analyse and collect 40 billion data points a day to serve our customers, we believe this is not sufficient, we are taking a practical approach towards turning these data points into actionable insights that impact policy making, which in turn leads to real-world impacts such as cost savings, OPEX reduction, CAPEX optimisation and much more.
In our case, we turn our attention to one real-time lead indicator that could have a tremendous impact: commercial vehicle traffic behavior on our roads. This blog posting is a continuation of our previous blog postings analysing the impact of COVID-19 on commercial traffic. In this case we turn our attention to safety in the UK.
When we think of driver safety, we typically focus on the following datasets: harsh acceleration, braking and cornering in addition to seatbelt usage during trips. Read on to see the analysis of these safety metrics in the UK, how they have evolved with COVID-19 and the impact of actionable and precise government policy instruments.
Traffic insights at a glance
Using the power of a thousand commercial vehicles in the UK, we were able to construct the following maps from January to September of this year.

Trip density by segment 2020: Trip density of the UK from January to September 2020. Segments and areas coloured in red denote the highest density of segment traversals. From this map, we see our data reflects the highest trip density in London, along with motorways across the UK. This animated map looks at segment traversals specific to the cohort of vehicles that were on the road since January 2020.
A change in harsh driving
Although we saw a decrease in harsh braking events from February to April, the harsh events are on an uptick from August and onward.
.svg)
Trips with harsh driving: Proportion of trips with harsh events for select months in 2020. Since the COVID-19 crisis, we see the harsh event rates for all three types of harsh events have been on the rise. This time series view looks at change in behaviour specific to the cohort of vehicles that we’ve seen since February 2020 (Pre-COVID-19).
Wearing our seatbelts keeps us safe and reduces the risk of death in crashes. We need to actively promote and enforce safe driving behaviours to make our roads safer for all users.
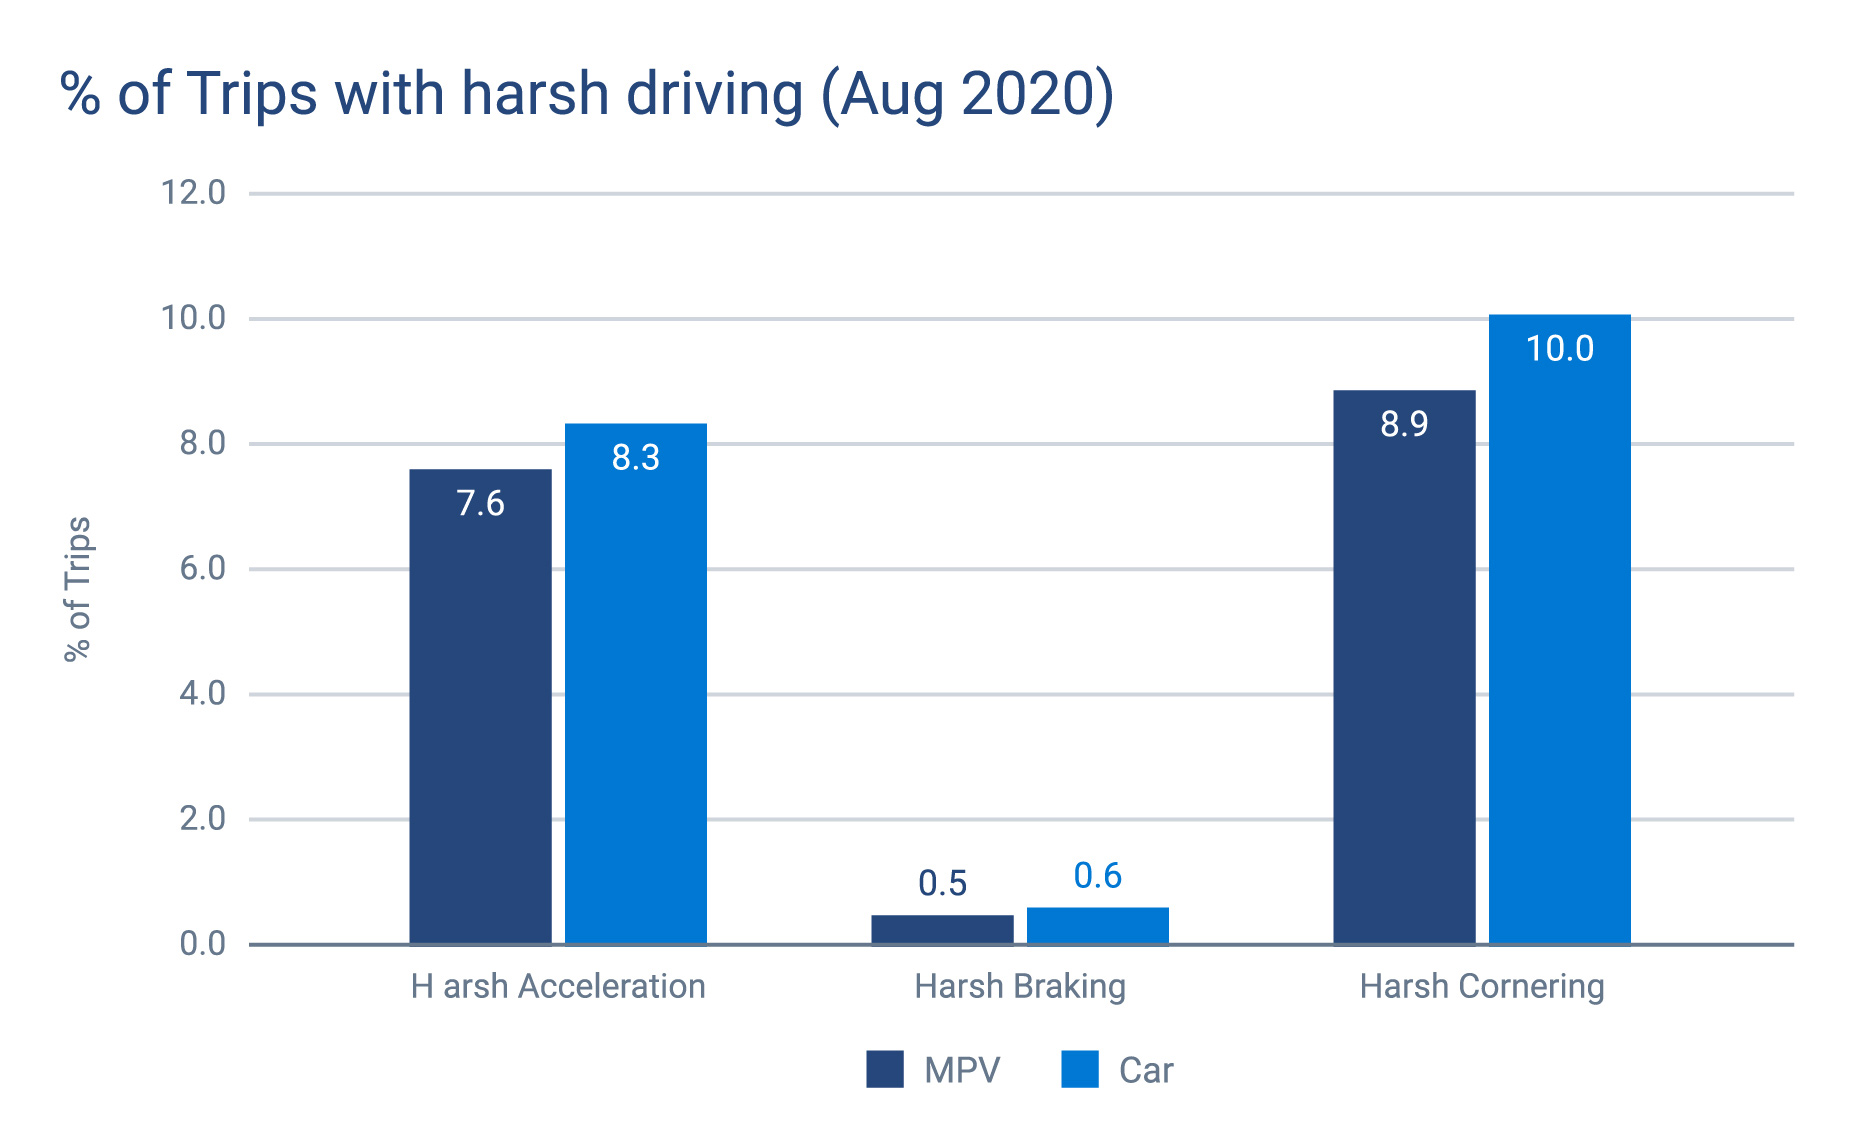
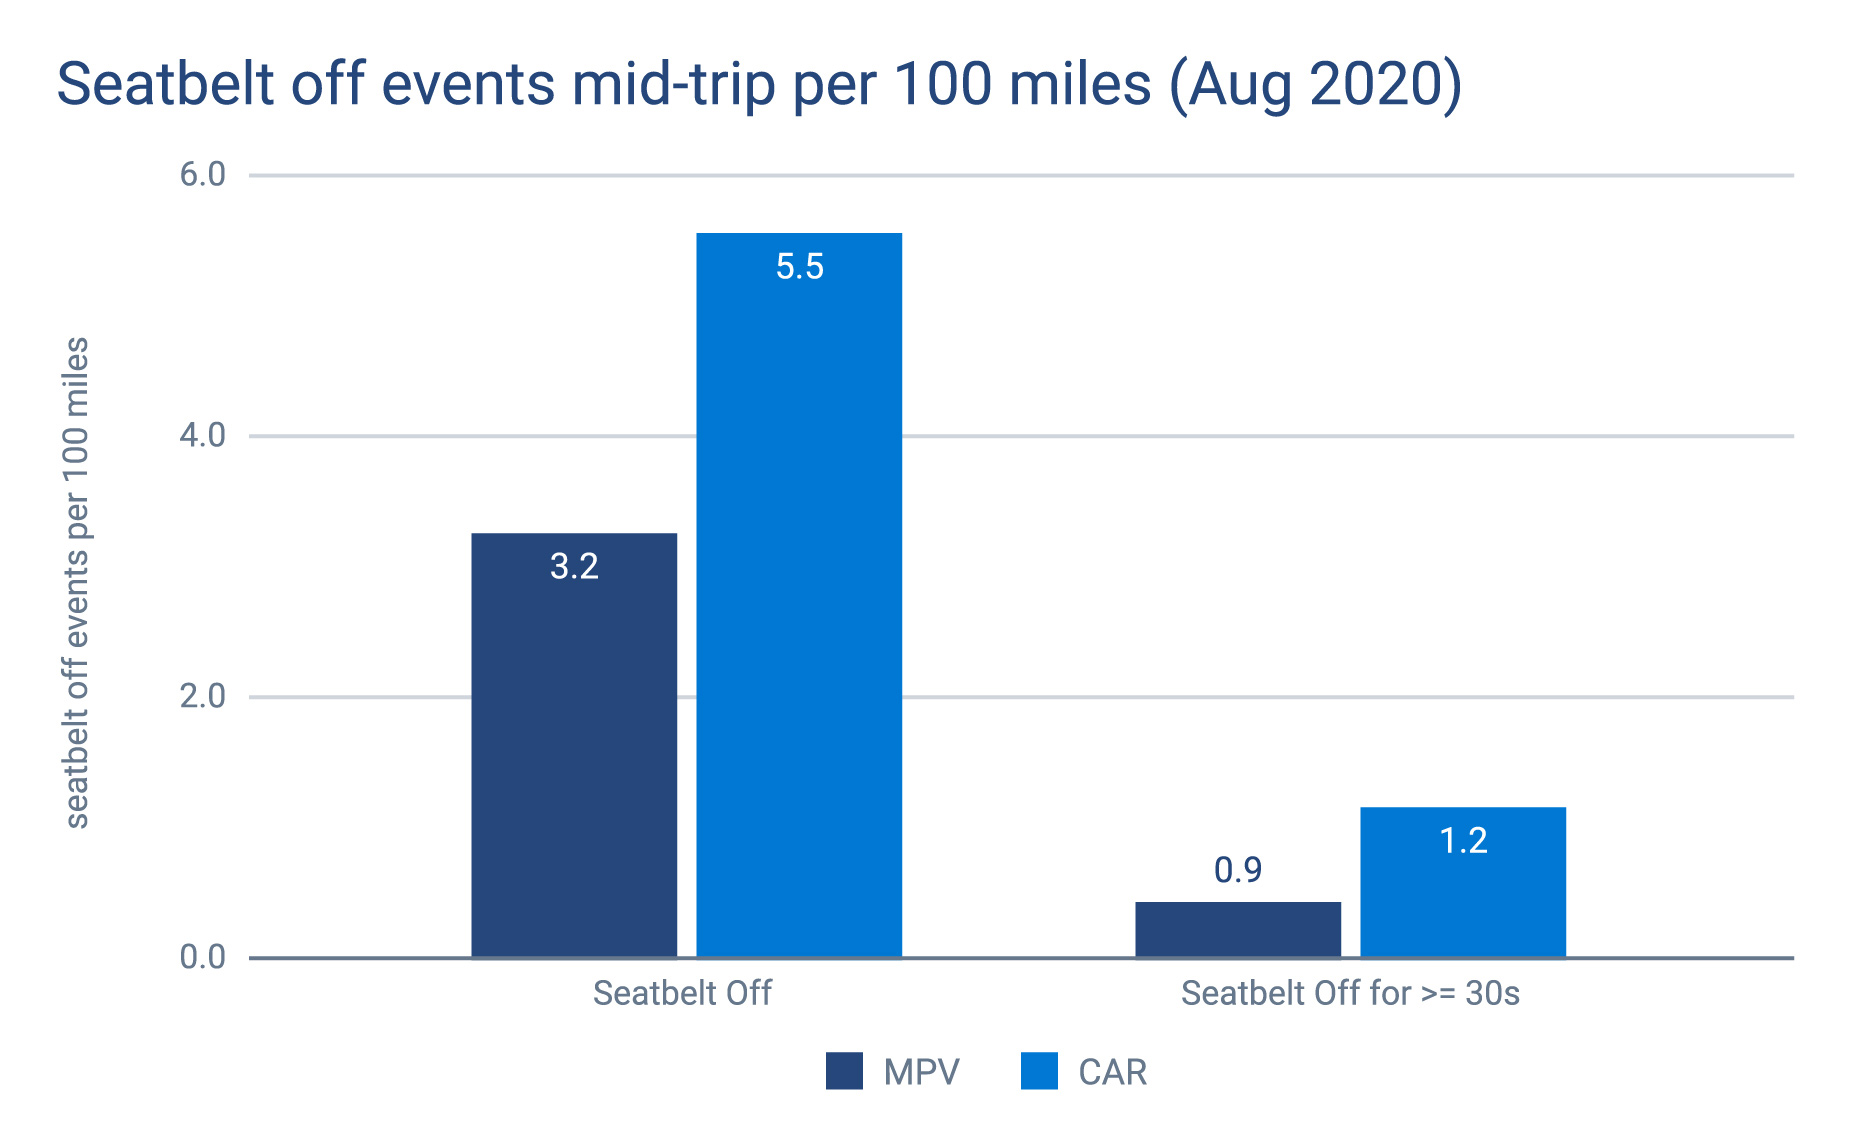
Multi-purpose vehicles (MPV) exhibit a slightly lower % of trips with harsh driving behaviour compared to passenger (car) vehicles. In addition, MPVs also have a lower seat belt off events mid-trip event rate per 100 miles compared to passenger (car) vehicles.
* MPV includes a range of vehicles, including CUVs (e.g. Honda CR-V), SUVs (e.g. Toyota RAV4), and larger vans (e.g. Mercedes-Benz Sprinter)
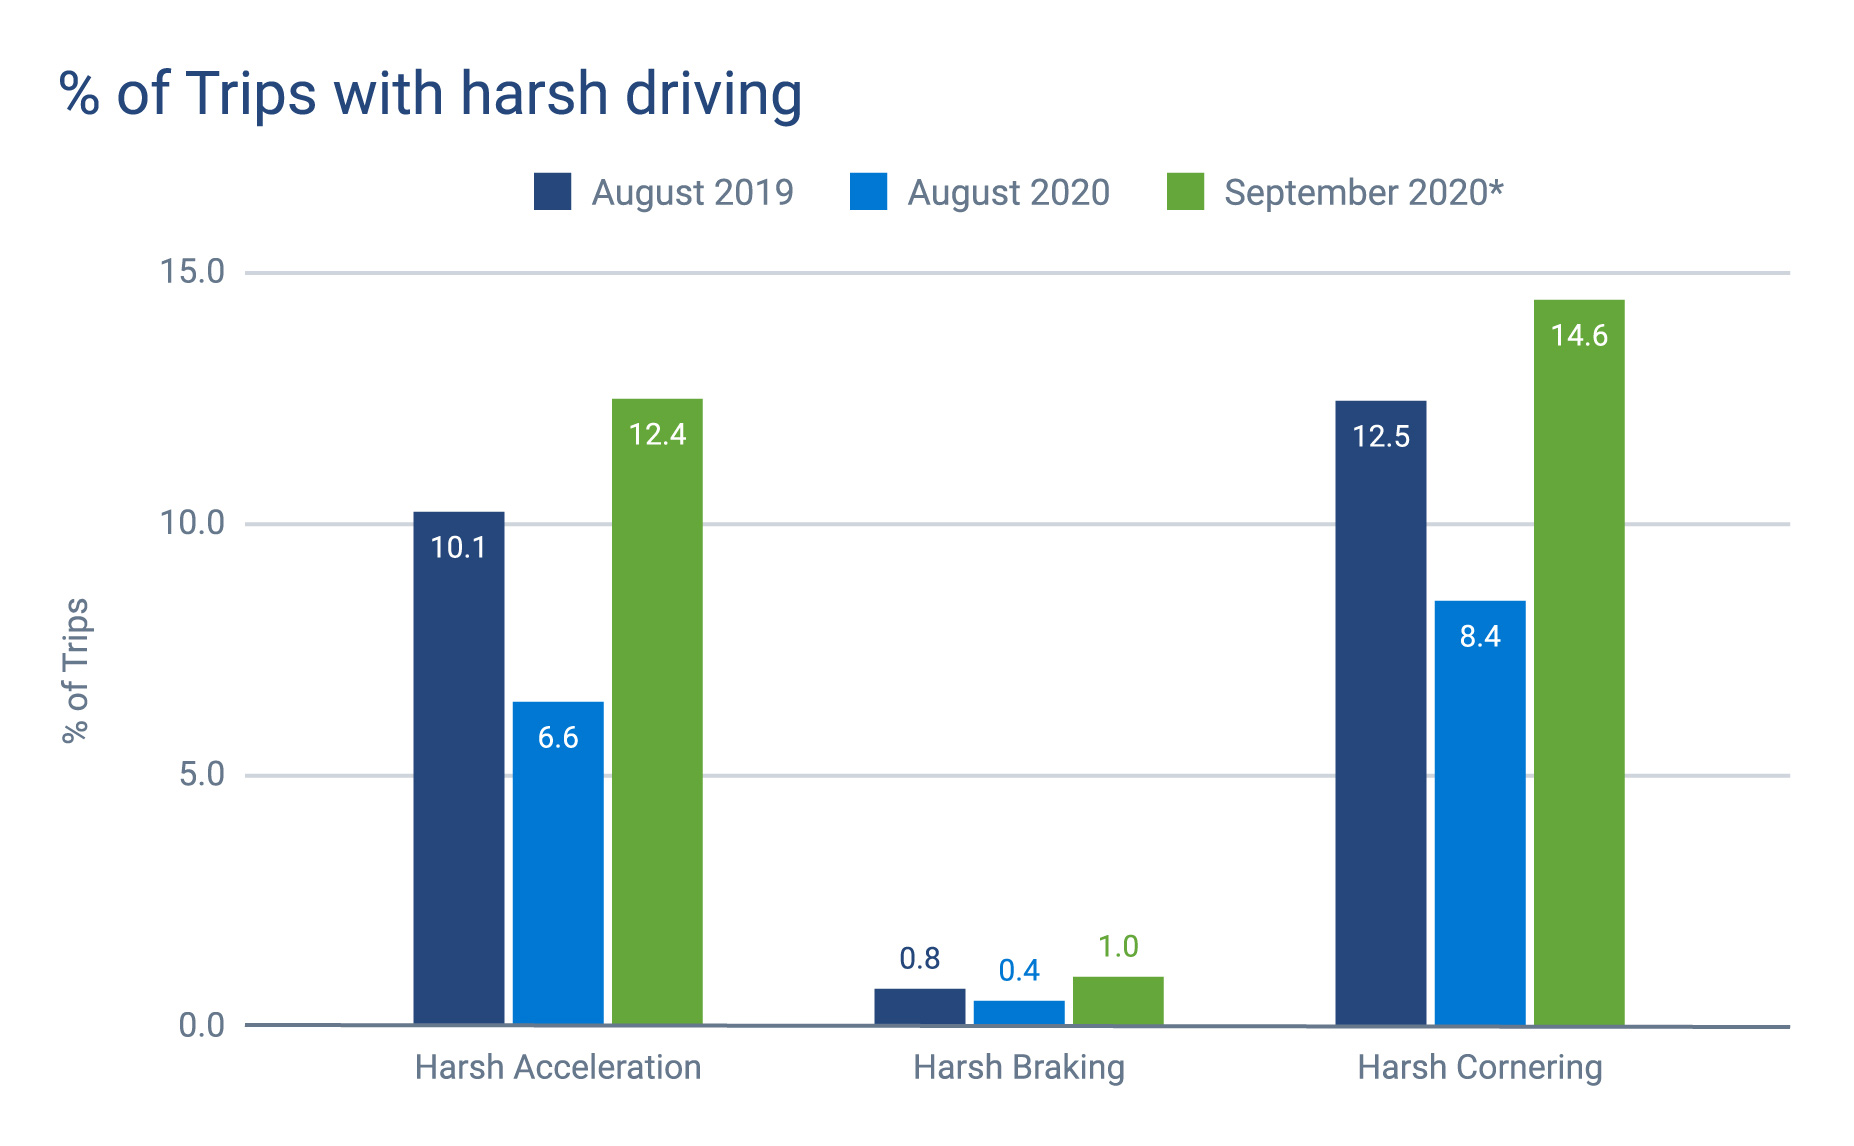
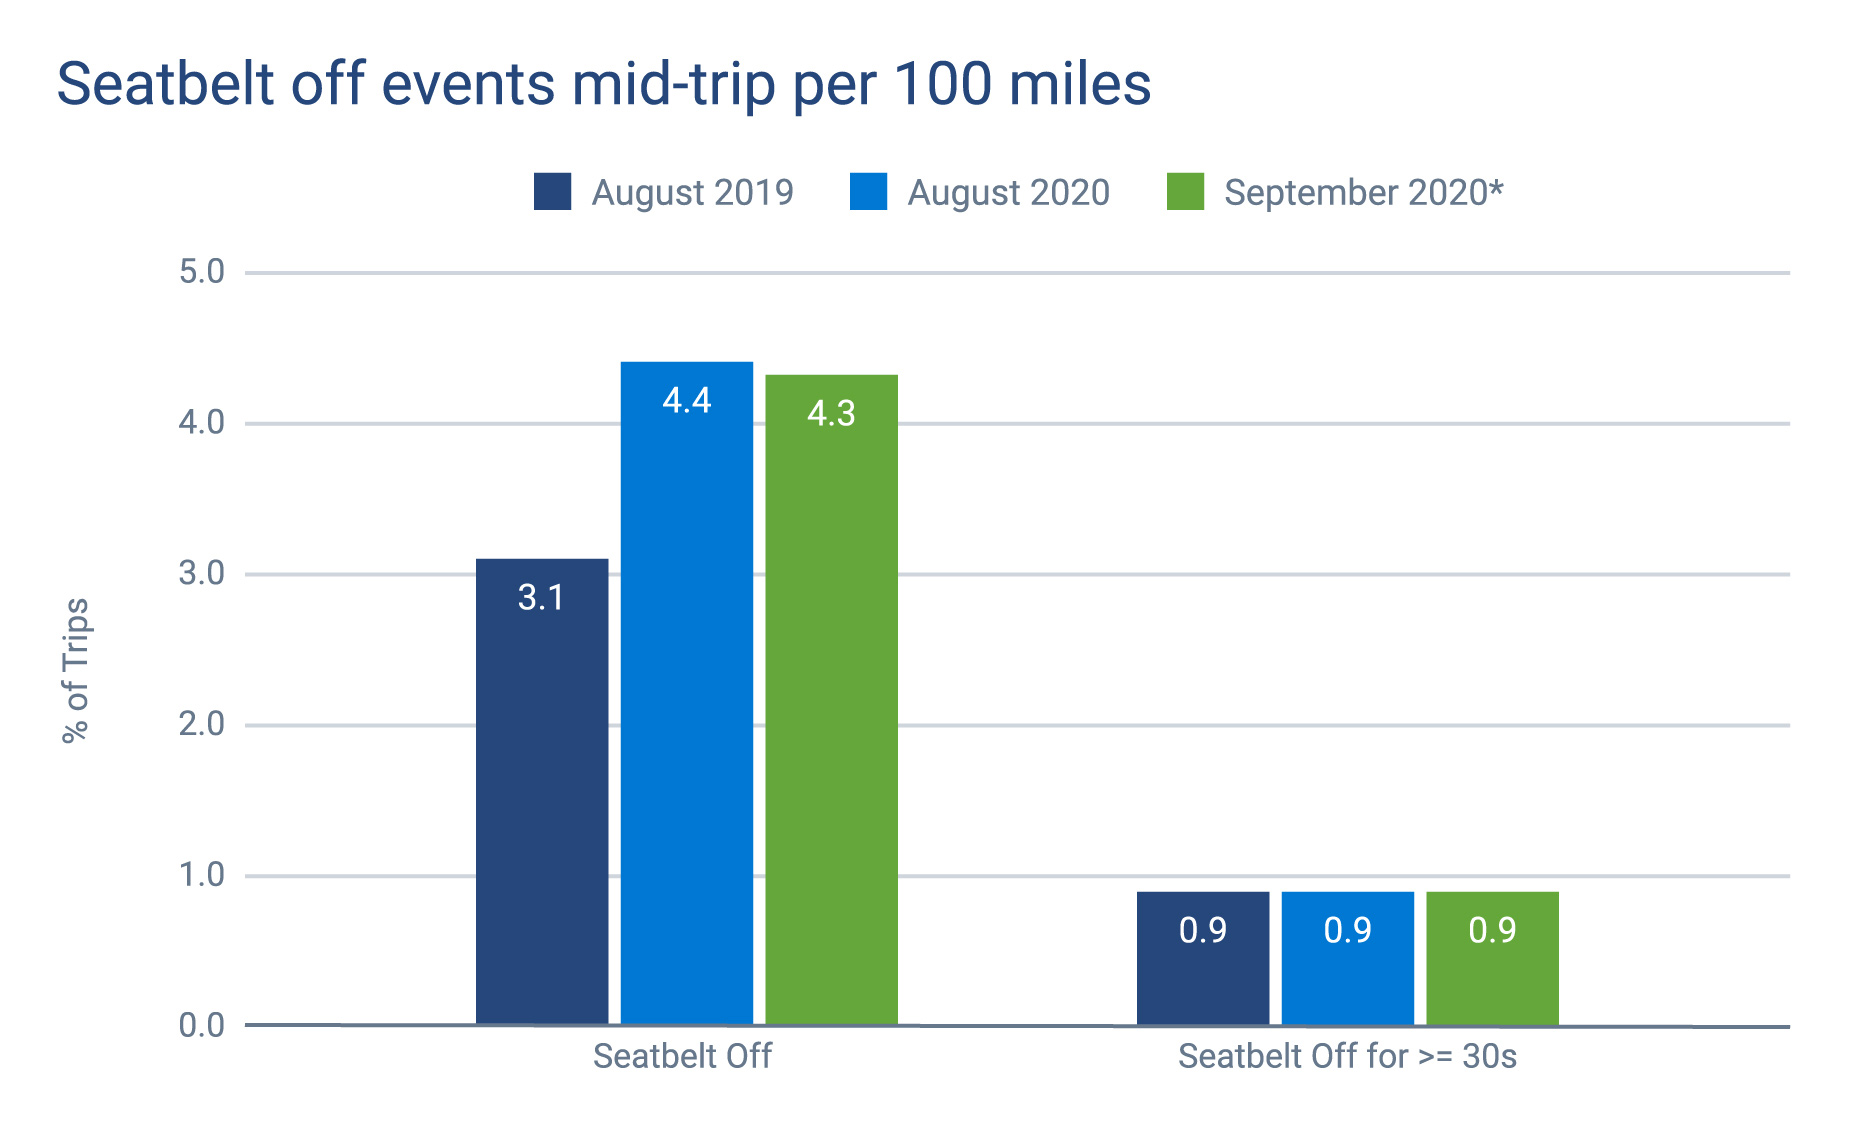
Although the proportion of trips for all harsh driving metrics decreased year-over-year in August, the numbers in September 2020 show a slight increase . Seat belt off event rates show a slight decrease month-over-month in September, but are still at higher levels when compared to August 2019. This time series view looks at change in behaviour specific to the cohort of vehicles that we’ve seen since August 2019.
* September 2020 based on partial month data up to September 20, 2020
Policy impact analysis
Low Speed Zone policy
To understand the impact of local policy changes on driver behaviour, the low emission zones implemented in London were analysed.
We started off looking at all of the median speeds across the UK, and then zoomed in on London. We see reduced median speeds within the confines of the inner ring road as compared to roads outside of the ring road.

London segment speeds in August 2020: Heatmap of median speeds (mph) across London, UK for the month of August 2020. Segments and area coloured in red denote slower median speeds.
Zooming into Central London’s new 20mph speed limit zone introduced in March, we saw a six percent reduction in the proportion of traversals speeding since inception to August. This showcases the need for telematics to measure the impacts and cause and effect of policy decisions and to allow decision makers to operate in real-time as opposed to waiting many months and relying on anecdotal evidence.
ULEZ Zone in London
For trips that pass through this zone, there is a lower proportion of trips with harsh events compared to the national average. But for harsh acceleration and cornering, there has been an increase in this zone since the establishment of the new 20mph speed limit zone.
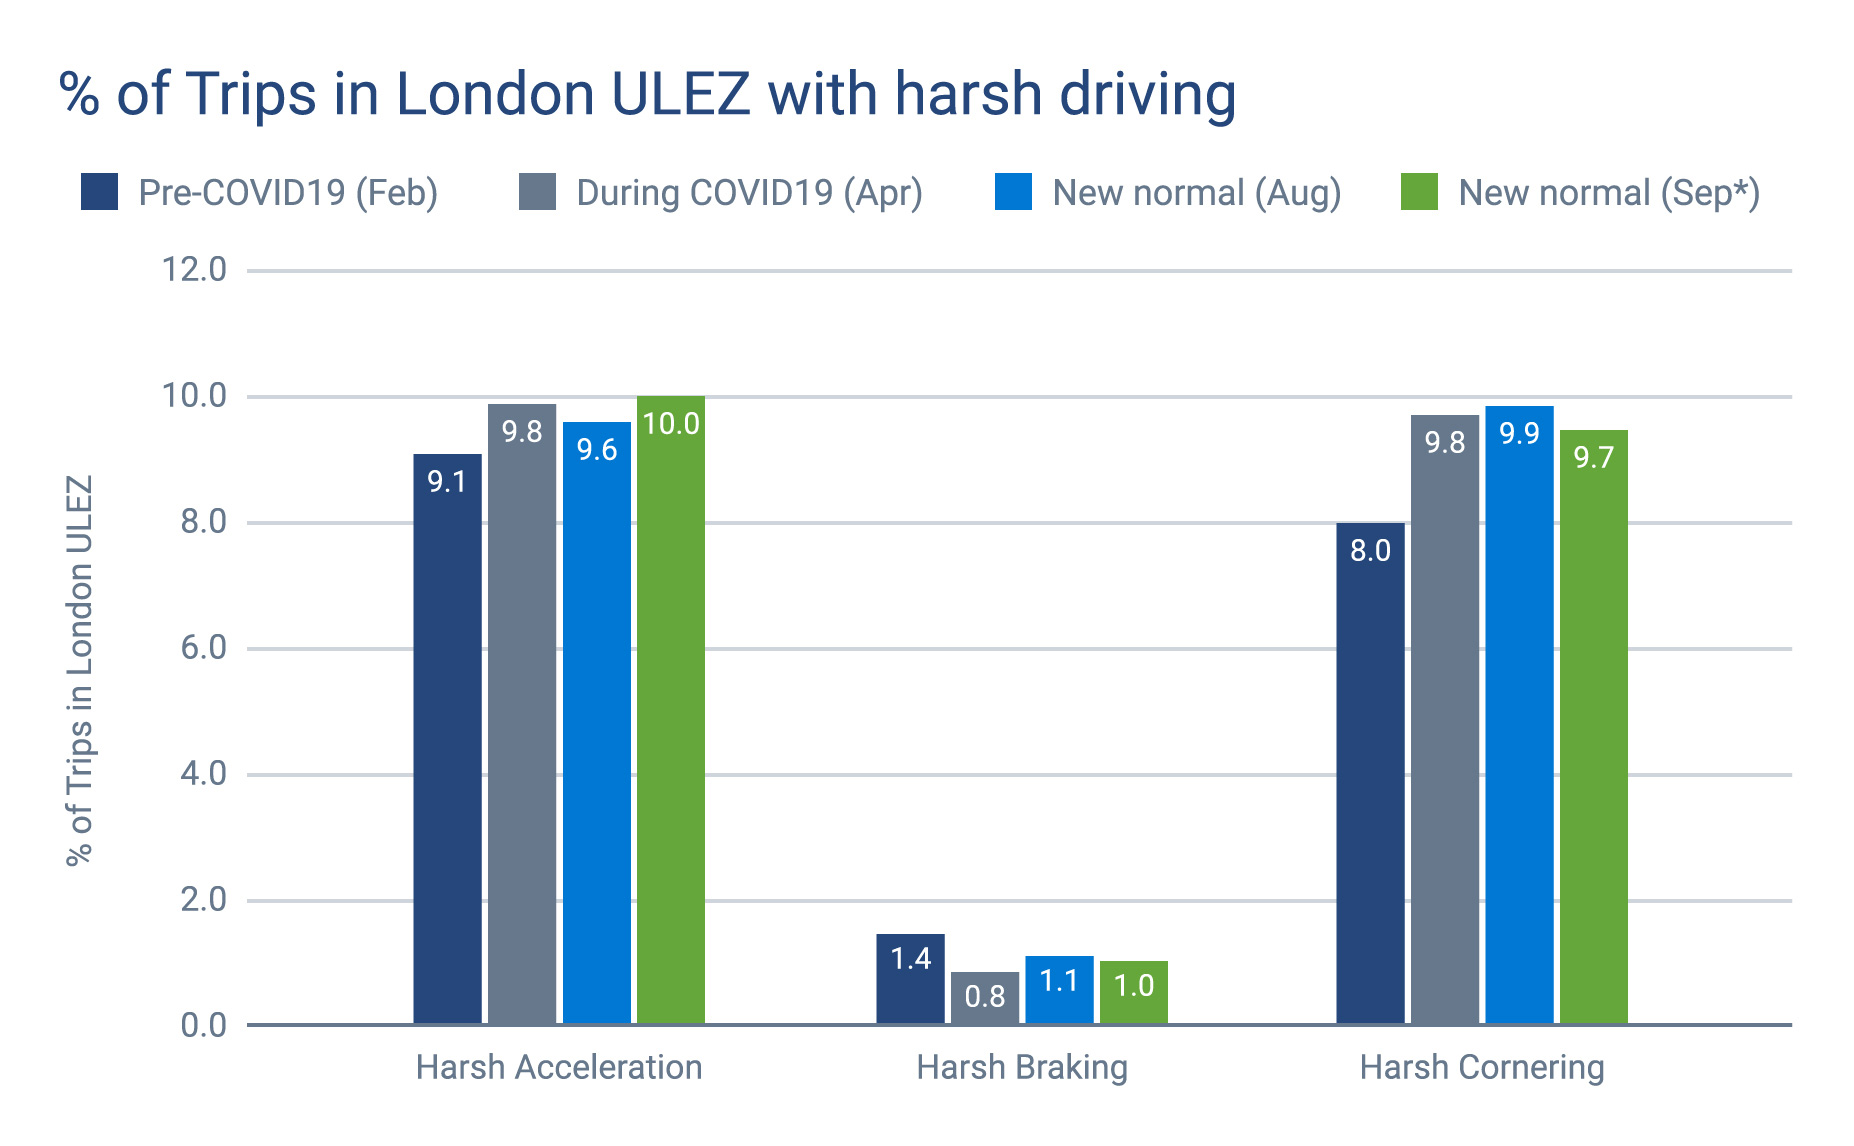
Harsh events in London’s Ultra Low Emission Zone: Proportion of trips that pass through London’s Ultra Low Emission Zone (ULEZ) with harsh driving behaviour. We see an increase in both harsh acceleration and harsh cornering. This time series view looks at change in behaviour specific to the cohort of vehicles that we’ve seen since February 2020 (Pre-COVID-19).
Driver safety in the UK versus Canada
Comparison with similar groups is often a useful tool to understand if the subject of analysis is under or over performing peers. In this case, we have taken advantage of our Canadian roots to compare data across a similar set of vehicles.
The data shows that the UK had a higher proportion of vehicles that exhibited harsh events throughout the month in comparison to Canada. Looking at proportions of trips with harsh driving events instead, the UK figures are marginally higher than Canada for harsh acceleration and cornering, with less than one percent of trips having harsh braking events for both countries.
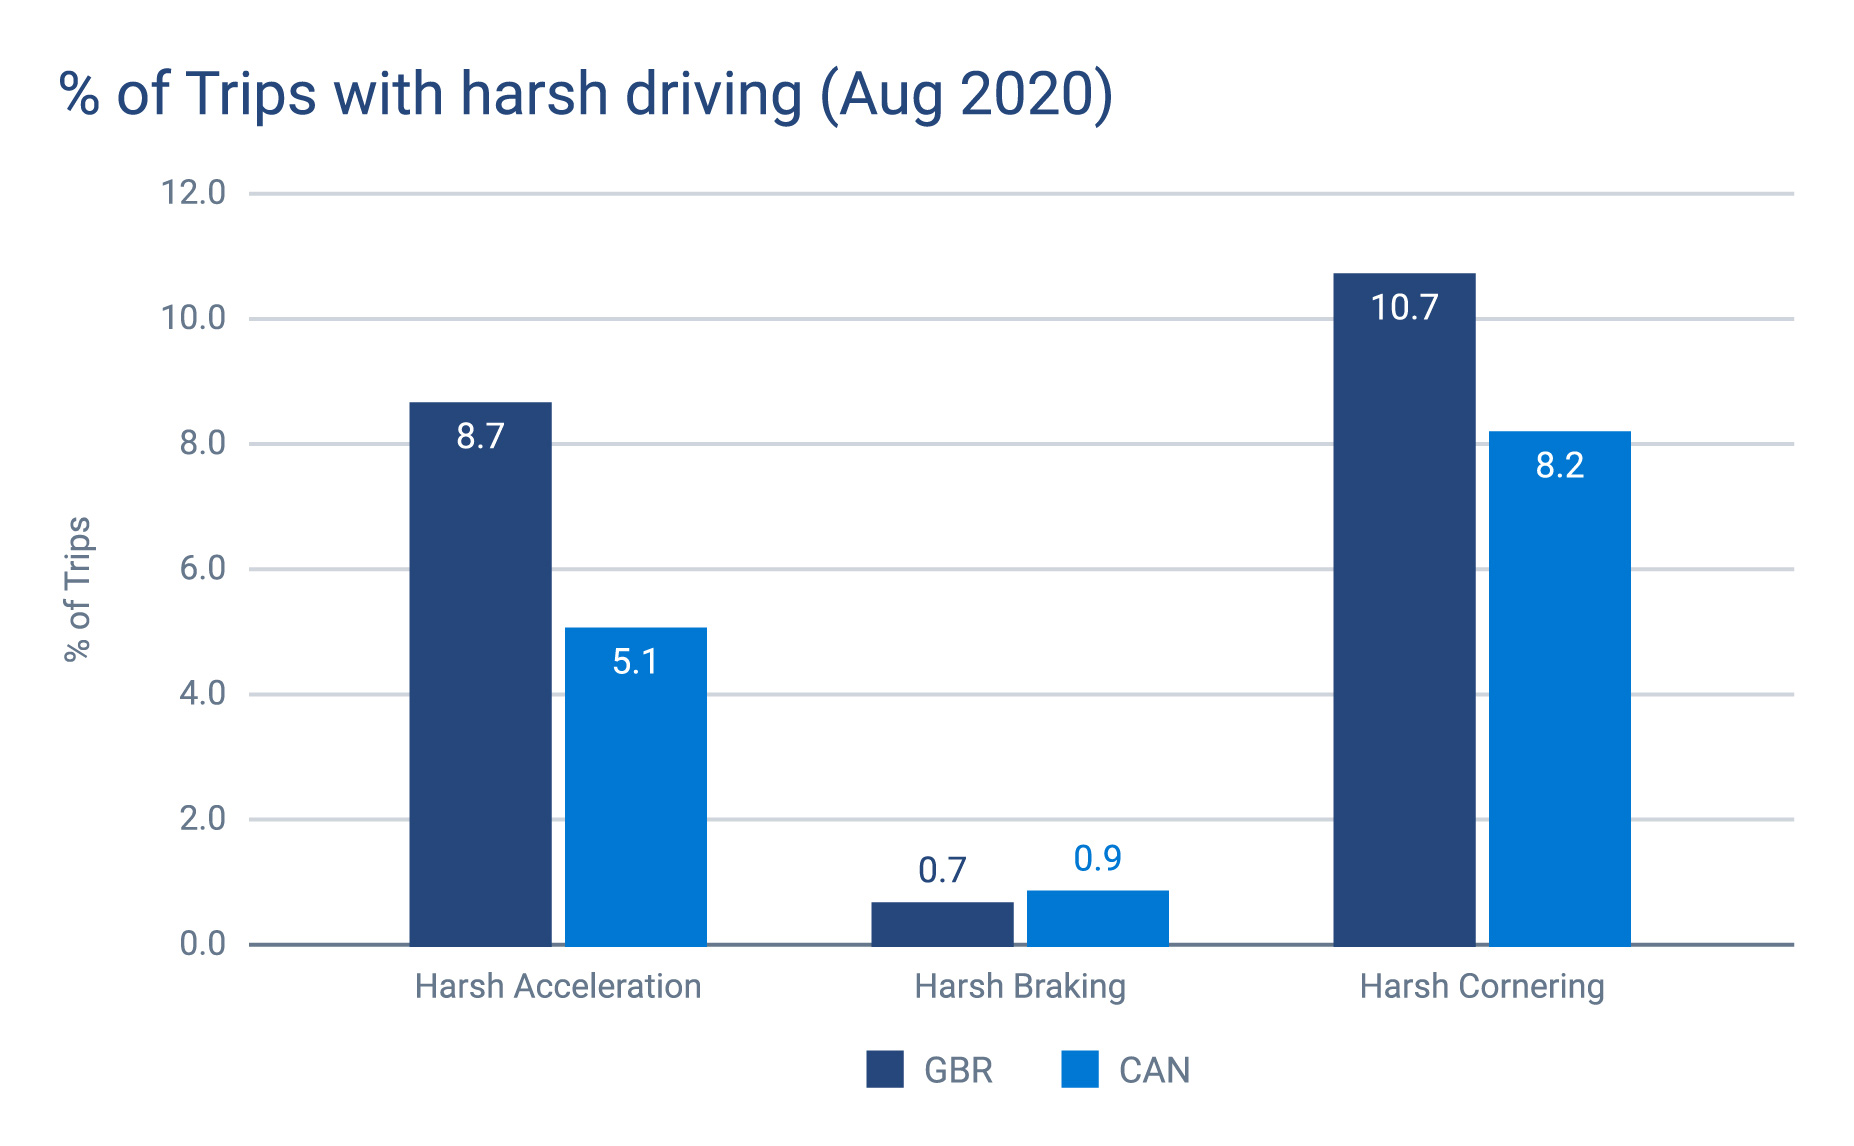
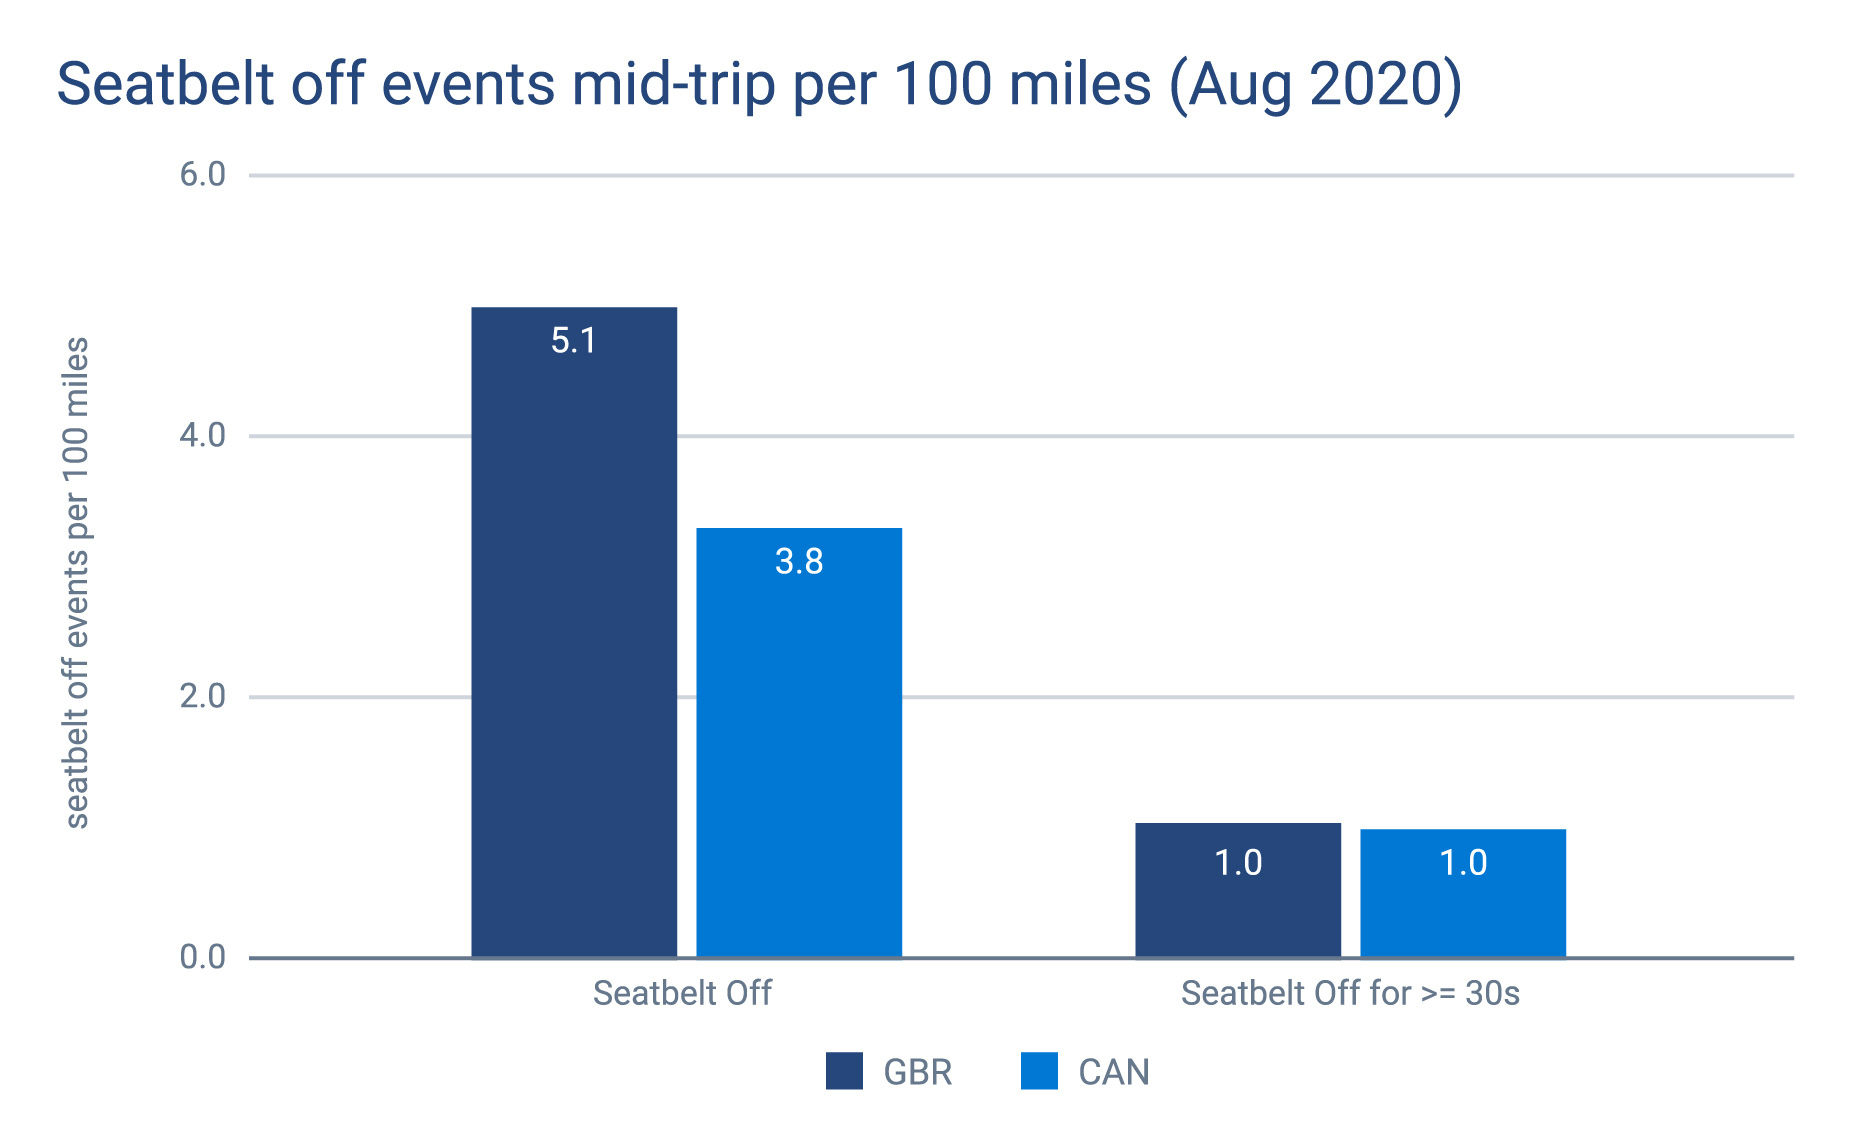
Comparison charts: A comparison of harsh event rates (proportion of trips with harsh events) and seatbelt off event rates between vehicles in Canada and the UK.
The UK also has a higher proportion of trips with some form of harsh driving. Not only that, we also observe a higher seatbelt off mid-trip event rate per 100 miles for the UK compared to Canada.
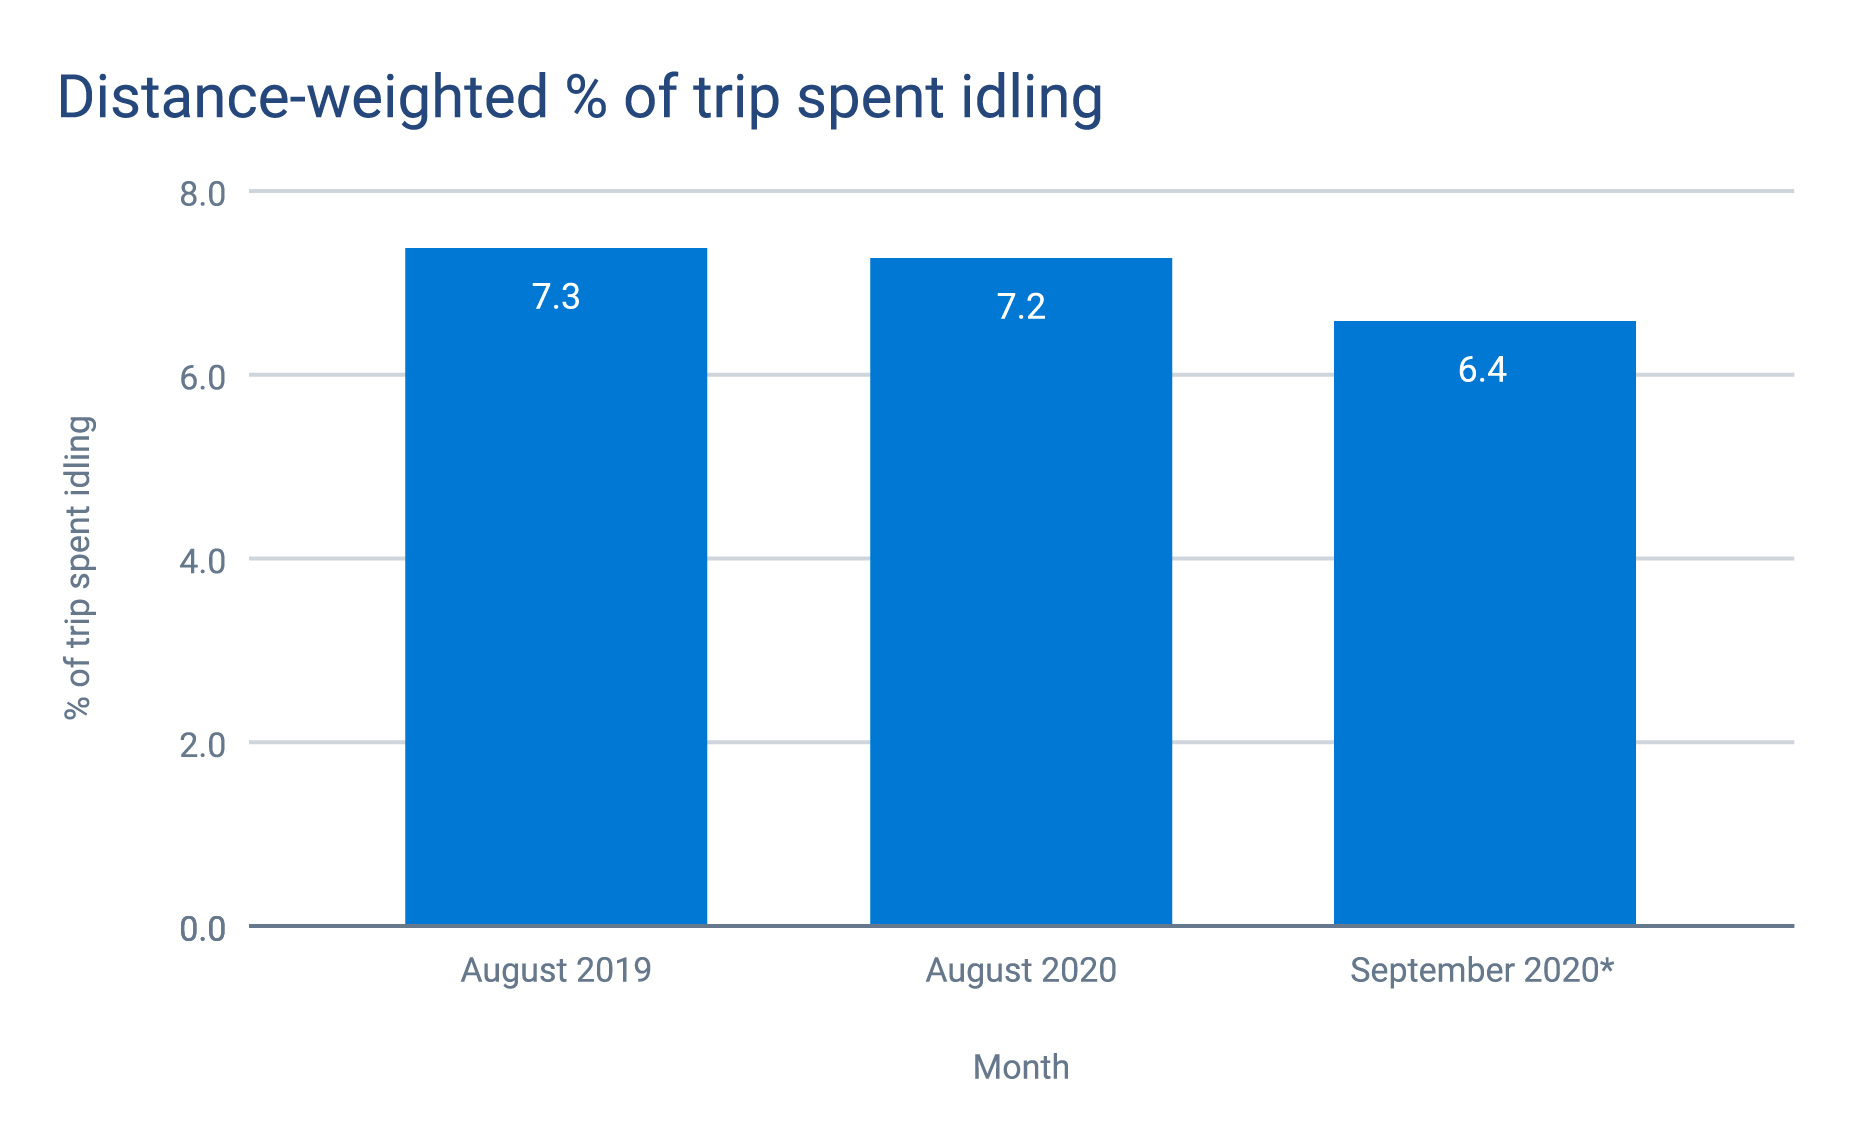
Distance weighted percentage of trip spent idling: Idle time (as percentage of trip duration) has been decreasing year-over-year. For a one hour trip, 6.4% translates to about 4 minutes of idling. This time series view looks at change in behaviour specific to the cohort of vehicles that we’ve seen since August 2019.
* September 2020 is based on partial month data up to September 20, 2020
** Weighted by trip distance to avoid penalizing unproportionately high idle times in short trips
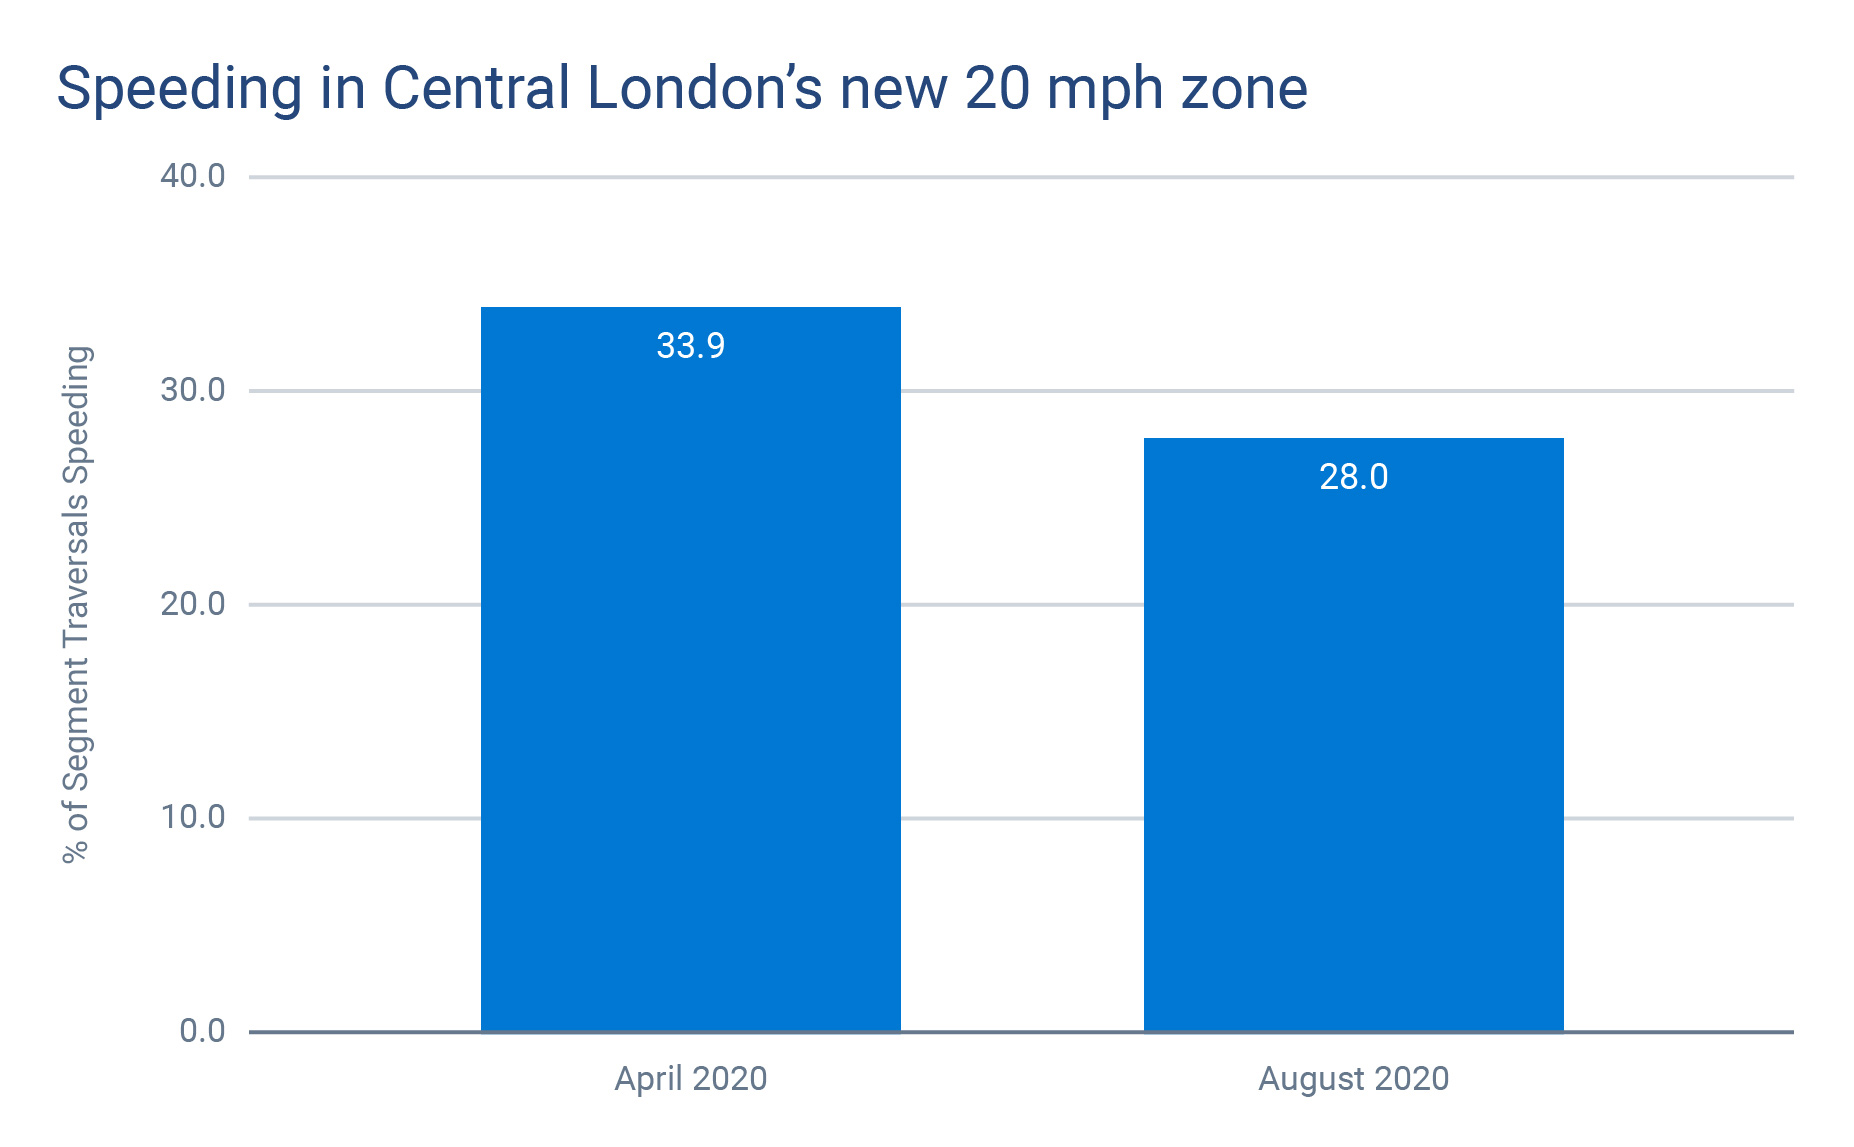
Speeding in Central London: The new 20 mph speed limit was applied since March 2020. Since then, the proportion of segment traversals that are not compliant has dropped by almost six percent from April to August. This time series view looks at change in behaviour specific to the cohort of vehicles that we’ve seen since April 2020.
* Segments based on https://www.rac.co.uk/drive/news/motoring-news/new-20mph-limit-rolls-out-in-central-london-find-out-where-it-applies/
Safety is vital
Safety is one of our pillars at Geotab, we hope by providing this information,we are able to help policy makers receive insights. The convergence of telematics and big data can help make fleets safer. If you are in a position where our data or expertise could help reduce risk on the roads as well as help you with other benefits from telematics such as cost savings, please reach out to aaronjarvis@geotab.com.
Subscribe to the Geotab Blog
Associate Vice President, Sales and Business Development, UK & Ireland
Associate Vice President, Sales and Business Development, UK & Ireland
Subscribe to the Geotab Blog
Related posts


How predictive maintenance reduces downtime and costs for large fleets
June 23, 2026
4 minute read

Understanding OEM telematics and what it means for your fleet
June 19, 2026
3 minute read
AI video telematics: securing driver exoneration in Europe
June 18, 2026
2 minute read
.jpg)
Tachograph exemptions in the UK and Europe: complete guide for fleet operators
May 11, 2026
4 minute read