How long do electric car batteries last? What analysing 10,000 EVs tells us…
Geotab's findings show EV batteries can last 20+ years — find out how to extend your EV’s battery life with simple maintenance tips.

May 9, 2025
Key Insights
- EV battery lifespan: Most EV batteries last 15-20 years, with an average degradation rate of about 1.8% per year under moderate conditions.
- Impact of charging methods: Frequent use of DC fast charging can accelerate battery degradation, especially in hot climates. Level 2 charging is gentler on the battery.
- Best practices for battery health: To extend EV battery life, keep the state of charge 20%-80%, minimize exposure to extreme temperatures and limit fast charging when possible.
Electric vehicle (EV) battery health refers to an EV battery's condition and performance capacity over time. It measures how well the battery retains its ability to store and deliver energy compared to its original capacity. Maintaining good battery health is crucial for EV owners to ensure optimal range, efficiency and overall vehicle performance.
But how long do these batteries last in the real world? By analysing data from 10,000 EVs, we uncovered patterns, factors and insights that paint a clearer picture of EV battery longevity — and how you can make the most of yours.
How long do EV batteries last?
When we analysed EV battery health in 2019, we found that EV batteries degraded, on average, at a rate of 2.3% per year. However, a new 2024 analysis reveals a significant improvement: EV batteries now degrade at an average of 1.8% per year. This improvement highlights ongoing advancements in battery technology and durability.
According to Geotab research, EV batteries could last 20 years or more if degradation continues at this improved rate. This is particularly encouraging for fleet operators under pressure to reduce CO2 emissions.
Transitioning to EVs is the most effective way to cut emissions, and telematics data offers the insights needed to address lingering doubts about replacing internal combustion engine (ICE) vehicles with EVs.
Recent Geotab data shows:
- 75% of light commercial vehicles could be replaced by comparable EVs today.
- An EV could save $25,000 per vehicle over its life span.
Do electric cars lose range over time?
Yes, EVs do lose range over time due to battery degradation. However, with an average degradation rate of just 1.8% per year, EVs should retain most of their range for over a decade, ensuring their long-term practicality and value.
What are common factors that impact battery lifespan?
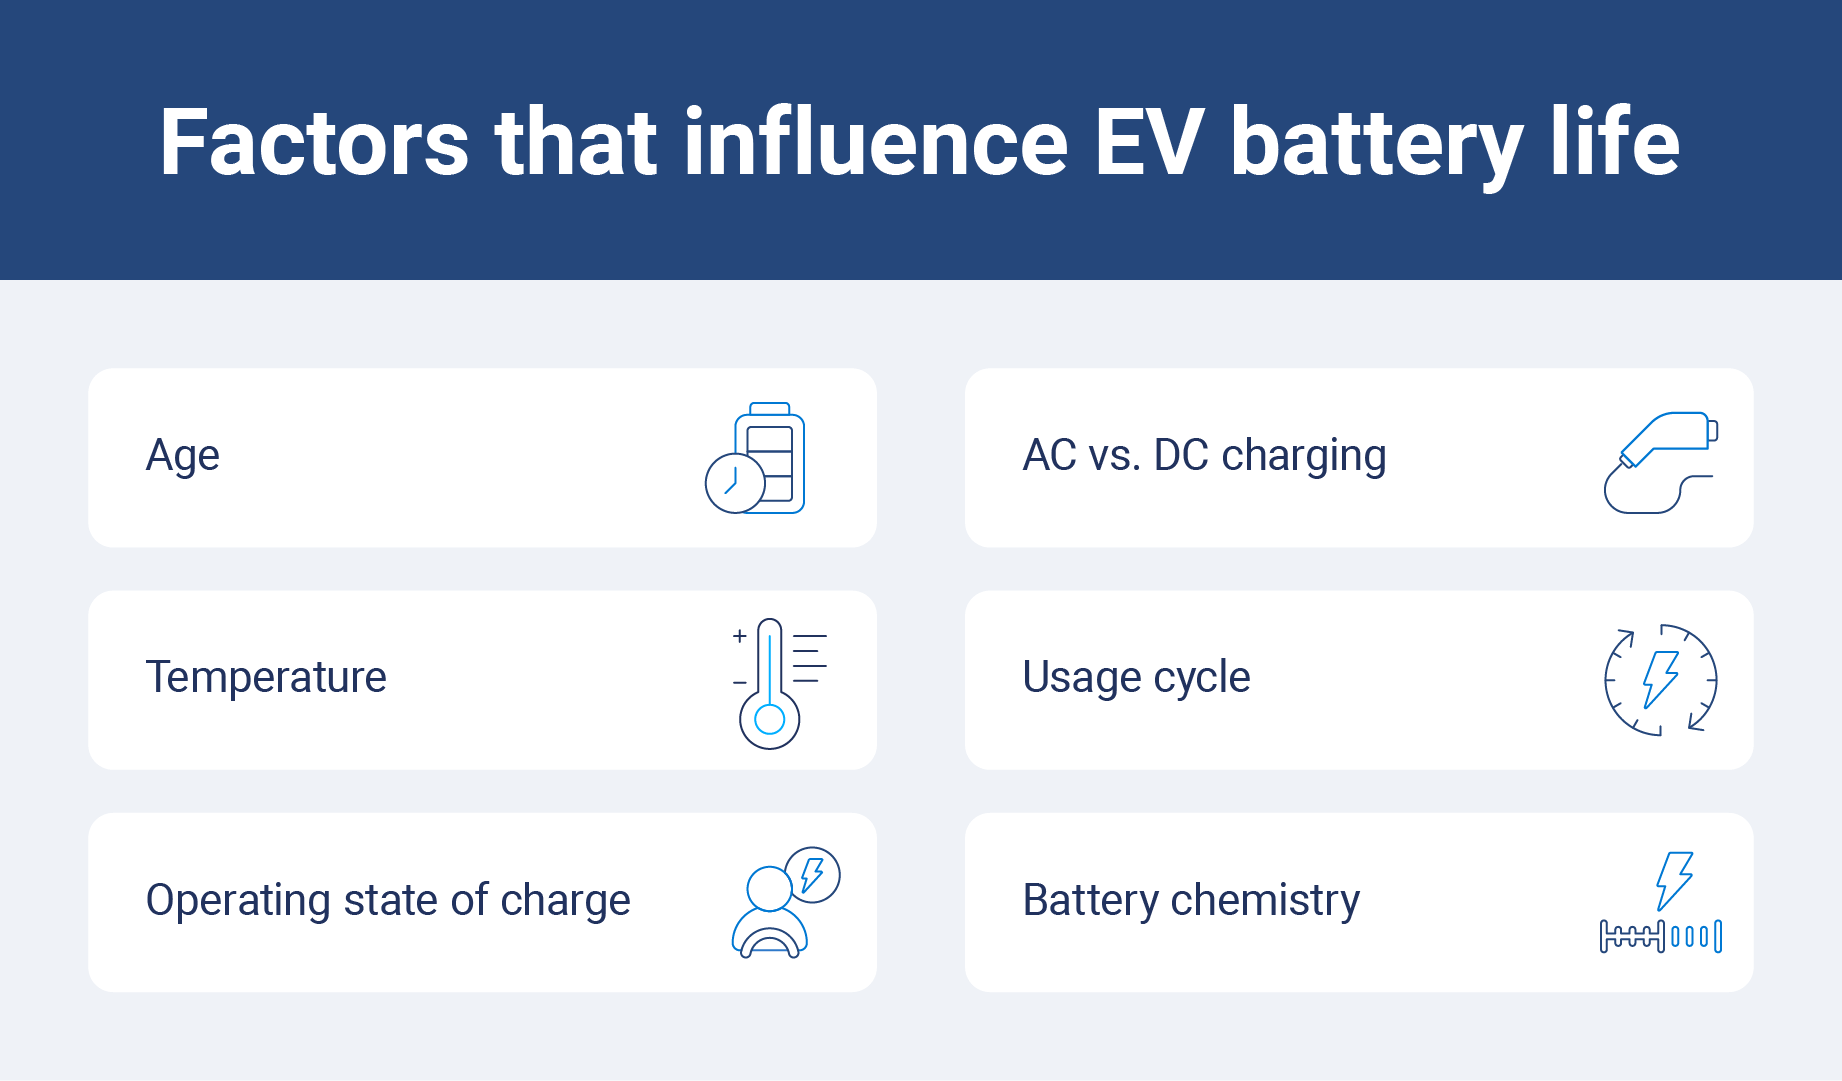
Modern battery electric vehicles (BEVs) and plug-in hybrid electric vehicles (PHEVs) primarily use lithium-ion batteries, known for their efficiency and durability. However, several factors influence how long these batteries last and why their range may decline over time:
- Age: All batteries degrade over time, reducing capacity.
- Temperature: Extreme heat or cold accelerates wear, emphasizing the importance of thermal management.
- Operating state of charge: Keeping the charge between 20% and 80% minimises strain.
- AC vs. DC charging: Frequent DC fast charging may degrade batteries faster than slower AC charging.
- Usage (energy cycles): Each charge-discharge cycle slightly impacts capacity.
- Battery chemistry: Lithium-ion types, such as NMC or LFP, vary in durability.
- Battery system and thermal management: These features help maintain efficiency and prevent overheating.
To ease EV range anxiety, you can use diagnostic tools to monitor performance and prioritise EV battery maintenance to extend lifespan.
Is there a difference in lifespan based on make, model and year?
Yes, EV battery lifespan varies depending on the make, model and year of the vehicle. Two key factors influencing this are battery chemistry and the thermal management system. Different lithium-ion chemistries respond uniquely to stress, and air — or liquid — based cooling techniques can significantly impact degradation rates.
Is liquid cooling or air cooling better for EV battery longevity?
Liquid cooling systems are better for EV battery longevity than passive air cooling systems. As you can see in Figure 1, the 2015 Tesla Model S, which uses liquid cooling, has an average degradation rate of 2.3%. In contrast, the 2015 Nissan Leaf, with passive air cooling, shows a much higher rate of 4.2%.
This data highlights how robust thermal management systems can greatly slow battery degradation.
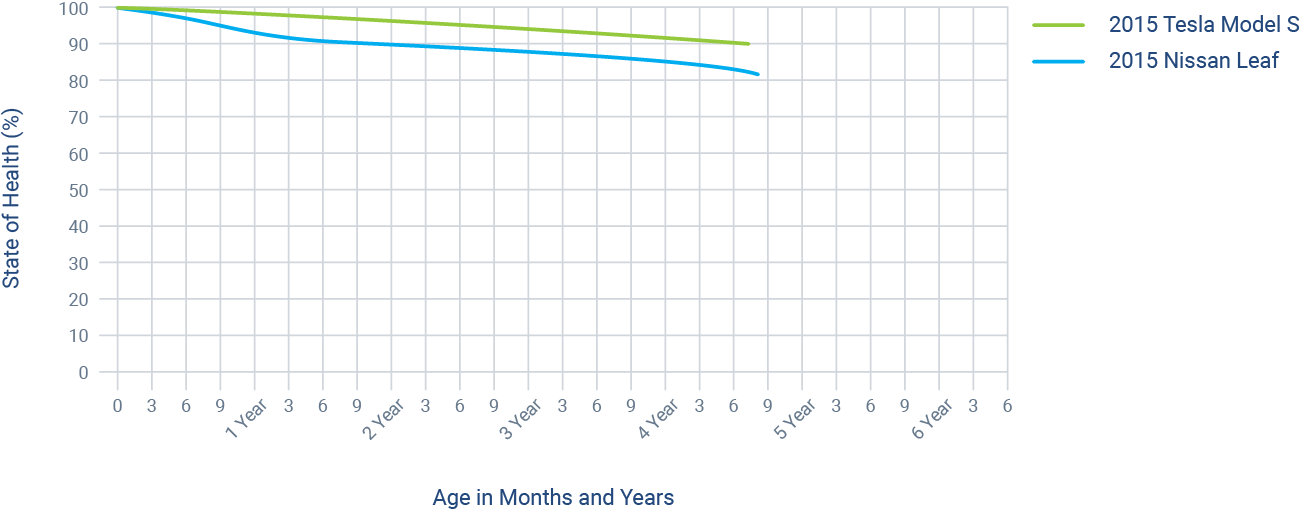
Figure 1: Battery degradation comparison of the 2015 Tesla Model S (liquid cooling) vs. the 2015 Nissan Leaf (passive air cooling
What is EV battery degradation?
EV battery degradation is a natural process that permanently reduces the amount of energy a battery can store or the amount of power it can deliver. The batteries in EVs can generally deliver more power than the powertrain components can handle. As a result, power degradation is rarely observable in EVs, and only the loss of the battery’s ability to store energy matters.
An EV battery’s condition is called its state of health (SOH). Batteries start their life with 100% SOH and over time they deteriorate. For example, a 60 kWh battery with 90% SOH would effectively act like a 54 kWh battery.
Do electric car batteries degrade?
Yes, like all batteries, EV batteries degrade. However, EV batteries, on average, exhibit high levels of sustained health, and battery degradation rates are improving in newer models.
Our latest research finds that EV batteries are degrading at 1.8% per year on average. The last time we analysed battery degradation in 2019, we found an average annual degradation rate of 2.3% (which was already quite good). See Figure 2 below for the battery degradation rates of the 11 EV models analysed.
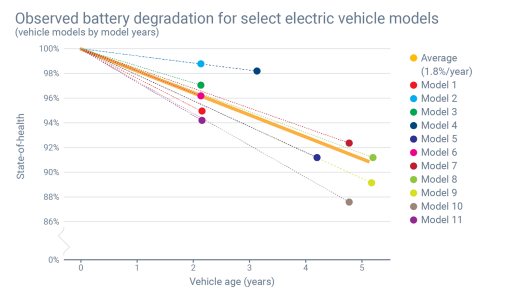
Figure 2: Average battery degradation rates for selected electric vehicle models over five years
Is battery degradation linear?
While our analysis shows more or less linear degradation, as a general rule, EV battery life is expected to decline non-linearly: an initial drop, which continues to decline but at a far more moderate pace. Toward the end of its life, drivers can expect to see a final significant drop in the battery’s state of health, as seen in the chart below.
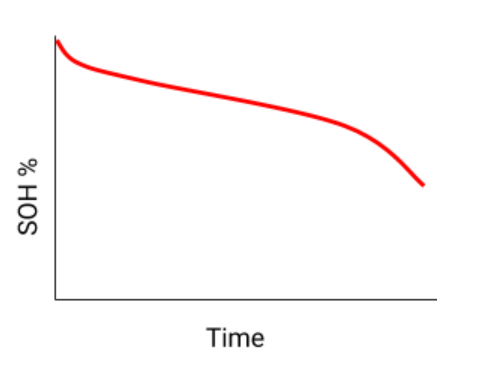
Figure 3: Expected battery degradation curve.
How does temperature impact battery degradation?
Temperature plays a significant role in why batteries degrade. EV batteries exposed to extreme heat degrade faster than those in cooler climates. For example, an EV in Arizona will likely have a shorter battery life than the same model driven in Norway.
To study this, we grouped vehicles by climate:
- Temperate: Fewer than five days per year over 80℉ (27℃) or under 23℉ (-5℃)
- Hot: More than five days per year over 80℉ (27℃)
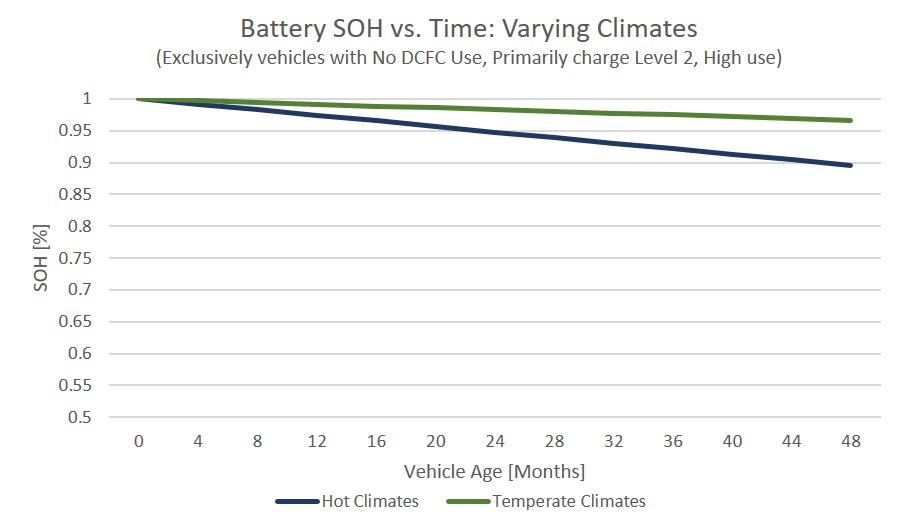
Figure 4: Batteries exposed to hot days degrade faster than those in temperate climates.
As shown in Figure 4, EVs in hot climates experience a faster rate of battery decline. This is concerning for fleets operating in high-temperature areas, but adopting EV battery maintenance strategies can help. Practices like optimising EV charging habits and using thermal management systems are essential to keeping an EV battery healthy.
Does high vehicle use impact battery degradation?
Surprisingly, our research found that high-use electric vehicles do not experience significantly greater battery degradation than lower-use vehicles. This is encouraging news since EVs deliver better value when driven more frequently.
The key takeaway? You can confidently use your EVs in high-demand duty cycles without worrying about accelerated battery wear, provided they stay within their daily driving range. However, frequent use of DC fast charging for high-use vehicles may contribute to faster degradation.
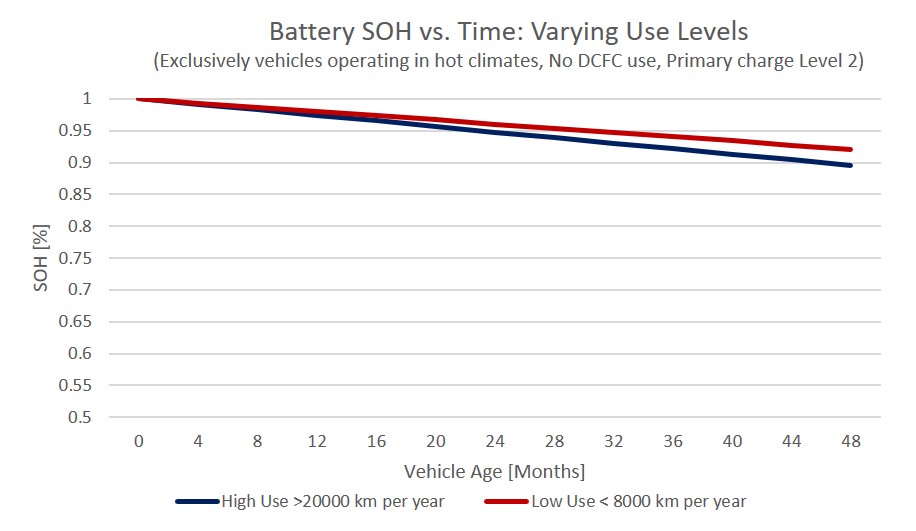
Figure 5: High- and low-use vehicles experience similar levels of battery degradation.
How do charging methods affect battery health?
Our analysis showed no significant impact on degradation rates when comparing high-use and low-use vehicles — when controlling for DC charging use.
However, analysing the same vehicle model in a high-use situation exposed to different climates and charging power, we saw a strong correlation between high-temperature climates, frequency of high-power charge usage and battery decline.
We were able to look at the predominant charging level used for the EVs in our system. North American EV charging stations are categorised into three common types:
- AC Level 1 (120 volts) – a regular home outlet in North America
- AC Level 2 (240 volts) – typical for home or fleet charging
- Direct current fast charging (DCFC) – for faster top-ups
There is an observable difference in battery health between cars that routinely charge on Level 2 compared to those that used Level 1, but the difference is not statistically significant.
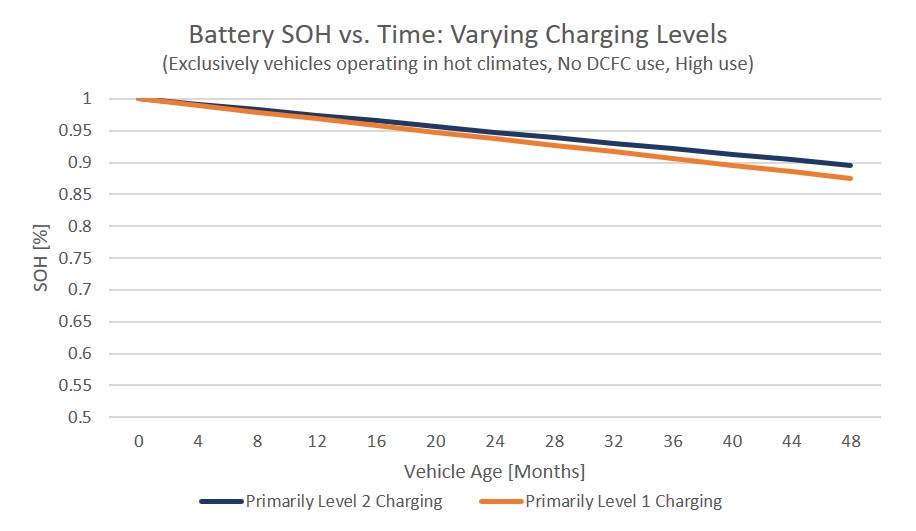
Figure 6: Battery degradation for vehicles that primarily charge on Level 1 compared with Level 2.
On the other hand, the use of DCFC equipment does appear to significantly impact the rate at which batteries degrade. Rapidly charging a battery means high currents, resulting in high temperatures, both of which strain batteries. In fact, many automakers suggest drivers and fleet managers limit the use of DC fast charging to prolong their electric vehicles’ battery life.
Below, we look at all battery electric vehicles operating in hot climate conditions based on how frequently they used a DCFC: never, occasionally (0-3 times per month) or frequently (3+ times per month).
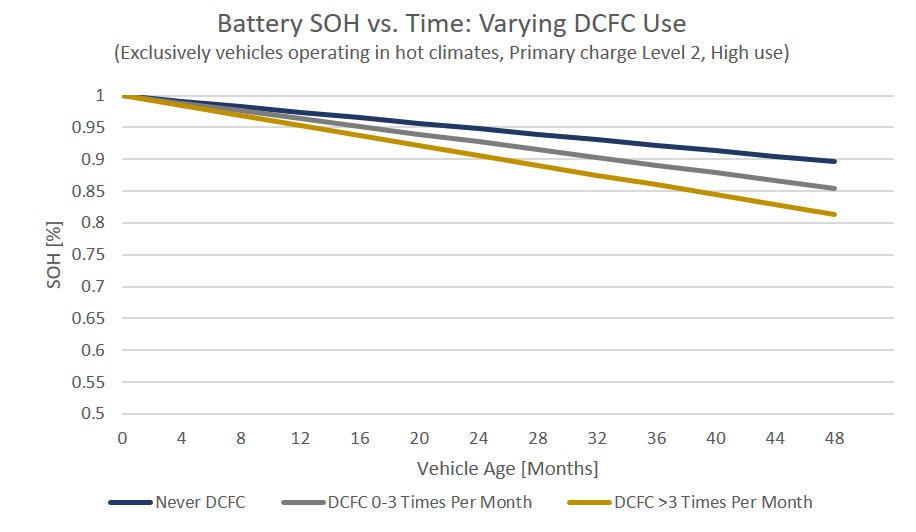
Figure 7: Battery degradation appears to be strongly correlated with DCFC use for vehicles in seasonal or hot climates.
How does the state of charge impact EV battery life?
State of Charge (SOC) refers to the amount of energy an EV battery holds compared to its total capacity. A fully charged battery is at 100% SOC, while a completely discharged battery is at 0%. The "usable" charge, however, is often lower due to charging buffers, which are implemented to protect battery health.
Operating a battery near full or empty can degrade its lifespan, so automakers add buffers to prevent extreme charge levels. These buffers limit the charging capacity through manufacturer settings, ensuring the battery doesn’t regularly hit its maximum or minimum charge levels.
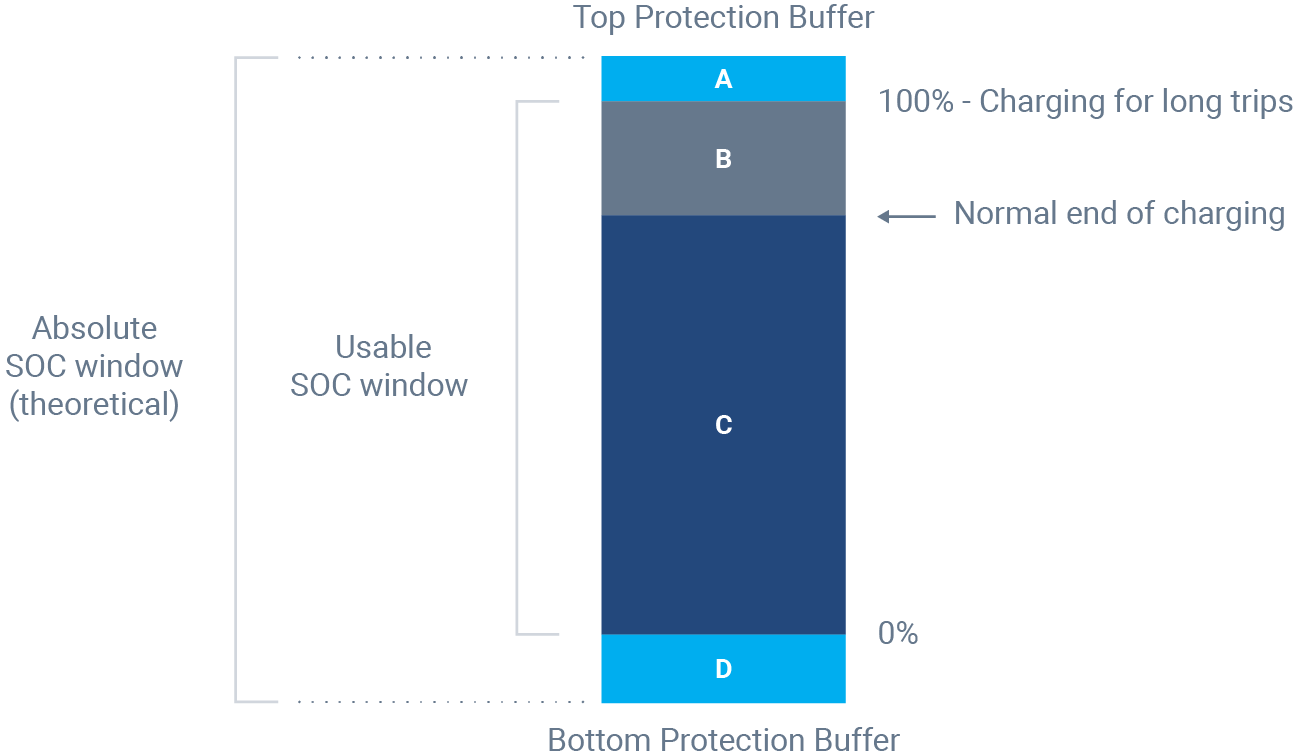
Figure 8: Battery protection buffers control the usable state of charge window for an EV.
Many modern EVs, such as Teslas, can adjust the buffer size through over-the-air software updates, improving battery longevity. Some manufacturers also allow users to set a custom charge limit (e.g., stopping at 75% instead of 100%), helping further extend battery life.
How does the buffer effect influence battery life?
The buffer effect is designed to protect EV batteries from degradation by preventing them from charging too high or discharging too low. Automakers use these buffers to extend battery life, with larger buffers meaning less available energy for driving but a slower degradation rate.
For example, the Chevrolet Volt (now discontinued) employed larger top and bottom buffers, which dynamically adjusted as the battery aged. This design resulted in slower-than-average battery degradation, demonstrating the benefit of these buffers in extending battery lifespan.
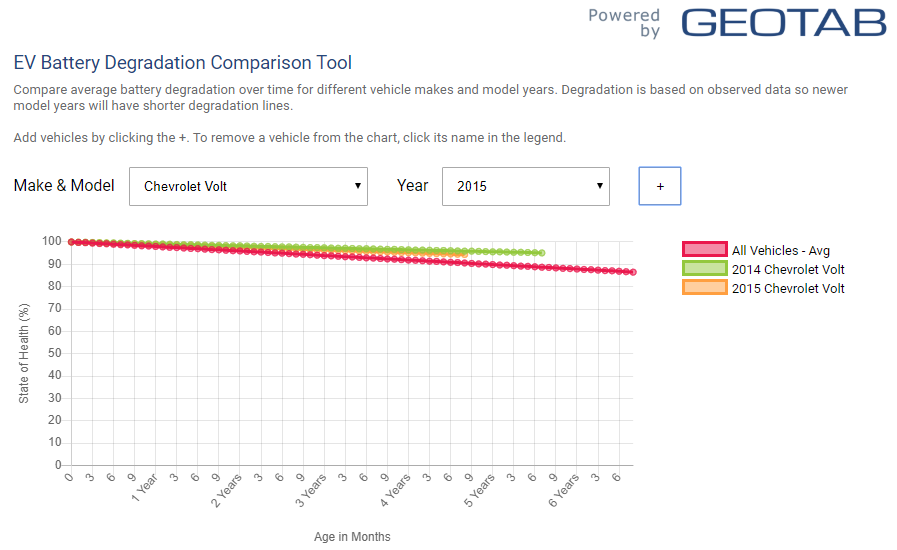
Figure 9: Battery degradation over time for a Chevrolet Volt vs. all vehicles.
How many batteries do you have to maintain on electric vehicles?
Electric vehicles typically have two types of batteries to maintain: the main high-voltage battery that powers the vehicle and a 12-volt battery that handles smaller electrical functions like powering lights, infotainment and the vehicle’s control systems.
While the high-voltage battery generally requires less predictive maintenance due to its design, the 12-volt battery should still be regularly checked, as it can wear out over time. You should monitor both batteries to ensure the vehicle operates efficiently, and some manufacturers offer monitoring systems that help track the health of both batteries.
What is the purpose of the 12-volt battery in an EV?
The 12-volt battery in an electric vehicle powers essential systems such as the lights, power windows, infotainment and other auxiliary components. While it does not drive the vehicle, it ensures all the low-voltage systems function properly, even when the vehicle is off.
What happens to electric car batteries when they die?
When an electric car battery dies, it can no longer store or supply enough energy to power the vehicle. Depending on the severity of the issue, the battery may need to be replaced entirely.
However, many EV batteries are designed to last for many years, and when they do degrade, manufacturers may offer recycling programs to help safely dispose of or repurpose the dead battery.
How to keep an EV battery healthy and extend its life
While some factors are beyond an operator’s control, there are several best practices that drivers and fleet managers can follow to extend the life of EV batteries — and, by extension, the overall longevity of electric vehicles.
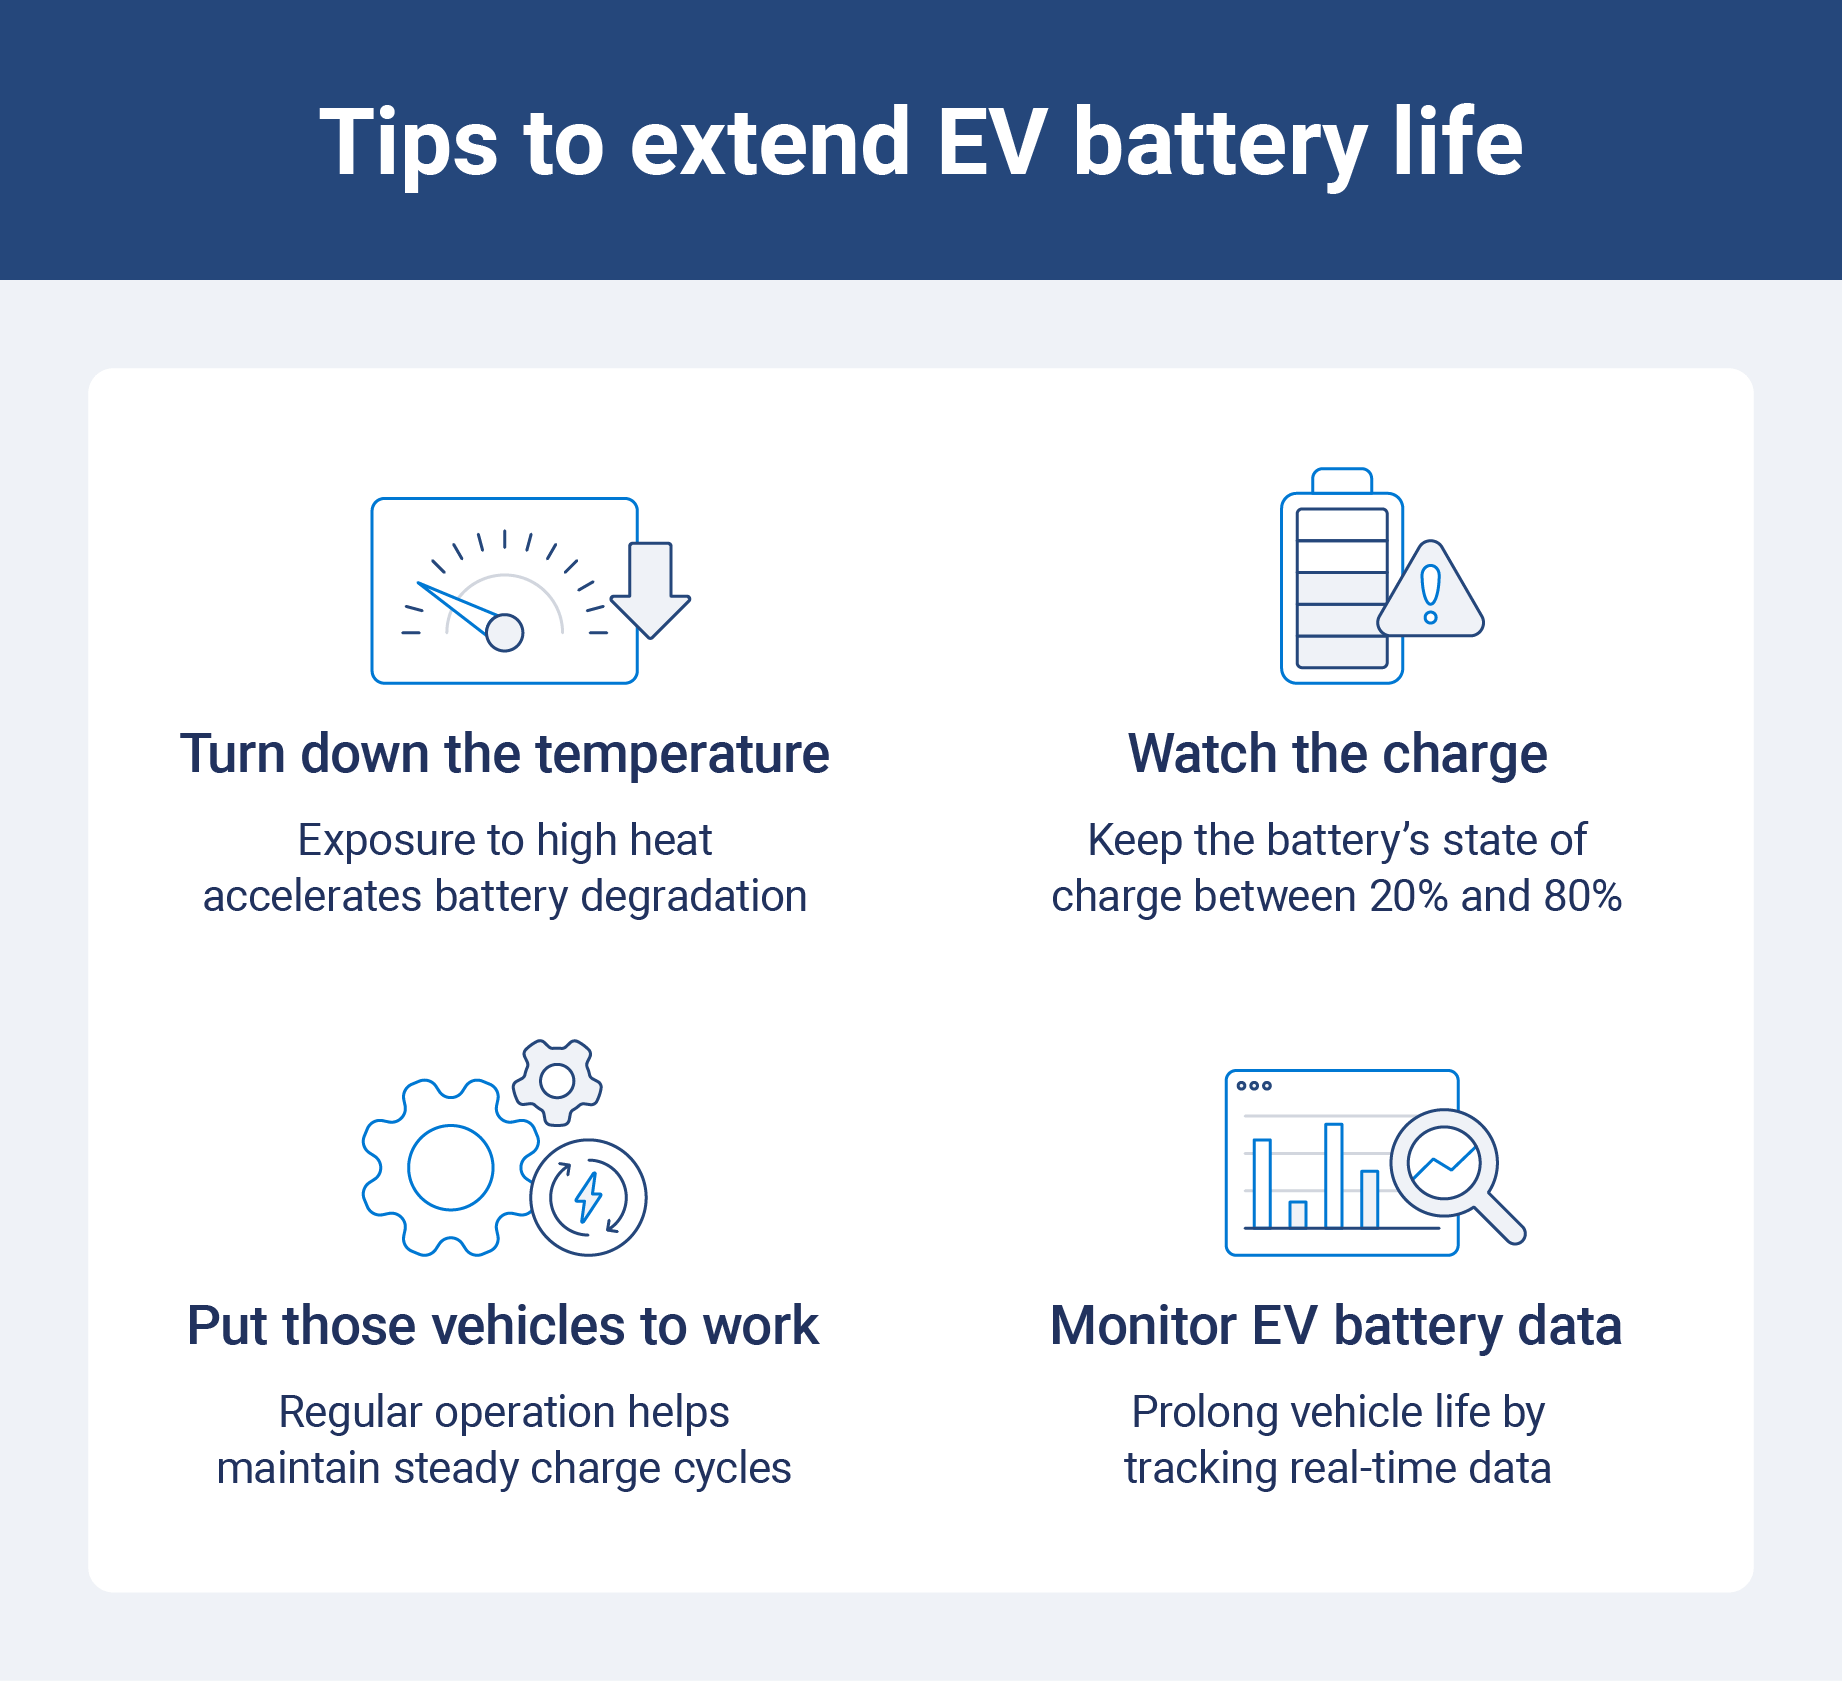
Turn down the temperature
Exposure to high heat accelerates battery degradation, making it essential to keep EVs in moderate temperature conditions for optimal battery health. At these temperatures, batteries may degrade slower than average. If you’re deciding which vehicle to purchase, consider models with liquid cooling for the battery since it offers better protection than air cooling.
Watch the charge
To maintain EV battery health, minimise DC fast charging, especially for fleets that operate high-use duty cycles. If vehicles are parked overnight, Level 2 charging should be sufficient.
Avoid leaving vehicles with a full or empty charge; keeping the battery’s state of charge between 20% and 80% is ideal, particularly for extended periods of inactivity. If available, use adjustable buffer settings to automate this process and reserve full charges for long-distance trips.
Put those vehicles to work
Don’t hesitate to maximise the use of your EVs. High vehicle use does not negatively impact EV battery life, so you can reduce the total cost of ownership by increasing road hours.
In fact, keeping EVs in regular operation can promote optimal battery health by maintaining steady charge cycles and preventing prolonged inactivity, which can lead to reduced efficiency. However, be mindful that frequent use of DC charging, especially in hot climates, may lead to faster degradation.
Pay attention to your EV battery data
Telematics data is crucial for understanding the health of your fleet’s EV batteries. With EV fleet management solutions, you can monitor real-time battery capacity, track degradation rates and make data-driven decisions to extend vehicle life. This data empowers you to take proactive or corrective actions, ensuring vehicles remain efficient and cost-effective over time.
What is the Geotab EV battery degradation tool?
The Geotab EV Battery Degradation Tool provides invaluable insights into how EV batteries degrade over time. First launched in 2019, the tool enables fleet managers to compare degradation rates for various EV models, helping them make data-driven decisions regarding EV adoption and fleet management.
The data used in the tool comes from Geotab’s comprehensive telematics database, which includes real-world performance data from a wide range of EVs in operation.
While the tool offers a detailed look at battery health and degradation, it's important to note that it doesn't include data collected after 2019. However, this tool is still vital for understanding battery performance trends and how different models hold up over time.
We hope this data helps fleets decide which EVs will best fit their operational needs and sustainability goals.
To sum it up, our data shows that EV batteries degrade slowly, with an average decline of just 1.8% per year. By following best practices for charging and use, you can replace ICE vehicles with EVs that will last well beyond the vehicle’s useful life. Ready to make the switch?
Frequently Asked Questions
Older EV batteries may only last 8-15 years, depending on factors like climate, driving habits, and maintenance. But based on our latest analysis, including the most recent models, on average, EV batteries are degrading at a rate of around 1.8% per year, which could mean a lifespan of 20 years or more, if properly maintained. In general, our data indicate that EV batteries should outlast the vehicle's useful life.
Fast charging, particularly using DC fast chargers, can increase battery degradation due to the higher temperatures and currents involved. Frequent use of fast chargers may shorten the battery’s lifespan compared to slower Level 2 charging.
You can check your EV battery health using telematics tools that provide data on its state of charge, degradation rate and remaining capacity. Many EVs also offer built-in diagnostics to monitor battery performance and notify drivers of potential issues.
Charlotte is Senior Manager, Fleet Electrification for Geotab.
Table of contents
- How long do EV batteries last?
- What are common factors that impact battery lifespan?
- Is there a difference in lifespan based on make, model and year?
- What is EV battery degradation?
- How does temperature impact battery degradation?
- Does high vehicle use impact battery degradation?
- How do charging methods affect battery health?
- How does the state of charge impact EV battery life?
- How does the buffer effect influence battery life?
- How many batteries do you have to maintain on electric vehicles?
- How to keep an EV battery healthy and extend its life
- What is the Geotab EV battery degradation tool?
Related posts

Geotab launches the 2026 report: connected fleets in Australia
June 15, 2026
2 minute read

Heavy Vehicle Fuel Consumption in Australia: 2026 Fleet Efficiency Guide
March 27, 2026
2 minute read

Telematics trends for 2026: What is changing and how Australian fleets can respond
January 30, 2026
7 minute read

Six ways telematics reduces costs for waste management fleets
January 21, 2026
6 minute read

Fuel efficiency techniques every transport operator should know
December 2, 2025
3 minute read