How to tackle rising fuel costs and increase fuel efficiency with telematics
Discover the top dashboard reports to help track trends and reduce your fuel spend when costs are on the rise.
By Geotab Team
Jun 25, 2025
.jpg)
For many companies, fuel consumption and related costs are a top priority. Fuel remains one of the largest expenses for fleets, with fuel accounting for 60% of total fleet operating costs. In fact, fuel is often the number one expense they track.
As petrol prices rise, there is even more pressure on managers to control costs while still maintaining operations and keeping customers happy. This is where technology can help. By connecting to telematics, fleets can clearly see where their money is going, and identify and limit wasteful behaviours.
Fuel cards:
https://marketplace.geotab.com/solutions/fleetcor/
If you are looking to get a quick understanding of how and when fuel is consumed and if fuel is being wasted, MyGeotab is a readily available source of detailed and historical information on fuel trends. Here are the top MyGeotab reports to help you increase fuel efficiency and manage fuel costs.
Fuel and EV Energy Usage report
The Fuel and EV Energy Usage report, found under the Engine & Maintenance section in MyGeotab, summarises fuel economy, distance travelled and monthly fuel usage across a chosen time period. The report can be filtered by vehicle or time period.
This report helps fleet managers identify fuel efficiency and performance across the whole fleet or specific vehicles. You can examine the fuel economy of your assets and determine the action needed to improve efficiency and slash costs through improving driver behaviour or targeting maintenance.
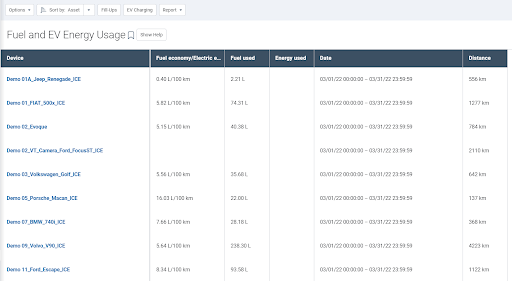
A sample of the Fuel and EV Energy Usage report in MyGeotab.
Fill-Ups report
The MyGeotab Fill-Ups report shows fuel fill-ups that are detected from a vehicle's fuel level diagnostic measurements or from user-imported fuel transactions. A fill-up event is defined as any time fuel is added to the vehicle. The report will show you a brief summary, including total fuel added and total cost, for the time period you select.
This valuable fleet report can point you to unmatched fuel transactions that need further investigation. You can also use this telematics data to validate fuel transactions.
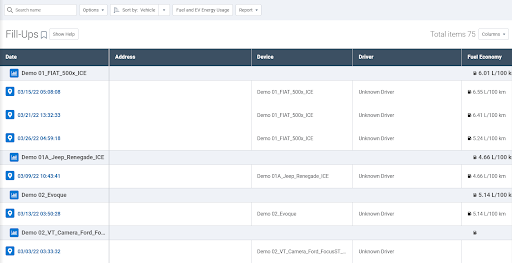
A sample fill-up report featuring fuel data over a particular time period.
Custom fuel reports from the Marketplace
Beyond the reports included within MyGeotab, the Geotab Marketplace offers a variety of customised reports, including:
- Weekly Idle Cost Trend Report: Track idling costs over time with trend analysis, and monitor the effectiveness of efforts to reduce wasted fuel use.
- Average Fuel Economy Report: Visually display the fuel economy of your fleet, and assess at a glance your fuel economy performance.
- Last 3 Months Fuel Trend Report: Track fuel usage over a longer period to get a broader view of policy changes and efficiency improvements.
Visit the Marketplace to access these fuel tools and explore integrated Partner solutions for fuel management.
More strategies for improving fuel efficiency
Having the right tools can go a long way to improving overall performance. To help your fleet optimise fuel consumption, consider implementing these strategies:
Compare fuel usage trends for bigger fuel wins
When targeting fuel usage patterns, it pays to look at the bigger picture. Fleets should be asking:
- What have fuel consumption and idling trends looked like over the last three months?
- What are the trends for aggressive driving and miles driven?
If idling, speeding and mileage are reduced, then fuel consumption should decrease as well. This way, reviewing trend reports can help track patterns and identify anomalies or coaching opportunities.
Heather Carlton, Geotab Associate Vice President, Reseller Sales, explains that addressing factors such as aggressive driving, speeding and idling is a worthwhile effort. "Monitoring fuel usage is a good barometer of other programmes that you have in place", says Carlton.
Cross-referencing different metrics can provide greater insight and doesn't separate your data into silos. "It's a great idea to put all your fuel-related reports side-by-side on the dashboard", Carlton advises.
By watching these trend lines, fleets can also tell whether their programmes are working or need fine-tuning. If you see fuel usage staying flat or increasing, it is an indicator that it's time to review and adjust the programme.
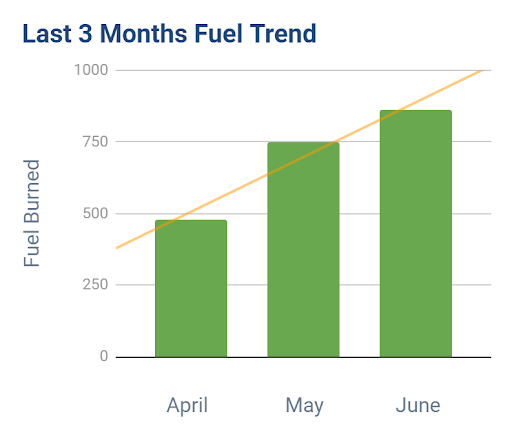
A sample graph showing a trend line for fuel burnt over a period of three months.
Monitor your fleet's miles driven statistics
Another important factor to consider is miles driven. Carlton recommends evaluating whether drivers are taking the most efficient routes, or if the fleet is dispatching the most efficient drivers to service calls. MyGeotab is ideal for managing miles driven as it provides full visibility into mileage, routes taken and drive time.
Optimising routes and reducing miles driven can lead to more customer visits per day. "Helping businesses maximise their productivity, use that time on the road to make money instead of spending money — that's what we want to achieve", says Carlton.
How does Geotab capture fuel data?
Information is broadcast through the electronic control module (ECM) for some vehicles, while others require a request for data. In some cases, fuel must be calculated on our end using other diagnostics like mass airflow. This all depends on the protocol in place.
Engine protocol refers to the language "spoken" by the vehicle's engine computer module. Protocol is dependent on the vehicle's make, model and/or year.
The three main protocols used industry-wide that we support are:
In vehicles with different protocols, we look at each one on a case-by-case basis, and use debug data to identify how to capture the fuel data and correctly report it. The accuracy with which we record fuel varies from 0.001 L to 0.5 L, depending on the protocol and how the engine broadcasts this information. For most vehicles, we are able to pull different types of diagnostics like trip, idle fuel used, fuel level, water in fuel and more.
How do we match fuel card data?
To match a fuel transaction to a device, there must be at least one matching reference field from the below list:
- VIN
- Device serial number
- Licence plate number
- Device description
- Device name
- Comments
Fuel transactions that cannot be matched to the telematics data are highlighted in yellow.
Importing fuel card data into MyGeotab
MyGeotab accommodates any fuel transaction data, as long as it is in .csv or .xls file format. Fuel card importing is not tied to any specific manufacturer. Fuel transactions can be imported into your MyGeotab database via the Fuel Transaction Import Add-In or by using the API.
For more details on these procedures, please refer to the Geotab Product Guide.
Ongoing developments in fuel usage tracking
Geotab is continuously working on fuel data output to optimise accuracy and support for vehicles. Currently, we are working on improvements that include:
- Additional data to help support and develop calculations for non-petroleum vehicles when standard sources are not available (ethanol, diesel).
- Routine firmware updates that contain fuel bug fixes and improved fuel calculations.
Future developments include:
- Constant monitoring of fuel data from the Geotab GO device.
- Continuous investigation of devices that fail to report fuel data so that support can be added. Future requests are encouraged to help improve Geotab's fuel support.
What's next?
If you are looking for ways to cut costs, fuel consumption is one of the top areas to target. Geotab Regulatory, Pro and ProPlus users have access to some powerful features right in MyGeotab for reducing their fuel spend. Money saved on fuel can be redirected to more valuable business areas, such as product development, operations, and human resources or training.
As Geotab leads the way in telematics, we strive to support as many vehicles as we can for all types of engine data. As we continuously keep testing, our vehicle support will increase and the data will continue to become more accurate. From the Analytics Lab to the EVSA, Geotab is working to lead the way in telematics support and experimentation.
To get more out of your fleet's fuel, visit our Fuel Management page on the Geotab Marketplace or book a demo with a Geotab expert today.
Subscribe to the Geotab Blog
The Geotab Team write about company news.
Related posts

Fleet management tools for SMEs: scale and stay UK compliant
July 15, 2026
2 minute read
2026 Sustainability roadmap: fleet electrification & European CO2 rules
July 15, 2026
3 minute read


How predictive maintenance reduces downtime and costs for large fleets
June 23, 2026
4 minute read