How the curve algorithm for GPS logging works
Curve logging is Geotab’s patented method of moving data efficiently from vehicle to server.

By Neil Cawse
Aug 27, 2024

Every single day your vehicle is generating gigabytes of data — about speed, distance, oil temperature, pressure, and more. Every measurement of every sensor in the vehicle and what’s happening in the vehicle is being made available in real-time. The challenge for a telematics provider like us is how do we get the rich set of data that your vehicle generates back to the servers where we can analyze it? We do this with GPS logging.
The method of GPS logging used is important because it strongly determines the quality and accuracy of the data, which in turn affects fleet performance. Geotab uses the curve logging approach.
What is curve logging?
Curve logging is Geotab’s patented method of moving data efficiently from vehicle to server. We use the curve-based algorithm (which uses the Ramer-Douglas-Peucker algorithm) in our firmware to determine which of the data points should be saved and transmitted to MyGeotab. The purpose of the algorithm is to identify useless points and discard them, while preserving the most important information.
Watch the YouTube white board video explaining how the curve algorithm for GPS logging works.
Why curve-based logic for GPS logging is better
The curve logging algorithm allows the GO device to keep only the points necessary to give a representation of the data that is as accurate as possible, as dictated by the predetermined allowable margin of error. This logic allows for Geotab to retain the most detailed telematics data with the least amount of data overhead.
Curve logging is incredibly efficient in comparison to the alternative methods of time-based transmission or distance-based transmission which miss critical information about the vehicle such as important high or low values for speed and cornering.
Other methods for GPS logging could produce inaccurate mileage, miss serious infractions, or result in poor display on the map. As well, logging redundant information leads to higher data costs. All this can be avoided through curve logging.
How curve logging works
Imagine you’re driving a vehicle. You drive down the road, arrive at a T-turn junction, turn left, then turn right. Each second you are travelling is a different GPS point.
If you sent all of that data to the server, it would get completely overwhelmed. Therefore, you need to decide on a method of logging the GPS points.
One approach to GPS logging is to sample the data at a “ping” rate of every 30 seconds or 1 minute, or sample once every 100 yards (over 90 meters). The problem with this method is that you miss a lot of information. If you connect the GPS points afterwards to make a path, it would look like the vehicle drove straight through a building. The distance calculated is completely wrong, and much shorter than what the actual distance was.
Geotab uses a different approach, the curve logic algorithm. It keeps checking the points of maximum error. If the difference between the predicted and actual position is significant, the points are sent, if the difference is small, they aren’t. As a result, instead of sending through a hundred points on position, we've broken it down into one, two, three, four points that we need to send. We've thrown away the points that, essentially, were not carrying any useful information.
The comparison below shows the result after the curve logging algorithm is applied to the data. As you can see in the image, even though the curve algorithm removed some of the points, the second graph still carries all the important information.
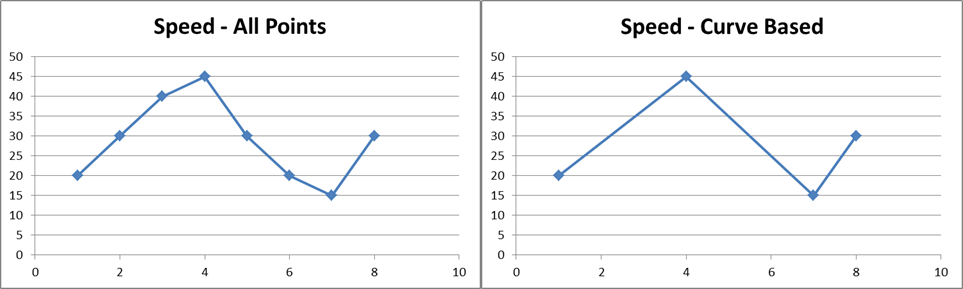
Vehicle speed — All points vs. curve-based approach
In addition to GPS, Geotab applies the curve logic to speed, capturing a much more accurate representation of the speed curve. We get the minimum and maximum speeds and how long the driver was above the speed limit, which is critical data for the fleet manager.
Then we took it a step further and said, “What if we applied that same logic to everything that we do in the vehicle?"
The curved algorithm gets applied to everything that we can measure in the system, such as oil pressure, oil temperature, battery voltage, and even seat belt utilisation.
We also use the algorithm for accelerometer, sending through acceleration on the x, y, and z planes, which is powerful for insurance companies who want to know exactly how hard a harsh braking event was for instance.
Intelligence for machine learning
Since Geotab sends the exact details through the curve logic to the server, we can run machine learning algorithms on that data. What could only be done by humans in the past, machines can now do, by recognising key patterns in the data, and thus finding hidden information.
For instance, a machine learning algorithm could recognise that you're discharging the battery because you left the lights on overnight. It could recognise ripples in the voltage curve that indicate that the starter motor is about to fail. It could even identify that your battery was about to fail within the next two weeks.
The way Geotab records data allows for unique and powerful applications that leverage Big Data and Machine Learning. The ability to predict the failure of a battery or alternator, can help cut the amount of downtime, and mean a big difference to the bottom line for a large fleet. People's lives can be saved by using this data to predict dangerous driving or unsafe road conditions. We are entering a new era, one where the world is made better by using data and machines.
Subscribe to the Geotab Blog
Neil Cawse is the Founder and CEO of Geotab, a global leader in connected vehicle and asset solutions, data intelligence and AI.
Table of contents
Subscribe to the Geotab Blog
Related posts


How predictive maintenance reduces downtime and costs for large fleets
June 23, 2026
4 minute read

Understanding OEM telematics and what it means for your fleet
June 19, 2026
3 minute read

AI video telematics: securing driver exoneration in Europe
June 18, 2026
2 minute read