Altitude by Geotab Data Reveals Average of 15% Efficiency Boost in NYC Congestion Zone
How Commercial Fleets Adapted to NYC Congestion Pricing After 12 months
March 18, 2026
•2 minute read

ATLANTA, GA — March 18, 2026 — Fifteen months after the implementation of New York City’s congestion pricing, new aggregate telematics data from Altitude by Geotab reveals that commercial fleets have undergone a notable operational shift. Rather than avoiding Lower Manhattan, operators have increased vehicle trip efficiency by an average of 15% to offset the costs of entering the zone.
Building on the foundational NYC commercial vehicle congestion report released in July 2025, this 12-month update compares movement patterns from early 2026 against pre-program 2024 baselines.
The analysis, which examined over 50,000 commercial vehicle trips, found that while the number of unique vehicles entering the zone increased by less than 2%, those vehicles are being used far more intensively. On average, daily trips within the zone per vehicle rose from 4.0 in 2024 to 4.6 in 2025.
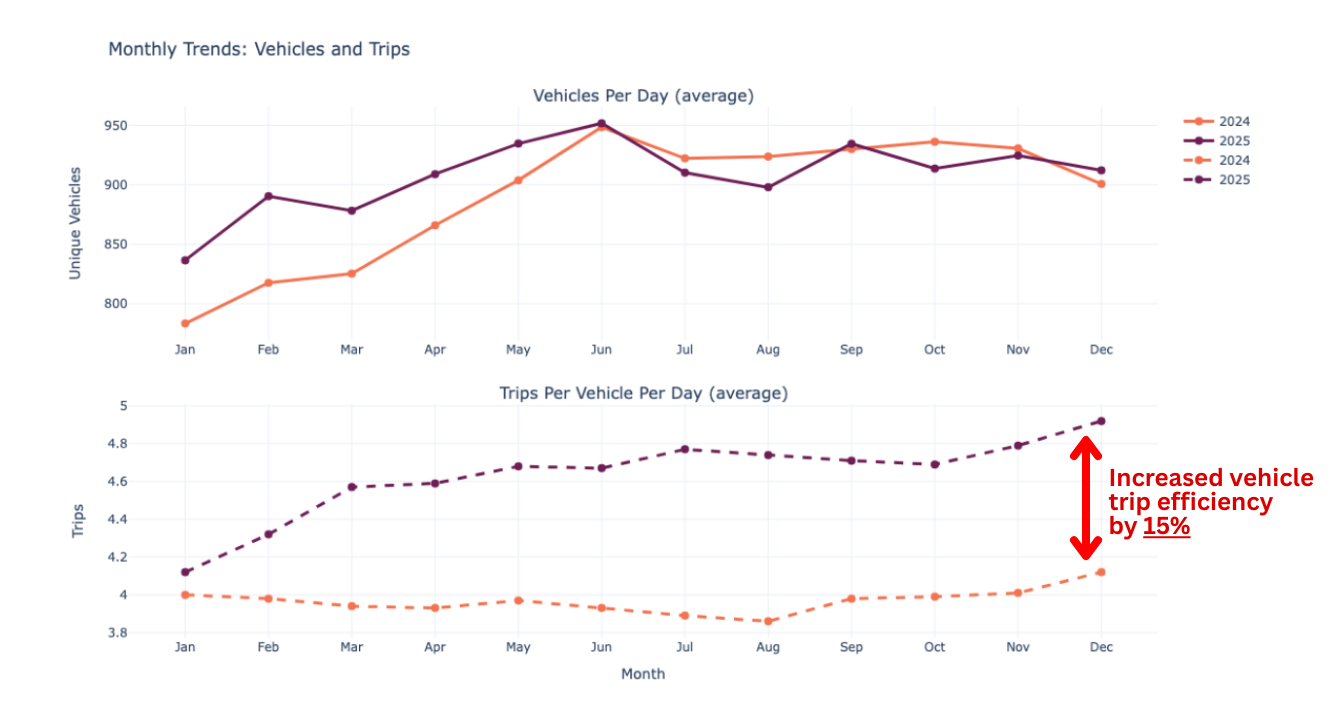
While only slightly more commercial vehicles are entering Manhattan after congestion pricing, each vehicle is making more trips within the congestion pricing zone than in 2024.
Key Findings Include:
- Local Traffic Improvements: 37% of roadways within the congestion zone experienced faster average speeds, with improvements noted in Little Italy, Chinatown, and the Lower East Side.
- The Idling Paradox: While commercial vehicles are idling less per trip, their total daily idle time had increased slightly because they are making more trips per day.
- From Heavy to Light Vehicle Types: During the first half of 2025, there was a notable decrease in medium and heavy-duty trucks entering the Manhattan Congestion Relief Zone, mirrored by an increase in Multi-Purpose Vehicles (MPVs). However, vehicle composition in the second half of 2025 returned to patterns similar to 2024, suggesting this shift was not permanent.
- Mixed Speed Results: Despite improvements in some corridors, 46% of roads showed no significant change in speed, and 16% actually became slower.
“What our data shows is a complex, data-driven adaptation by commercial fleets,” said Nate Veeh, AVP, Business Development, Altitude by Geotab. “They have adapted to absorb the congestion toll, maximizing trip intensity from around 4.0 to 4.6 daily trips per vehicle. However, this efficiency hasn't necessarily translated into permanent congestion relief. This suggests that while fleets are 'adapting' to absorb the congestion pricing, the policy has not yet achieved a permanent reduction in commercial congestion or idling emissions."
FAQS
How has NYC congestion pricing affected commercial travel times after 12 months?
Data from Altitude by Geotab shows that travel time improvements are notable; 37% of roadways in Lower Manhattan experienced fast moving speeds in 2025 compared to 2024, indicating that reduced gridlock for freight is a sustained trend.
Why hasn't vehicle idling decreased despite less traffic?
The analysis suggests that idling is an operational challenge rather than a traffic one. Even with clearer roads, commercial vehicles still spend significant time idling due to limited loading zone availability and the requirements of last-mile delivery.
Are fewer trucks entering the Manhattan Congestion Relief Zone?
Yes, but the trend has shifted. While there was an initial drop in large heavy-duty trucks in the first half of 2025, this trend did not hold for the full year. By the second half of 2025, vehicle composition had largely returned to 2024 patterns, suggesting fleets are still adapting rather than having made a permanent shift.
What can other cities learn from New York's congestion pricing program?
The key takeaway for cities like Los Angeles or San Francisco is that congestion pricing can improve gridlock but the impact on freight efficiency is nuanced. Fleets will adapt their vehicle types to find efficiencies. Policymakers however should also address loading zone management to reduce idling and environmental impact.
How does Altitude by Geotab analyze this traffic data?
Altitude by Geotab leverages aggregate, anonymized telematics data from over 50,000 commercial vehicle trips. By comparing 2025 and 2026 movement patterns against pre-program 2024 baselines, it provides an aggregate view of how urban freight evolves under new tolling policies.
For more information, visit:
https://altitude.geotab.com/news-and-releases/nyc-congestion-pricing-2026-update/
About Altitude by Geotab
Altitude by Geotab is a leading provider of advanced mobility insights and solutions for public and commercial sectors across North America. Headquartered in Oakville, Ontario, the company leverages its expertise in data analytics to help decision-makers gain a comprehensive understanding of road network movements. By delivering reliable and contextualized insights, it enables improved planning capabilities and better financial outcomes, while prioritizing data confidentiality and privacy. Our solutions drive safer, more efficient and sustainable mobility throughout North America. Learn more at altitude.geotab.com and follow us on LinkedIn.
Media Contact
Nicole Riddle
Media Relations Manager
pr@geotab.com
About Geotab
Geotab is a global leader in connected vehicle and asset management solutions, with headquarters in Oakville, Ontario and Atlanta, Georgia. Our mission is to make the world safer, more efficient, and sustainable. We leverage advanced data analytics and AI to transform fleet performance and operations, reducing cost and driving efficiency. Backed by top data scientists and engineers, we serve approximately 100,000 global customers, processing 100 billion data points daily from more than 5 million vehicle subscriptions. Geotab is trusted by Fortune 500 organizations, mid-sized fleets, and the largest public sector fleets in the world, including the US Federal government. Committed to data security and privacy, we hold FIPS 140-3 and FedRAMP authorizations. Our open platform, ecosystem of outstanding partners, and Geotab Marketplace deliver hundreds of fleet-ready third-party solutions. This year, we're celebrating 25 years of innovation. Learn more at www.geotab.com and follow us on LinkedIn or visit Geotab News and Views.
GEOTAB and GEOTAB MARKETPLACE are registered trademarks of Geotab Inc. in Canada, the United States and/or other countries.
Geotab in the News
March 25, 2026
March 25, 2026
March 19, 2026
March 18, 2026
Related News

Cargo Theft Firmly in the Cyber Era as Losses Exceed 6 Billion, Geotab Warns
March 19, 2026
2 minute read
Geotab Launches ‘Geotab Build’ to Unify Mixed-Fleet Management for the Construction Industry
March 3, 2026
1 minute read
Geotab data shows collisions down by over a third in North America over the last five years
February 26, 2026
2 minute read