The Invisible Bottleneck: Solving Geotab’s 100% CPU Crisis
How Geotab's engineering team moved from educated guesswork to kernel-level visibility to permanently silence a catastrophic CPU performance issue.

By Serge Pavlov
May 5, 2026
%20(1).png)
Key Insights
- When CPU is fully saturated, standard .NET diagnostic tools stop working — kernel-level profiling tools like perf are the only way to capture useful data during an active incident
- A lock contention issue caused hundreds of threads to compete for CPU, creating a self-reinforcing cycle that pinned usage at 100% and made the service completely unresponsive
- The fix was simpler than the diagnosis — disabling a single non-essential component broke the feedback loop and eliminated the weekly incidents entirely
The Invisible Bottleneck: Solving Geotab’s 100% CPU Crisis
The complex investigation that moved from educated guesswork to high-resolution visibility, and finally silenced a catastrophic performance vampire.
Last year, a highly evasive, persistent technical ghost haunted our engineering team. This complex, deep-dive investigation forced us to push past the limits of standard .NET diagnostics, build a custom Linux workflow, and ultimately expose a catastrophic concurrency fault buried deep within our environment. This is the story of how we moved from educated guesswork to high-resolution visibility, and finally silenced a catastrophic performance vampire.
The High CPU Misery
The symptoms were as consistent as they were destructive. Our Grafana dashboards showed a familiar death spiral:
CPU Usage: The “Total CPU” metric would abruptly spike and stay pinned at a flat 100%, leaving no time slices for the OS, application, or even diagnostics.
- Thread Count: Thread count would surge linearly from ~100 to over 2,000 per container.
Total Unresponsiveness: Once saturated, the service would become completely unresponsive—no requests, no heartbeats—requiring a manual restart.
![CPU Usage By Container]()
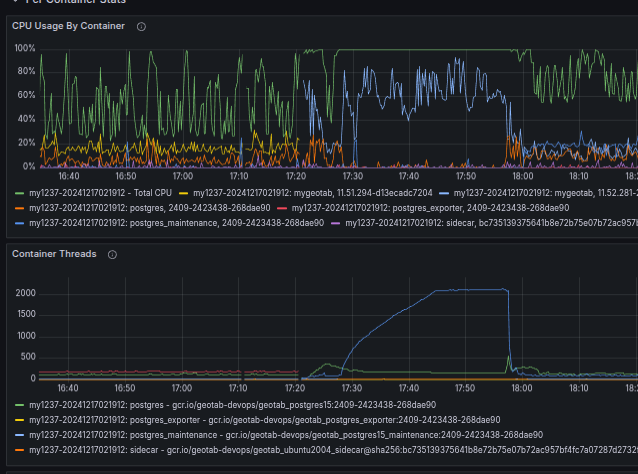
These repeatable symptoms pointed toward a synchronization or starvation issue immune to traditional application-level visibility.
Why Standard Tools Failed
Our first instinct was to reach for the standard .NET diagnostics toolkit: dotnet-dump, dotnet-trace, and similar tools. We configured triggers to capture snapshots during incidents, but they failed every single time.
The Reason: These tools rely on the .NET Diagnostics Server (Microsoft Learn, Diagnostic Ports), which communicates via a Unix Domain Socket.
- IPC mechanism: The Diagnostics Server opens a Unix Domain Socket (e.g., /tmp/dotnet-diagnostic-{pid}-socket).
- The Handshake: Tools like dotnet-trace connect to that socket to send commands.
- Scheduler starvation: The Diagnostics Server thread was runnable but never scheduled long enough to complete a request.
Essentially, we were trying to send a mayday call into a process with no free CPU cycles left to answer.
The Best Guess Era
Faced with a lack of hard data and an invisible enemy, we entered the Best Guess Era. Without the ability to see the Chicken (the root cause), we focused on the Egg (the symptoms), attempting to stabilize the system through broad architectural and configuration changes. Our main hypotheses centered on avoiding runaway ThreadPool growth and improving resiliency under load:
- Asynchronous Refactoring: Eliminating sync-over-async (.Result, .Wait()) to prevent ThreadPool starvation (MSDN Magazine, “Async/Await Best Practices” 2013, Microsoft Learn, “Debug ThreadPool starvation” modern guidance).
- ThreadPool Constraints: Lowering minimum worker threads via ThreadPool.SetMinThreads. We reduced the base thread count to control early oversubscription, while leaving the maximum at the default to allow the runtime hill-climber to inject additional threads only when beneficial. (Matt Warren, “The CLR Thread Pool 'Thread Injection' Algorithm” blog)
- Infrastructure Upgrades: Migrating from dedicated E2 CPU instances to dedicated N2 CPU instances on Google Cloud improved performance stability, reduced sensitivity to noisy neighbors, and provided more predictable scheduling under high load. (Google Cloud, N2 machine types).
While these efforts reduced the incident rate by 3x, the remaining 10 weekly spikes proved these were symptoms, not the root cause. To get real answers, we needed to abandon application-level tooling and go deeper—into the kernel.
The Breakthrough: Finding the Kernel
The turning point arrived when we turned to perfcollect, Microsoft’s wrapper script that orchestrates native Linux perf alongside .NET-specific event collection via LTTng. (Microsoft Learn, Trace .NET applications with PerfCollect). A single trace produced the first major clue: Kernel Scheduler Thrashing.
The data showed that most sampled CPU activity was inside do_sched_yield—the function that is entered when threads voluntarily yield CPU time (Linux Docs, sched_yield()). This pattern was a classic signature of oversubscription: hundreds of runnable threads repeatedly yielding instead of making progress. The CPU was effectively spending most of its time trying to decide which thread should run next, rather than running application code.
.png)
With this insight, we abandoned heuristics and switched to reproduction and artifact collection.
The Container Gap and the Python Translator
Having identified that the problem was kernel-level thrashing, we needed to see which C# code was responsible. Unfortunately, perfcollect could not resolve managed symbols during incidents for two reasons:
- Push-Based Metadata Fails Under CPU Saturation: The metadata channel used by perfcollect relies on LTTng events emitted by the CoreCLR runtime to describe JIT-compiled methods. These events must be flushed by dedicated runtime threads (Microsoft Learn, EventPipe). Under full CPU saturation, those threads were runnable but rarely scheduled, so symbol metadata never flushed. Sampling still worked—but frames appeared as [unknown].
- Containers Complicate Symbol Discovery: Inside a Docker container, the .NET process often appears as PID 1, while the host sees a completely different PID. perf always uses Host PIDs. Furthermore, JIT code is emitted into a memfd that is immediately unlinked for security, causing it to appear as (deleted) to the kernel. As a result, perf saw only anonymous executable memory with no associated file, making symbol resolution impossible.
The Solution: A Brute-Force Translator
To bypass the broken push-based metadata channel, we switched to perf: it works under saturation because it is a kernel-driven, interrupt-based sampling profiler.
Diagnostic Workflow
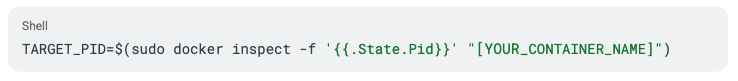
Identify the Target: Find the Host PID of the containerized process
![Identify the Target]()
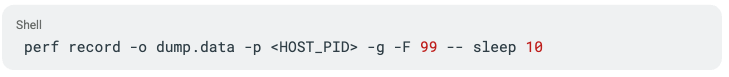
Capture Raw Data: Use native perf record to capture hardware cycles even during full saturation
![Capture Raw Data]()
- Extract the Map: Copy the JIT map (/tmp/perf-1.map) directly from the container's filesystem
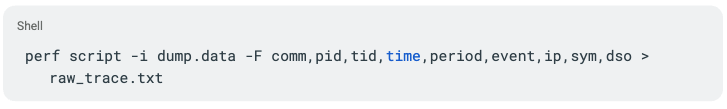
Generate Raw Trace: Convert the binary data to text with perf script
![Generate Raw Trace]()
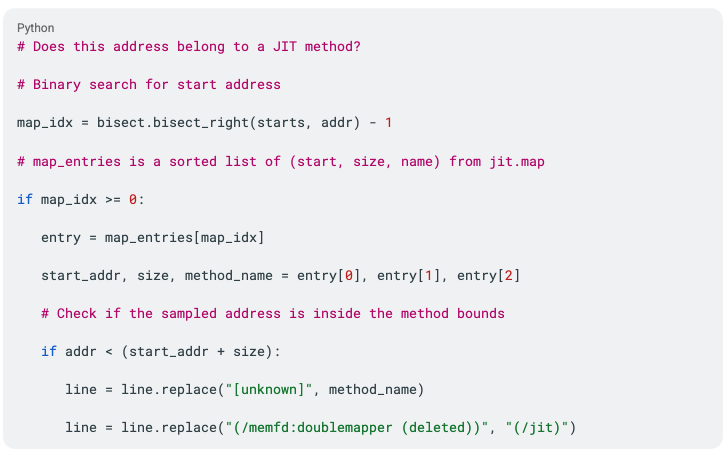
- Translate Symbols: Run a Python script that matches raw sampled hex addresses to JIT method ranges. When the script hits an [unknown]frame, it performs a "fuzzy" lookup in the map file to unmask the real method name
- Analyze: View the final trace in the Firefox Profiler or PerfView
We automated the entire data collection and symbol unmasking process into a single automated workflow (perf-trace-collector demo).
Essential Mapping Logic
The translator uses a simple but reliable principle: Raw sampled addresses are matched against method ranges recorded in the JIT map (Microsoft Learn, Export perf maps and jit dumps). This bypasses the missing metadata entirely:
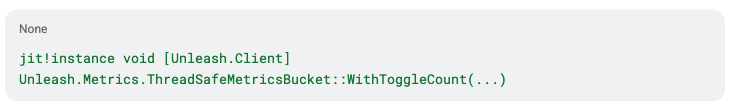
The Unmasking
After processing the trace through our translator, the opaque red [unknown] rectangle finally dissolved and revealed:
.png)
This pointed directly at a 3rd party Open Source library’s ReaderWriterLockSlim (RWLS) usage (GitHub, source code reference).
The Lock Convoy
Under light contention, RWLS is a writer-preference lock with reader starvation as the primarily known risk (GeeksforGeeks, “Readers-Writers Problem | Writers Preference Solution”).
However, in our production failure RWLS exhibited an unusual feedback behavior: the writer that was not logically starved by readers became scheduler-starved while successfully holding the write lock. It simply could not run long enough to complete its critical section (CPU-heavy JSON serialization), while hundreds of reader threads repeatedly entered RWLS’s spin-wait path. Each of those readers issued frequent sched_yield()calls, creating a "yield storm" that saturated the CPU scheduler.
Below is the technical breakdown illustrating the physical stages of the Lock Convoy Process where the operating system’s scheduler defeats the RWLS‘s priority, turning the lock into a self-reinforcing collapse. Starved readers starved the writer, and the starved writer choked all readers:
- Request burst
- Cold Block
Readers hit RWLS while the writer is pending/active; they block or spin. - The threadpool saturation
Blocked readers slow throughput; hill-climber injects threads to improve throughput. - Hot Thrashing
>1000 runnable threads spin in RWLS spin-wait loops, invoking yields. - Kernel yield storm
CPU time is spent in do_sched_yield. - Writer Starvation and collapse
The writer holds the write lock but is scheduler-starved, creating a self-reinforcing collapse that forces more readers to hit the lock and ensures the system remains pinned at 100% CPU.
Breaking the Convoy
We disabled the single writer component responsible for triggering the write lock as non-essential for the software functionality. With the writer removed, readers could proceed unimpeded, the feedback loop stopped, and the kernel thrashing ceased. We removed the root cause and eliminated our weekly incidents entirely.
The elusive ghost finally stayed dead.
Engineering Takeaways
- Prefer external, kernel-driven Diagnostics: Application-level tools fail when the runtime is pinned. Infrastructure tools like perf continue working because sampling is hardware interrupt-driven and requires no cooperation from the runtime.
- Account for Container Isolation: Containers introduce namespaces that break traditional PID and filesystem assumptions. Reliable diagnostics must reconcile host/container boundaries dynamically.
- Don't Fear the Hex: [unknown] frames usually indicate missing metadata—not mystery code. Pull JIT maps and reconstruct traces manually when high-level visualizers fail.
- Understand Runtime Behavior: ThreadPool hill-climbing can worsen CPU-bound lock contention.
- Use Lock-Free Structures for Hot Paths: RWLS degrades sharply when hundreds of threads compete. For bursty write patterns, these should be avoided in favor of lock-free structures.
- Enforce Feature Flag Discipline: Treat feature flags as slow-moving state; avoid high-frequency global mutations.
Subscribe to get industry tips and insights
Serge Pavlov is a Distinguished Software Developer for Geotab.
Table of Contents
Subscribe to get industry tips and insights
Related posts


.jpg)
From the Flight Line to the Bottom Line: How James brings military precision to Geotab
November 27, 2025
1 minute read
.jpg)
The Long Road Home: How a Veteran’s Resilience Redefined His Mission at Geotab
November 25, 2025
2 minute read
.jpg)
Teamwork, Tenacity, and the Flying Disc: Jodie Rochemont on Ultimate Strategy and Resilience
October 30, 2025
2 minute read

The Power of Storytelling: Felipe Hoffa's Impact on Geotab's Data and AI
October 20, 2025
1 minute read