U.S. Supply Chain Report
High volume & value coverage: Trucks haul 72% of the nation's products value and 65% of its tonnage, making freight metrics a critical lens for supply chain movements.
Early economics indicator: Transportation data reveals subtle supply chain shifts weeks or months before they show up in invoices or cost data.
%201.png)
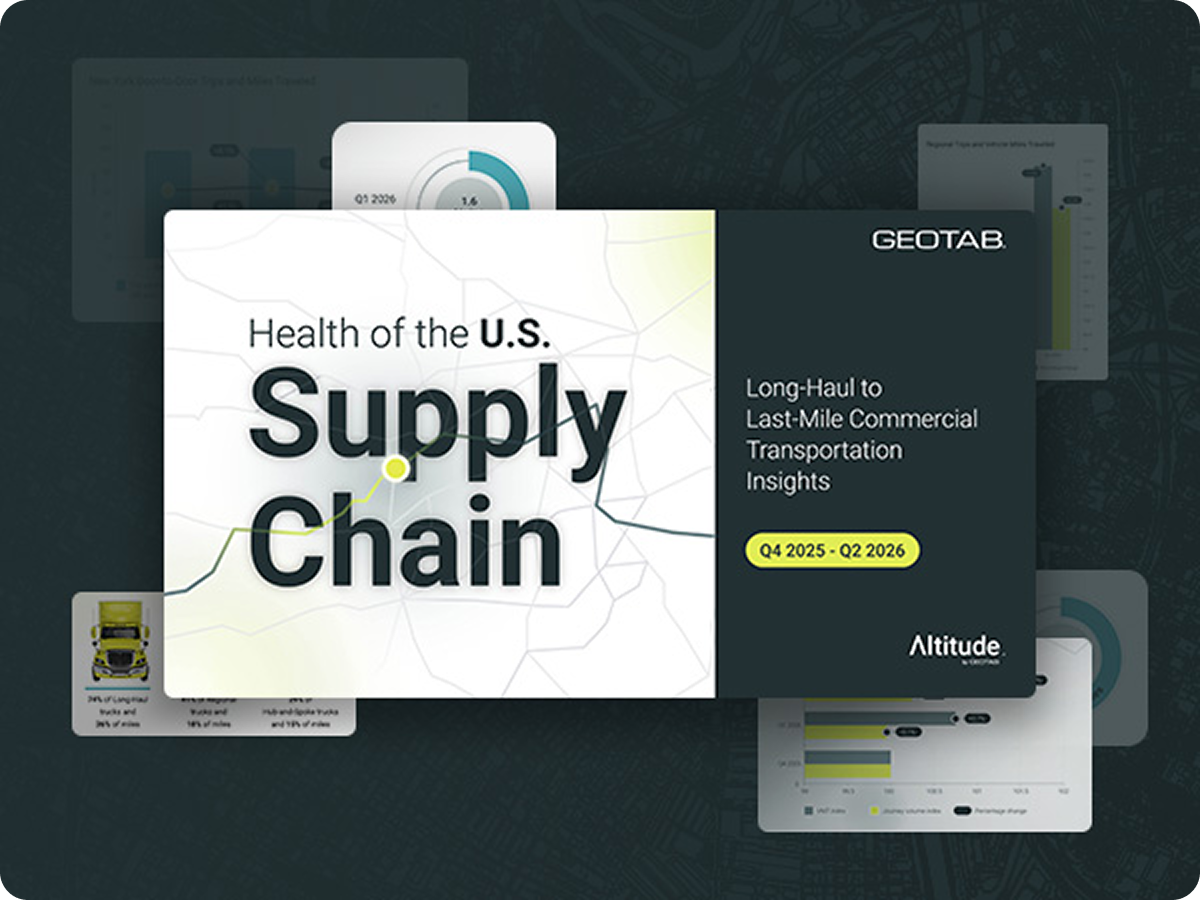
Health of the U.S. Supply Chain
Our analysis alongside Altitude by Geotab establishes indexed values capturing real-world freight activity for Q4 2025 - Q2 2026 including trip volume, mileage, vehicle utilization rates and more for drayage, long-haul, regional, hub-and-spoke and last-mile trips.
What is the Health of the U.S. Supply Chain Report?
It's an analysis from Geotab and Altitude by Geotab that uses observed commercial vehicle movement across the U.S. to reveal real-world supply chain trends using volume, utilization and efficiency metrics. Because truck activity shifts weeks or months before it shows up in invoices or economic data, the report surfaces early signals of change.
What data is this report based on?
The report draws on aggregated and anonymized telematics data from Geotab's connected fleet, covering roughly 12% of all U.S. commercial vehicle traffic. It analyzes five freight vocations: drayage, long-haul, regional, hub-and-spoke and door-to-door. The analysis focuses on commercial vehicle movement rather than individual drivers, vehicles, or companies.
What time period and locations does the report cover?
It covers Q4 2025 through Q2 2026 nationally, with a closer look at four major interstate corridors (I-10, I-35, I-80/90, I-95) and four representative cities: New York, Los Angeles, Denver and Atlanta.
What's the key takeaway from this report?
The analysis suggests that the supply chain absorbed new demand and disruptions — geopolitical policy shifts, shipping delays, driver shortages — largely through efficiency gains rather than added capacity. That optimization created stability, but it also means the network has less slack to handle a sudden surge in demand.
Where do I learn more about the U.S. Supply Chain Report?
Please email us at pr@geotab.com for inquires.