Boosting safety and efficiency: Ottawa's journey with data visualization
Custom integrations with Power BI enabled the City of Ottawa to achieve their data visualization goals. Read how they enhanced decision-making, reduced waste and improved fleet safety as a result.

Jul 24, 2025
.jpg)
Key Insights
- Improving fleet efficiency with data visualization: Discover how the City of Ottawa created a digestible way to process their data for sound decision-making
- Turning raw data into visual insights: Learn how an integration between Geotab’s telematics and Power BI’s data visualization tool helped the city track progress against their 7% idling reduction goal
Is your fleet drowning in data, but starved for insights?
If so, you’re not alone. Many government fleets face the challenge of transforming vast amounts of vehicle information into digestible, actionable insights. The City of Ottawa faced hurdles like these in their fleet operations and needed a way to make vehicle data easier to understand for all stakeholders. Managing a fleet of over 5,000 vehicles and pieces of equipment, including over 2,700 licensed on-road vehicles, Shawn Smithson, Section Manager of Fleet Information & Fuel Systems, wanted a simpler, visual-first format to analyze the large fleet’s data trends, as well as an effective way to manage visibility and reporting access for key stakeholders.
In this study, we’ll examine the City of Ottawa’s unique experiences with telematics and data visualization. We’ll show you:
- How the city’s journey with telematics and data visualization began
- The various dashboards that they tether new fleet strategies to
- Key lessons that you can apply to your own fleet
Data visualization: Fueling efficiency and safety in Ottawa
The City of Ottawa embarked on their telematics journey after recognizing that excessive idling was a problem in their fleet. They initially set a goal to reduce idling by 7%, with an ongoing 2% decrease year over year. These lofty goals required comprehensive vehicle data and led Smithson to pilot the Geotab solution with his team. However, once the city started collecting all the data their fleet had to offer, Smithson’s team began to notice other problems like unsafe driving behaviors in their fleet operations. Discovering these issues meant they were legally obligated to report and take action, as well as store the data for seven years.
Due to the evolving complexity of Ottawa’s operations and the increasing number of stakeholders, from unions to management to individual contributors, data visualization became necessary. This resulted in a custom integration between the Geotab platform and PowerBI developed by Northern Business Intelligence (NBI), their Geotab reseller, which leveraged Geotab’s open Application Programming Interface (API) and Software Development Kit (SDK). Through the integration, they could study data more easily in their Power BI environment and quickly pinpoint areas to improve.
Key data visualization dashboards: Enhancing fleet performance in Ottawa
The City of Ottawa relied on a suite of data visualization dashboards to drive significant improvements in fleet efficiency and safety. By using a three-step intake process to validate new reporting requests, they remained organized, with each new report designed to help accomplish specific goals for their fleet. The reports that Smithson and his team primarily use are:
- Vehicle idling reports
- Fleet safety scorecard reports
- Vehicle usage reports
- Parking analysis reports
- Driver license abstract overview reports
- DVIR compliance reports
We’ll do a deep dive into each of these reports and show you how the City of Ottawa is using them to transform their fleet in powerful ways.
Vehicle idling report
Ottawa's initial data visualization efforts targeted vehicle idling to align on strategic emissions priorities and reduce carbon emissions. The vehicle idling report (below) provides granular trends on idling duration, cost and fuel consumed. Crucially, CO2 emissions calculations are based on VIN decoder data, vehicle weight class and liter of engine, as opposed to previous reporting, which marked every unit as a three-liter and skewed the emissions calculations.
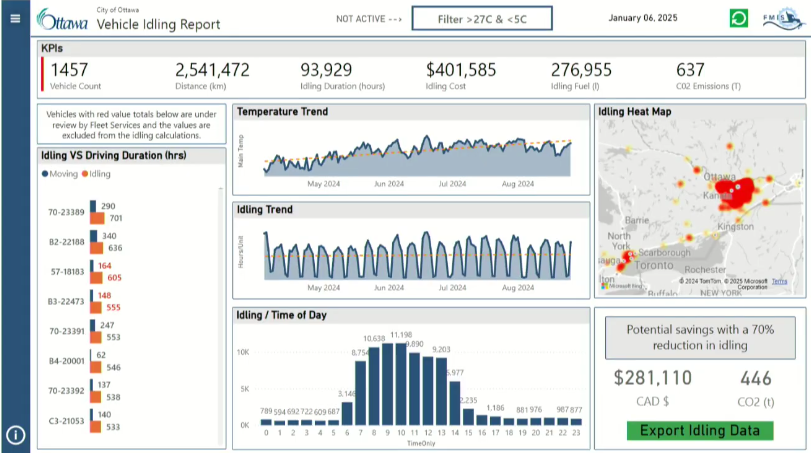
An example of the City of Ottawa’s vehicle idling report, with time of day, idling and temperature trends displayed in graph format for easy deciphering.
The city’s priorities around emissions also continued to evolve, from simply meeting percentage reductions to complying with new regulations. Their location-based idling report (below) was created in accordance with a new city bylaw that restricted vehicles from idling. By monitoring granular trends, Smithson and his team could pinpoint idling bylaw infractions and develop targeted interventions.
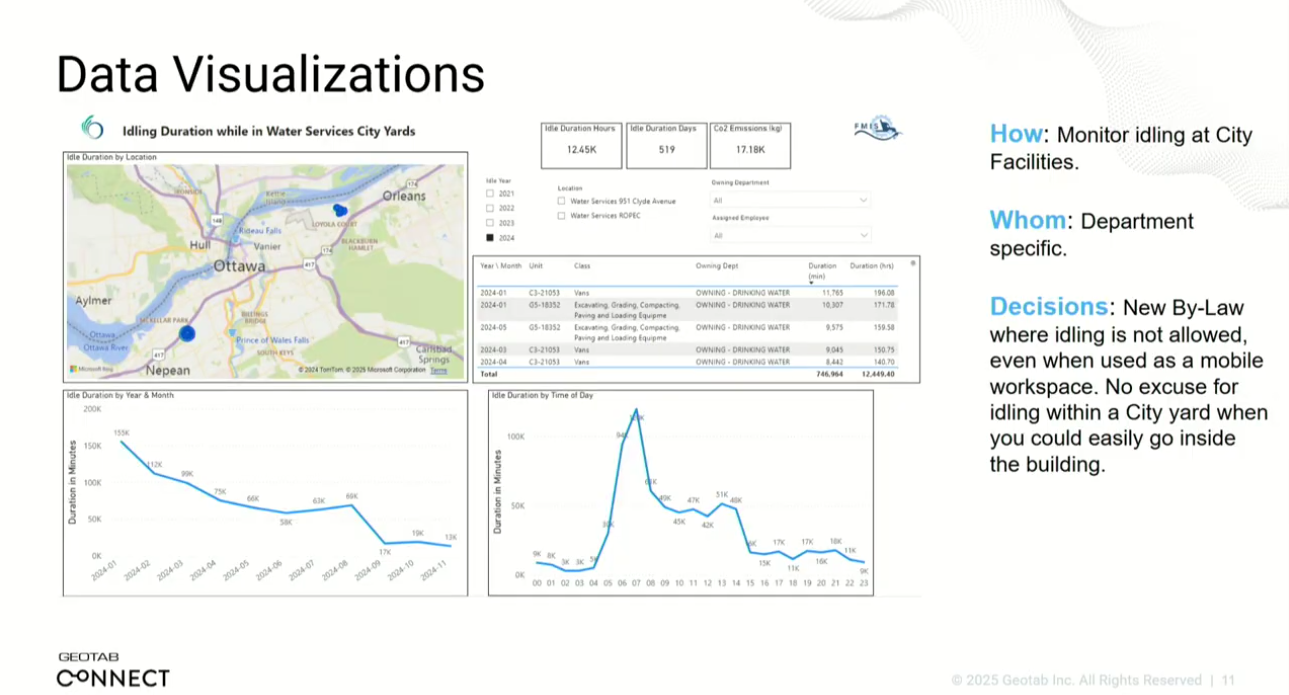
An example of the City of Ottawa’s idling duration report within city yards. The report helped Smithson’s team identify unproductive idling instances and limit them during daily operations.
Fleet safety scorecard report
To help proactively enhance driver safety, a fleet safety scorecard report was created that allowed the city to track the overall behavior of the fleet. By analyzing speeding, "stunt driving" (exceeding the speed limit by 40 km/h or more), harsh driving events and seatbelt usage exceptions, Ottawa was able to identify safety trends and where improvement was needed. Tracking stunt driving events and where they occurred was particularly effective for identifying unsafe behavior, allowing the city to immediately revoke authority to operate in these cases. Visualizing fleet safety scorecards helped them comply with union requirements, uphold their commitment to reporting safety issues and take quicker corrective action.
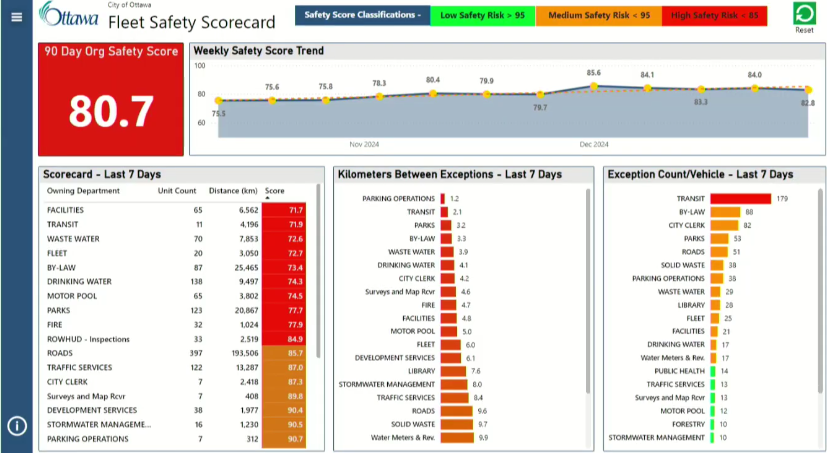
An example of the City of Ottawa’s fleet safety scorecard, which allowed them to easily assess high-level trends and pinpoint which of their departments had the highest numbers of safety events.
Vehicle usage report
To enhance resource allocation and determine which vehicles were truly needed in their fleet, Ottawa turned to low vehicle usage reports. They were able to review which vehicles were used least and look for opportunities to replace them with high-usage alternatives.
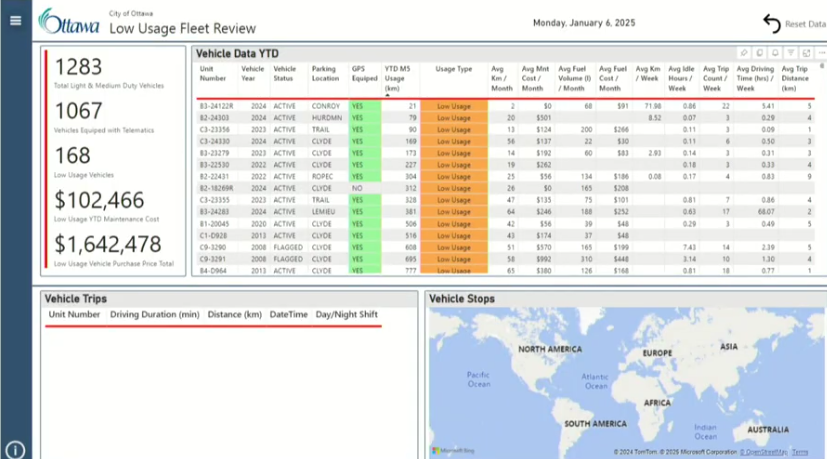
An example of Ottawa’s low usage report, with visualized potential savings. Vehicles registering fewer than 5,000 kilometers per year or less than 500 hours of drive time per year were considered low usage, requiring an explanation of why they were still needed in the fleet.
Parking analysis report
To help prevent unauthorized public vehicle usage, parking reports were instrumental. By seeing where city-owned vehicles were regularly being parked, Smithson and his team could more easily determine if they were being used by employees for personal use.
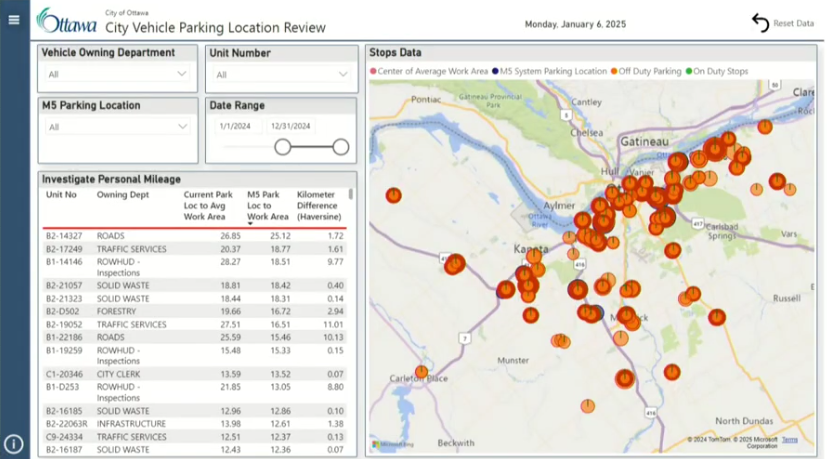
An example of the City of Ottawa’s parking location report, which helped them quickly visualize where parking outside of work boundaries was occurring.
Driver license abstract overview report
To further bolster their culture of fleet safety, Ottawa’s driver license abstract overview report provides insights into drivers, including demerit points, suspended licenses and other infractions. It pulls in relevant information by integrating with the Ministry of Transportation's database. Accumulating a certain number of demerit points requires a driver’s review, regardless of whether the infractions occurred in personal or work vehicles.
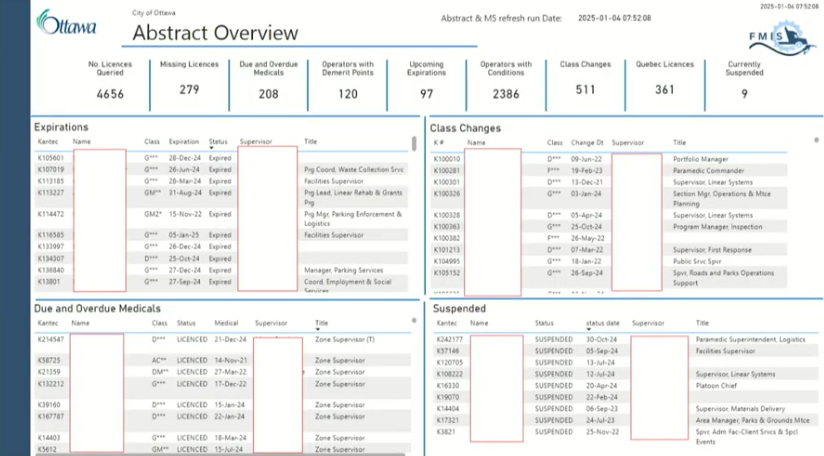
An example of the driver’s license abstract report generated for the City of Ottawa. This comprehensive report enabled the district to report on safety infractions and make sure their drivers were maintaining quality driving habits.
DVIR compliance report
To maintain compliance and monitor the total number of daily vehicle inspections its drivers complete through the Geotab Drive app, the city uses a detailed DVIR report. This visualization allows them to survey all their DVIR submissions and where they’ve been sent in from, identifying noncompliance and helping them stay on top of critical vehicle needs.
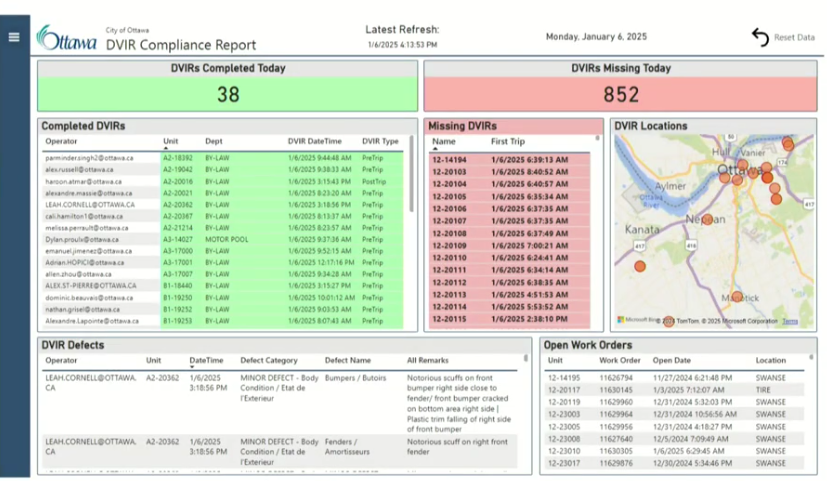
An example of the City of Ottawa’s at-a-glance DVIR reporting dashboard, which allows them to easily track total completed DVIRs and those that still need to be filled out.
Watch the webinar: See Smithson dive deeper into Ottawa’s data visualization strategies here.
Lessons learned: Overcoming roadblocks using scalable solutions and processes
The City of Ottawa's journey to comprehensive data visualization offers valuable lessons for government agencies of any size. Here are their key takeaways for success:
- Define your needs clearly - Before starting, list all your data visualization goals and the resources you’ll need to succeed. This upfront clarity and scope is key.
- Build a project intake process - Establish a repeatable process that helps you take on new data visualization requests. Start by evaluating project needs, determining resources needed and confirming stakeholder alignment.
- Verify data accuracy - Good decisions need good data. Set up a consistent method to clean your data and use tools that help you filter information easily.
- Make dashboards user-friendly - Create intuitive dashboards to simplify data filtering. Prioritize readability in your reporting to make deciphering trends easy for all stakeholders.
- Keep data secure - Control who sees sensitive information in your organization. Use tools that meet your security rules and always check that only authorized individuals can access reports.
- Document everything - Keep detailed records of your learnings and processes. This preserves valuable information, making sure critical insights aren't lost, even with employee turnover.
- Automate tasks - Cut down manual work and recordkeeping through automation. Use technology to simplify work in the right places.
As Smithson put it to his team, “We're automating these lesser tasks so you can focus on more important things.”
What does the future of government fleet management hold?
The City of Ottawa's success vividly illustrates the visual, insights-driven future of fleet management. Sound decision-making hinges on digestible data, and with data visualization and automation, agencies can readily uncover critical insights from vast quantities of information. A clear understanding of fleet trends empowers organizations to identify areas for driver improvement, ultimately reducing costs, enhancing service and improving driver safety.
[On-demand session] The City of Ottawa’s journey through data visualization
Want to hear more about the City of Ottawa's strategy to extract more value from their data? Watch the on-demand webinar.
Subscribe to get industry tips and insights
Frequently Asked Questions
Ultimately, studying data in a visual format can make it easier to process, helping you discern fleet trends faster. Once a pattern is identified, you can develop strategies and steps to solve the issues uncovered, whether they’re related to safety, fuel management or maintenance.
Geotab prides itself on being a partner, not just a vendor, working closely with our customers every step of the way. From your initial consultations to solutions implementation and beyond, we’re ready to be the telematics partner your agency can truly count on. If you ever have any questions about our fleet management platform, we additionally offer 24/7 technical support.
Content Marketing Manager at Geotab
Table of Contents
Subscribe to get industry tips and insights
Related posts

Beyond the hype: Real AI priorities for field service leaders
March 26, 2026
6 minute read
Unified data: The key to fleet liability reduction for government agencies
March 19, 2026
9 minute read

Building a proactive government fleet safety program with data and AI
March 9, 2026
5 minute read


The Simple Truth: Why Rewarding Safe Driving is Your Fleet’s Smartest Business Decision
February 25, 2026
4 minute read