How Geotab’s Predictive Safety Model helps fleets prevent collisions before they happen
Learn how Geotab’s Predictive Safety Model is helping fleets identify high-risk vehicles, prevent collisions, and improve safety using real-time data.
By Geotab Team
Nov 3, 2025

Key Insights
- Geotab’s Predictive Safety Model uses driving data and environmental factors to flag vehicles at highest risk of collision.
- Fleets can prioritize coaching and interventions proactively, before incidents occur.
- Validation across 1.98M vehicles shows the model reliably predicts collision risk in real-world fleet operations.
Collisions rarely happen without warning. Geotab's Predictive Safety Model picks up on those early signals, analyzing driver behavior, regional risks and collision data to flag which vehicles are most likely to be involved in an incident.
This is not hindsight. It is a forward-looking safety tool your team can rely on every day to target coaching, prioritize interventions, and prevent incidents before they happen.
How the model breaks down risk
Many fleets use scorecards to track driver performance. These tools typically rely on past events like speeding, hard braking or rapid acceleration to flag risky behavior. While helpful, they focus on what has already happened.
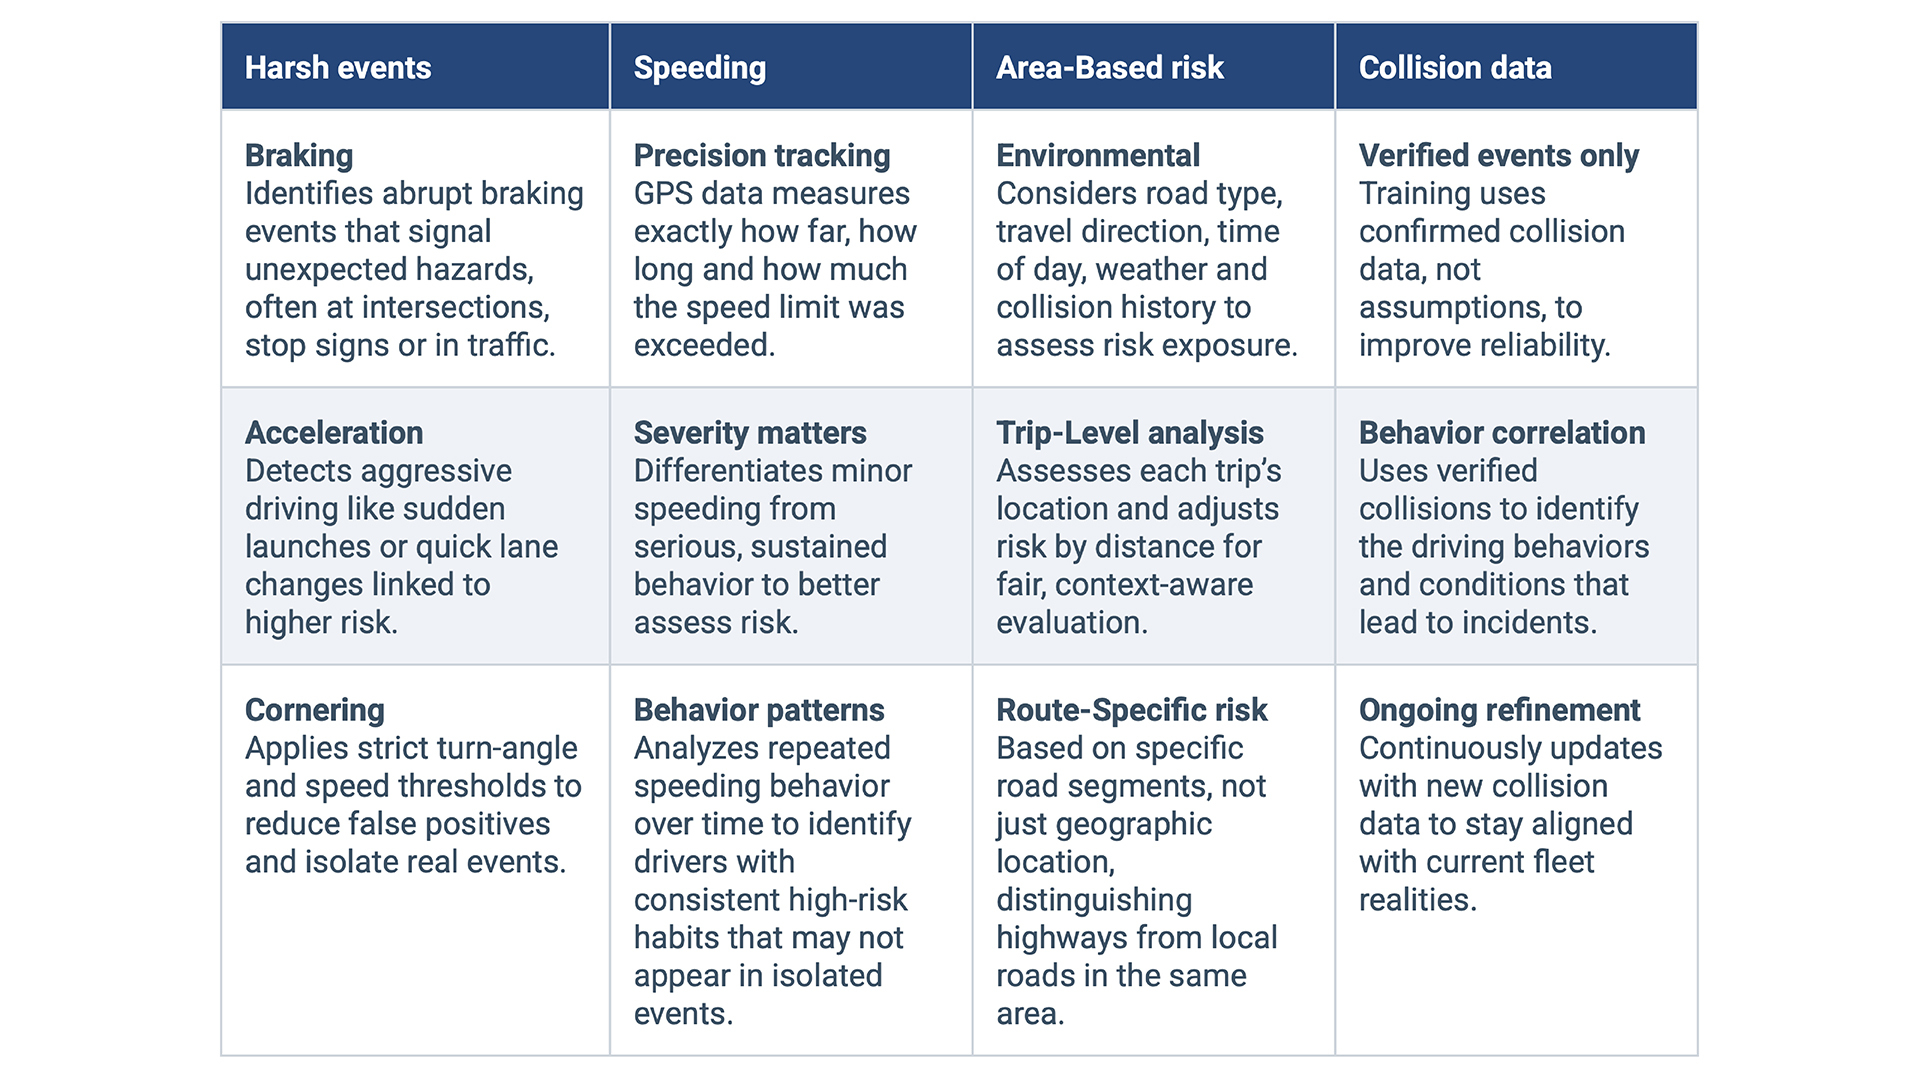
Geotab goes further, linking trip context and collision data to identify vehicles at higher risk before something happens. By factoring in road type, time of day, weather and collision history, the model evaluates each trip based on where and how it’s driven, giving fleets a clearer view of emerging risk, not just past behavior.
What sets the predictive model apart
Geotab’s advantage comes from its access to a large, diverse dataset collected from millions of connected vehicles across all vehicle types and regions. The model is trained and validated using detailed driving behavior, location-specific risk and confirmed collisions.
The model’s predictive strength comes from how it interprets and utilizes key risk indicators:
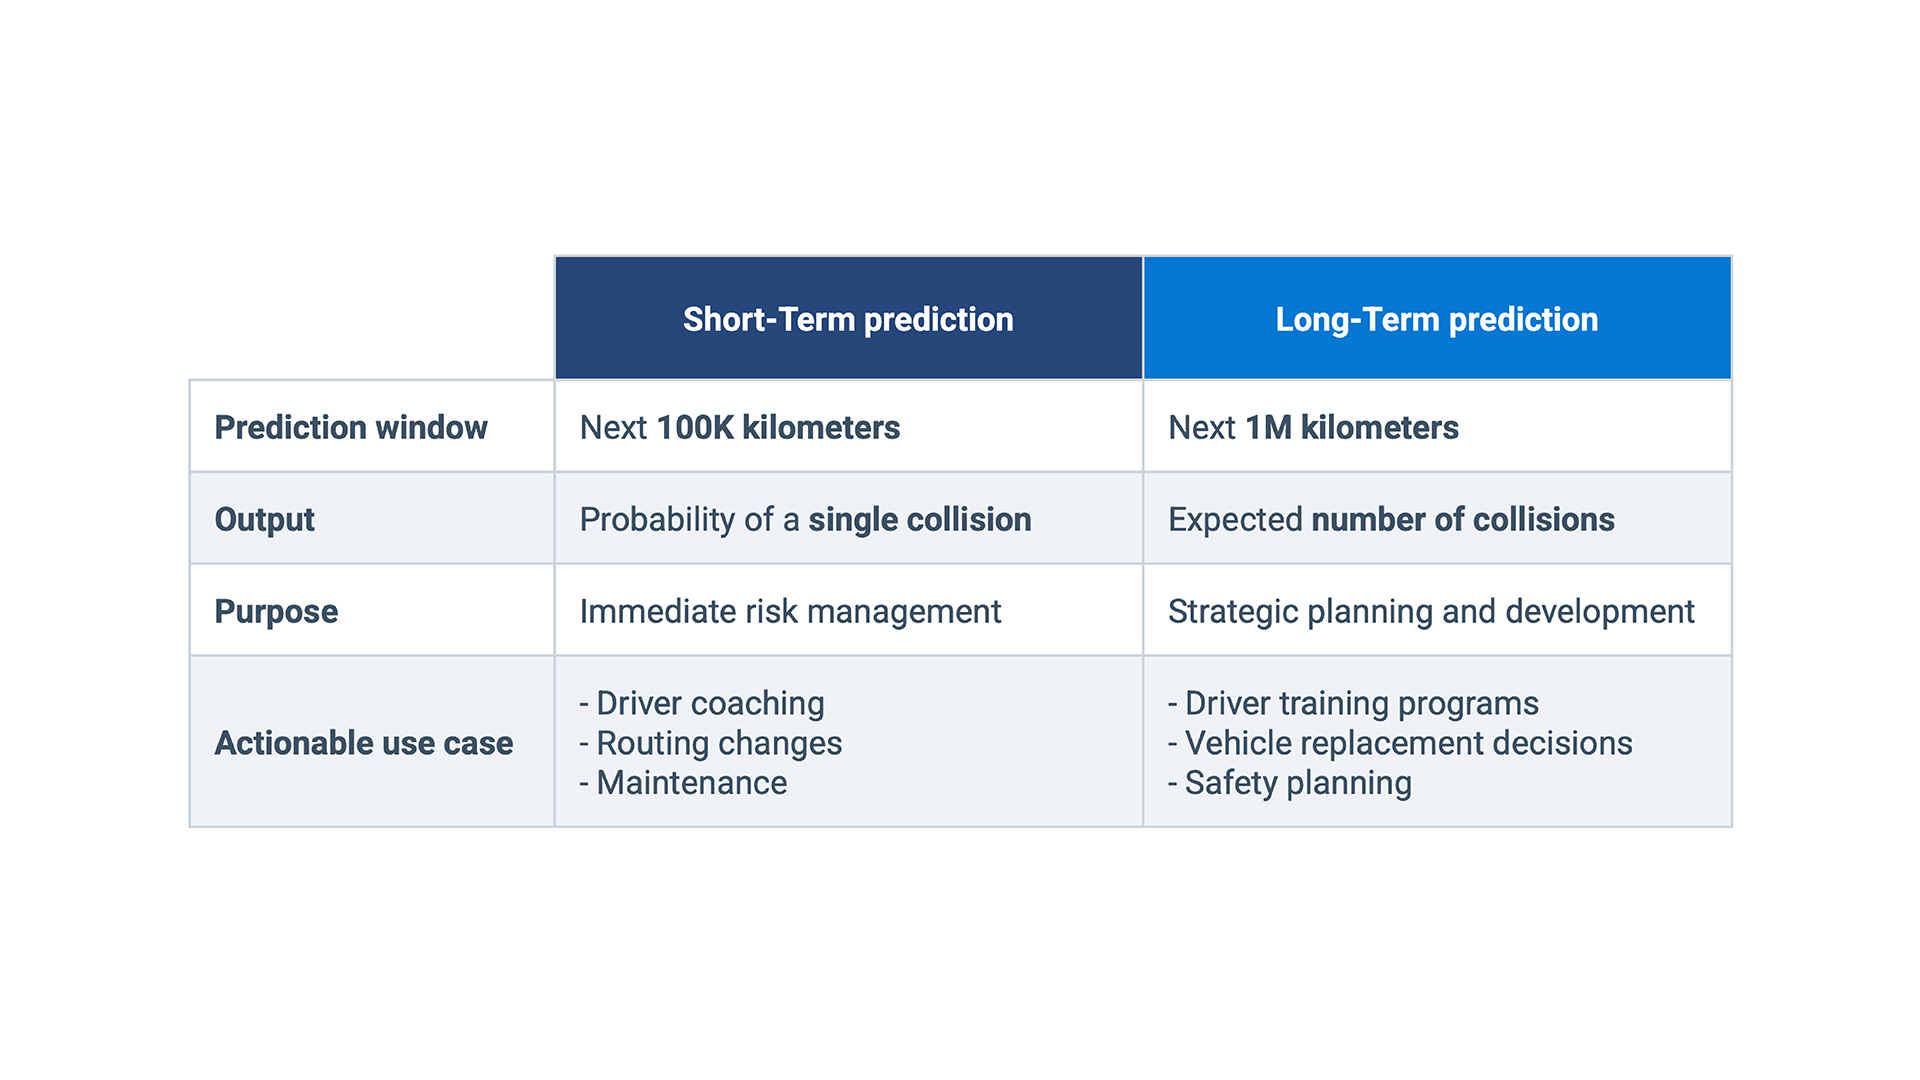
Predictive insights you can act on
Geotab’s Predictive Safety Model provides two clear, data-driven outputs that help you manage collision risk with precision. These predictions support both immediate safety actions and long-term planning.
Validating the predictive safety model’s accuracy
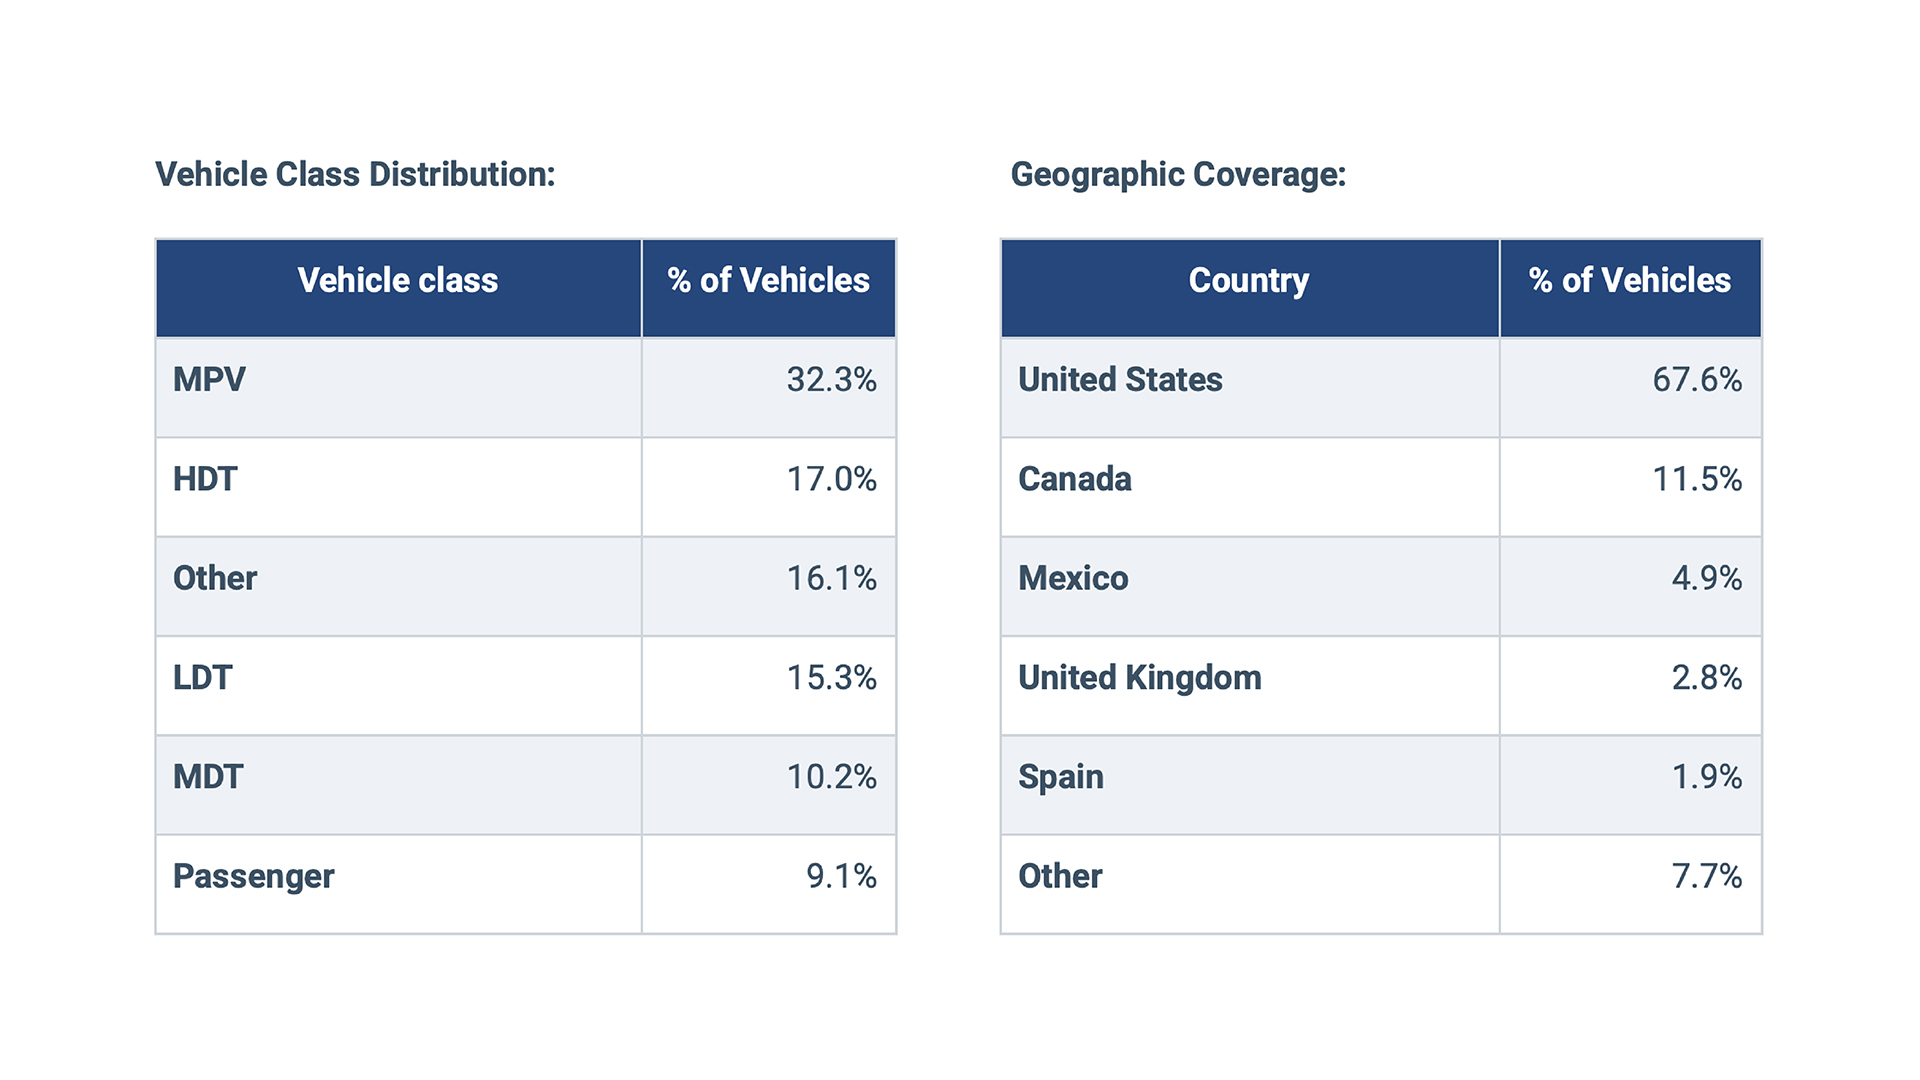
Tested across 1.98 million vehicles
We used driving data from 1.98 million vehicles, covering every major fleet type and region we serve. That scale means our predictions capture how drivers behave instead of what's expected in ideal conditions.
Step-by-step validation approach
With a strong dataset in place, we followed a structured process to evaluate the model’s predictive accuracy:
1. Predicted vehicle risk using Q1 driving behavior
We assigned each vehicle a Predicted Collision Risk (PCR) score based on its behavior during the first quarter of 2024 (Q1). These scores were averaged across Q1 to ensure stability and reduce noise from short-term events.
2. Grouped vehicles by risk level
After scoring, vehicles were divided into two groups:
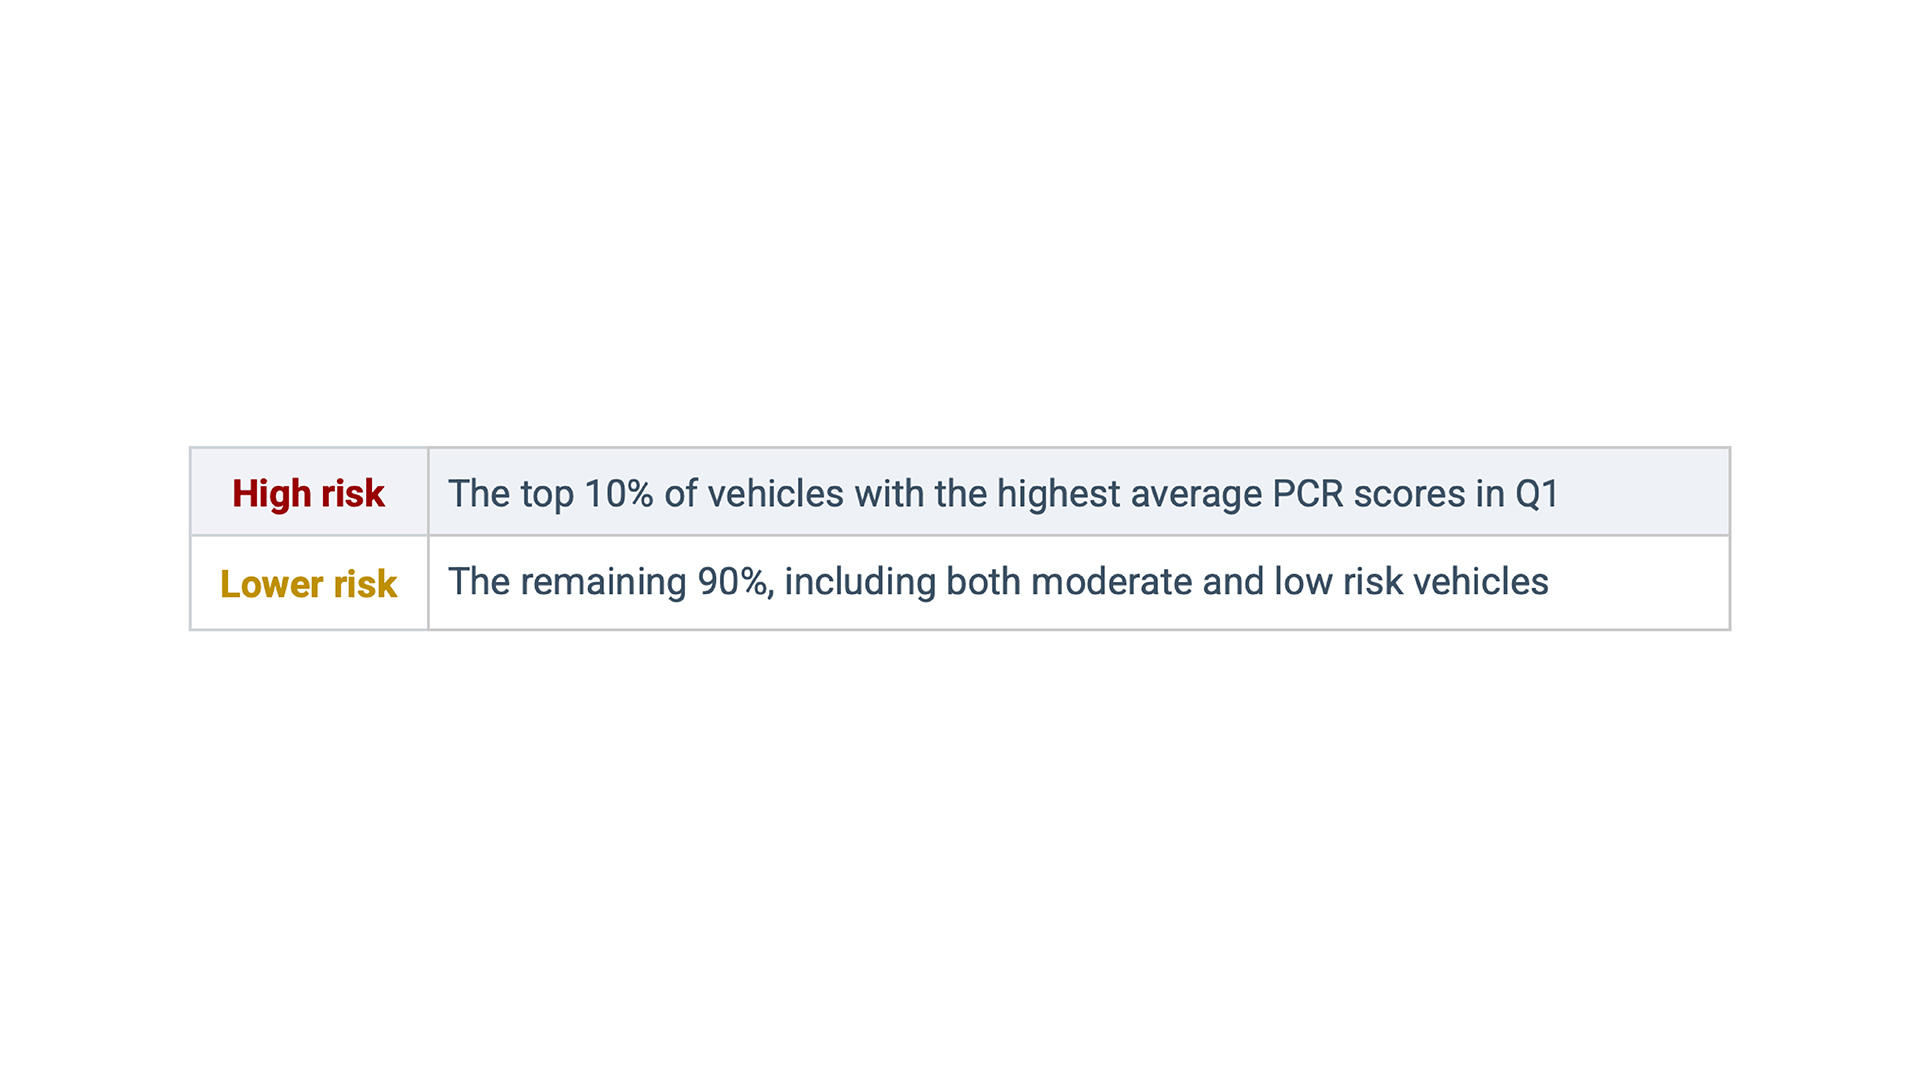
3. Tracked what actually happened
We then monitored how each group performed during the next three quarters (Q2–Q4 2024), tracking:
- Collision counts
- Distance driven
- Collision rates normalized per 100,000 kilometers
4. Compared predictions to outcomes
By comparing average predicted risk from Q1 to actual collision results (as determined by Geotab’s collision detection model) in the months that followed, we measured how well the model distinguished higher-risk vehicles from the rest.
What the results prove
The validation confirmed that Geotab’s Predictive Safety Model reliably identifies vehicles at elevated collision risk, as risk scores from Q1 2024 driving behavior closely aligned with actual collisions observed in Q2 through Q4.
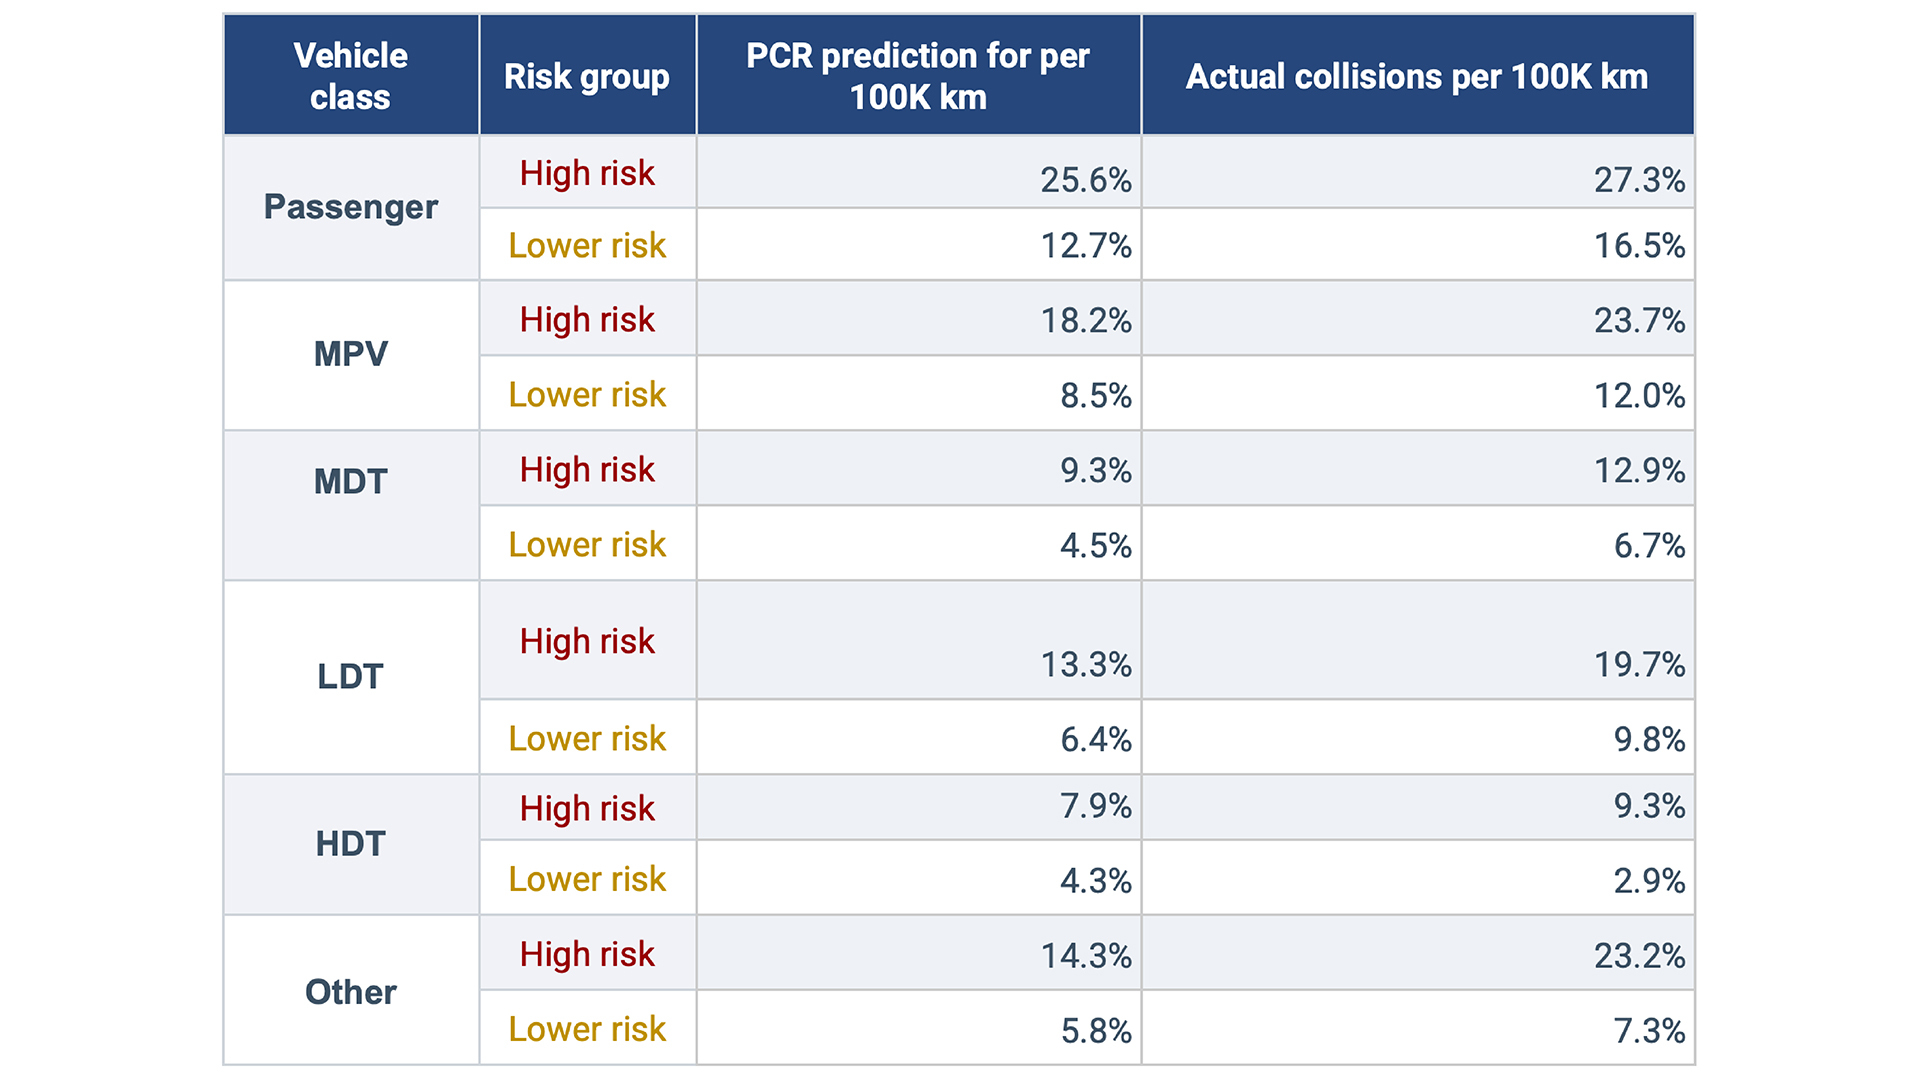
Consistent risk separation across vehicle types
The model reliably distinguished higher-risk vehicles from lower-risk ones across every major fleet category. This held true regardless of vehicle class, operating conditions, or usage patterns, demonstrating the model’s accuracy across a diverse and complex dataset.
The table below shows how vehicles performed based on their assigned risk tier. Risk groups were defined using average Predicted Collision Risk scores from Q1 2024. The outcomes reflect actual collisions and distance driven during Q2 to Q4 2024.
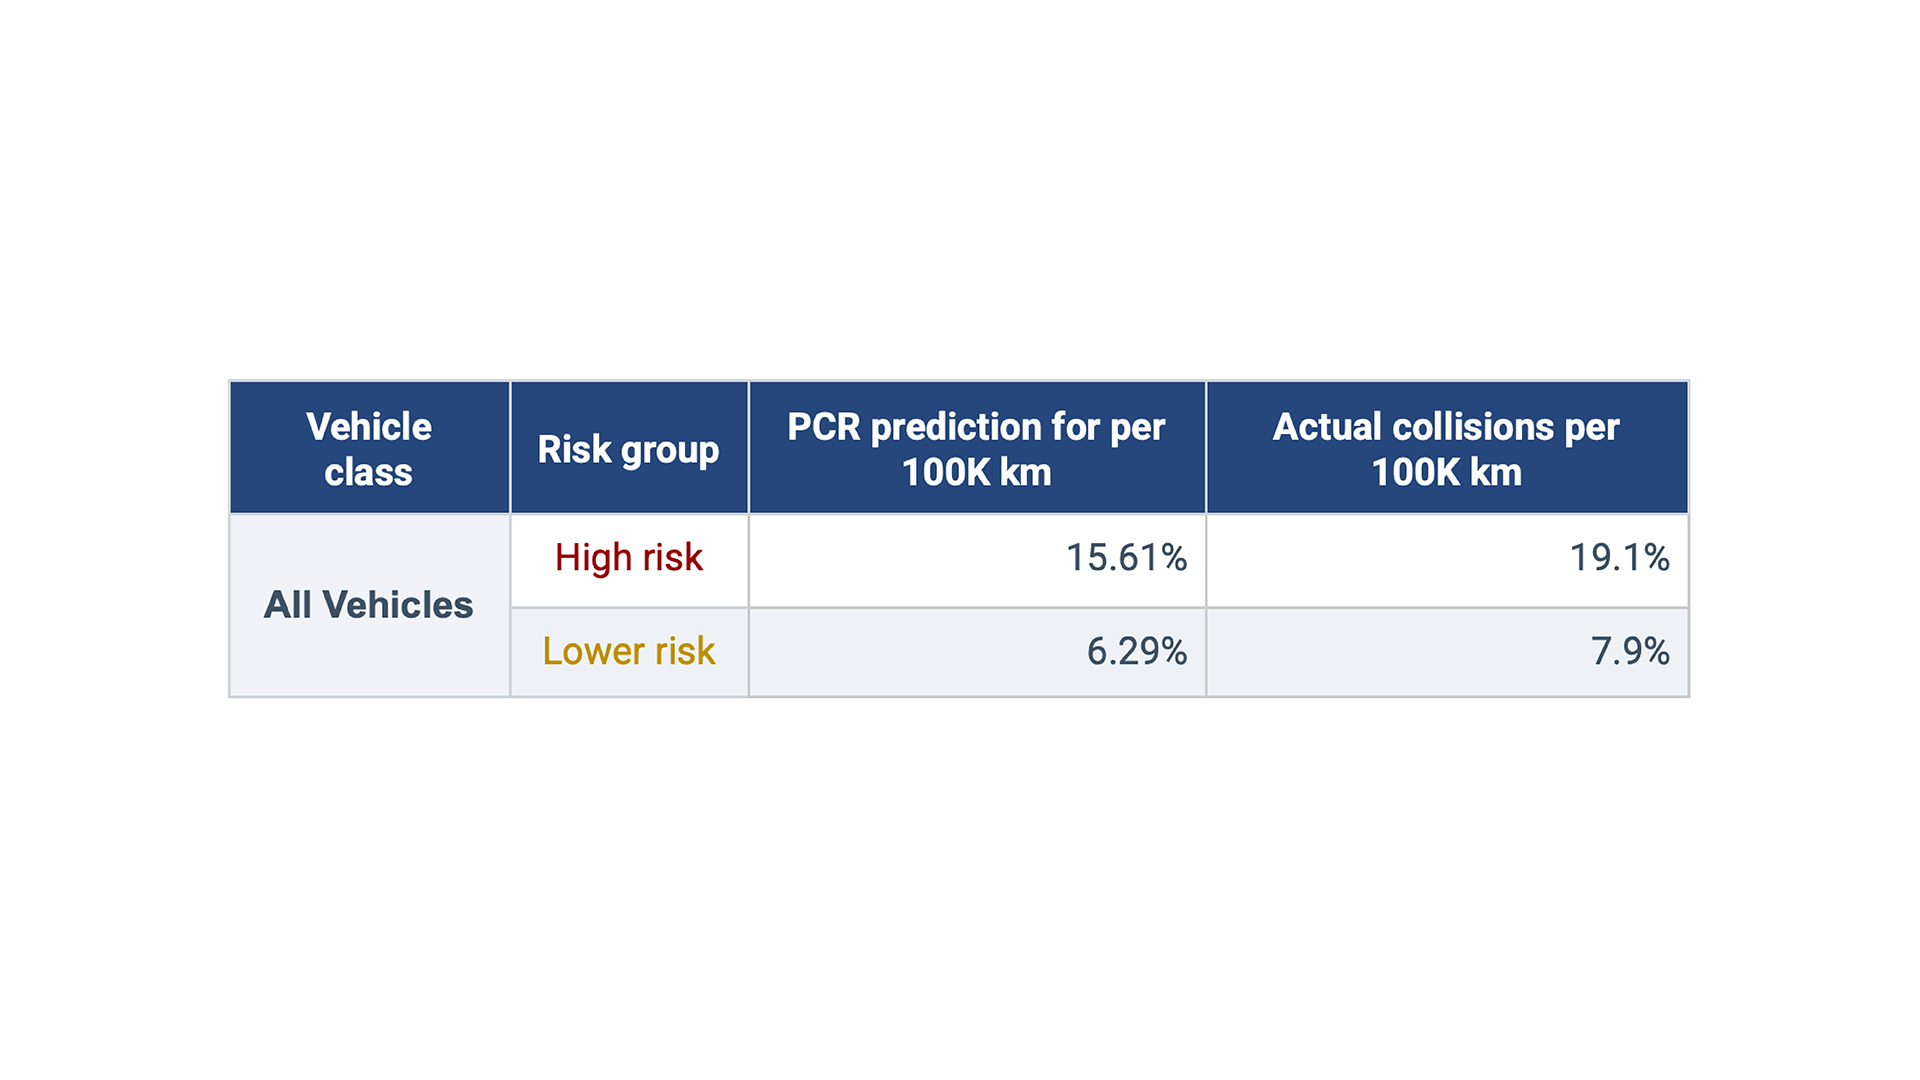
Performed reliably when evaluated all vehicle types
High-risk vehicles were found to be 2.4 times more likely to be involved in a collision, with approximately 1 in 31 experiencing one within a nine-month period.
What this means to your fleet
Instead of waiting for the next collision, you get a clear, early warning, so you know where risk is building and can step in before there's a problem.
What you get with this model:
- Find and address unsafe drivers and vehicles before something goes wrong
- Prioritize coaching or interventions where the data shows real risk
- Hold drivers accountable based on predicted risk, not just past behavior
- Build a flexible, scalable safety strategy that grows with your fleet
By using predictive safety, your team gets ahead of incidents and makes every trip safer.
Schedule a demo, get a high-level overview of your fleet’s performance and benchmark with similar fleets.
Let’s cut incidents and make every kilometer travelled safer.
Subscribe to get industry tips and insights
The Geotab Team write about company news.
Table of Contents
Subscribe to get industry tips and insights
Related posts
Unified data: The key to fleet liability reduction for government agencies
March 19, 2026
9 minute read


Building a proactive government fleet safety program with data and AI
March 9, 2026
5 minute read

Driving Through the Deluge: How Rain Affects Traffic Speeds Across Major Cities
March 5, 2026
1 minute read

Building a coaching culture: How to end the ‘gotcha’ game in your fleet
March 4, 2026
3 minute read