Area of Operations: Know where your fleet goes
Geotab has launched the new Area of Operations experiment from the Analytics Lab. The insights from this experiment are free to Geotab customers across all rate plans, and can help fleets understand their vehicle utilization patterns using telematics data.

By Paul Maida
Oct 31, 2025

Geotab’s Area of Operations experiment leverages your fleet’s data to provide you with a daily understanding of where vehicles are going, how long they take to get there, and the patterns observed within their working hours.
Better visibility into fleet utilization
Supply chain management has become a hot-button topic in the trucking industry, thanks to the effects of the pandemic on the global supply chain, increased consumer demand for same-day delivery, and driver labor shortages. All these circumstances lead to a need for a higher level of visibility into a fleet’s vehicle utilization. Geotab GO telematics devices provide visibility into where your vehicles travel, and how they are used when they arrive at their destination.
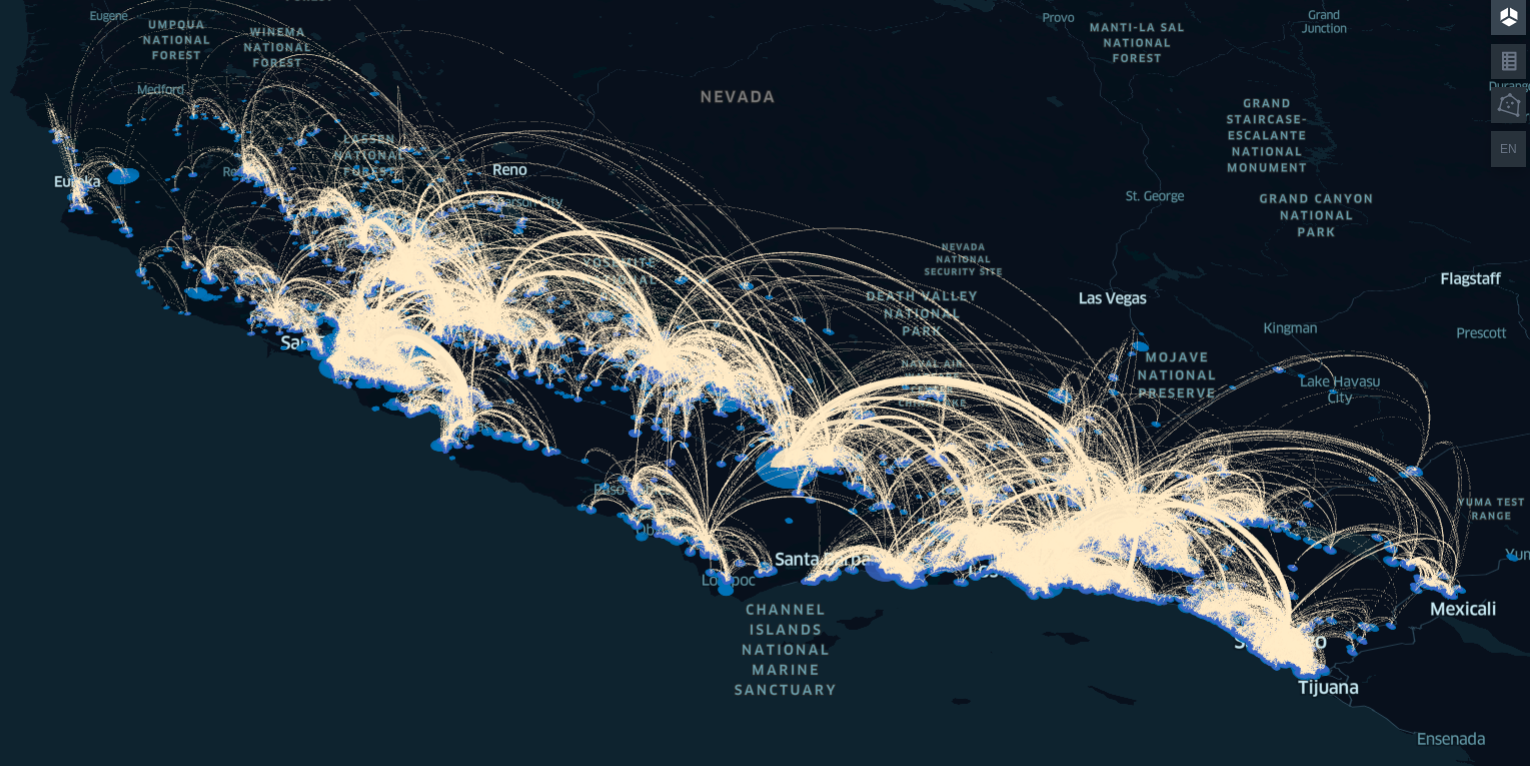
Telematics data used to look at important locations and driving patterns
What is the Area of Operation?
The Area of Operation, for the purposes of this experiment, is defined as:
- A region where a vehicle travels and is monitored on a given day as represented by a polygon on a map. Each vehicle is monitored by their tracking device on a daily basis and represented in MyGeotab reports by their VIN-HardwareId-ClientGUID). Each vehicle’s trip departure location and destination are captured, along with any stops or detours along the way. The Area of Operation experiment was developed to determine the total area of operation for each fleet vehicle.
Heavy-duty trucks and other fleet vehicles and assets often spend a significant amount of their out-of-service time in a parking or storage yard. These locations are often referred to as domiciles. A domicile used is defined as:
- Domiciles were selected as the most popular geopoints where drivers and their vehicles have their longest stops of the day. Domiciles are excluded from the area of operation polygon in order to give an understanding of where a vehicle is going relative to where it domiciles.
The users can choose the domicile they would like to view. By drilling down on multiple domiciles, or a singular one, users can see the area of operations for the vehicles associated with the chosen domicile(s), some high-level metrics as well as an interactive map.
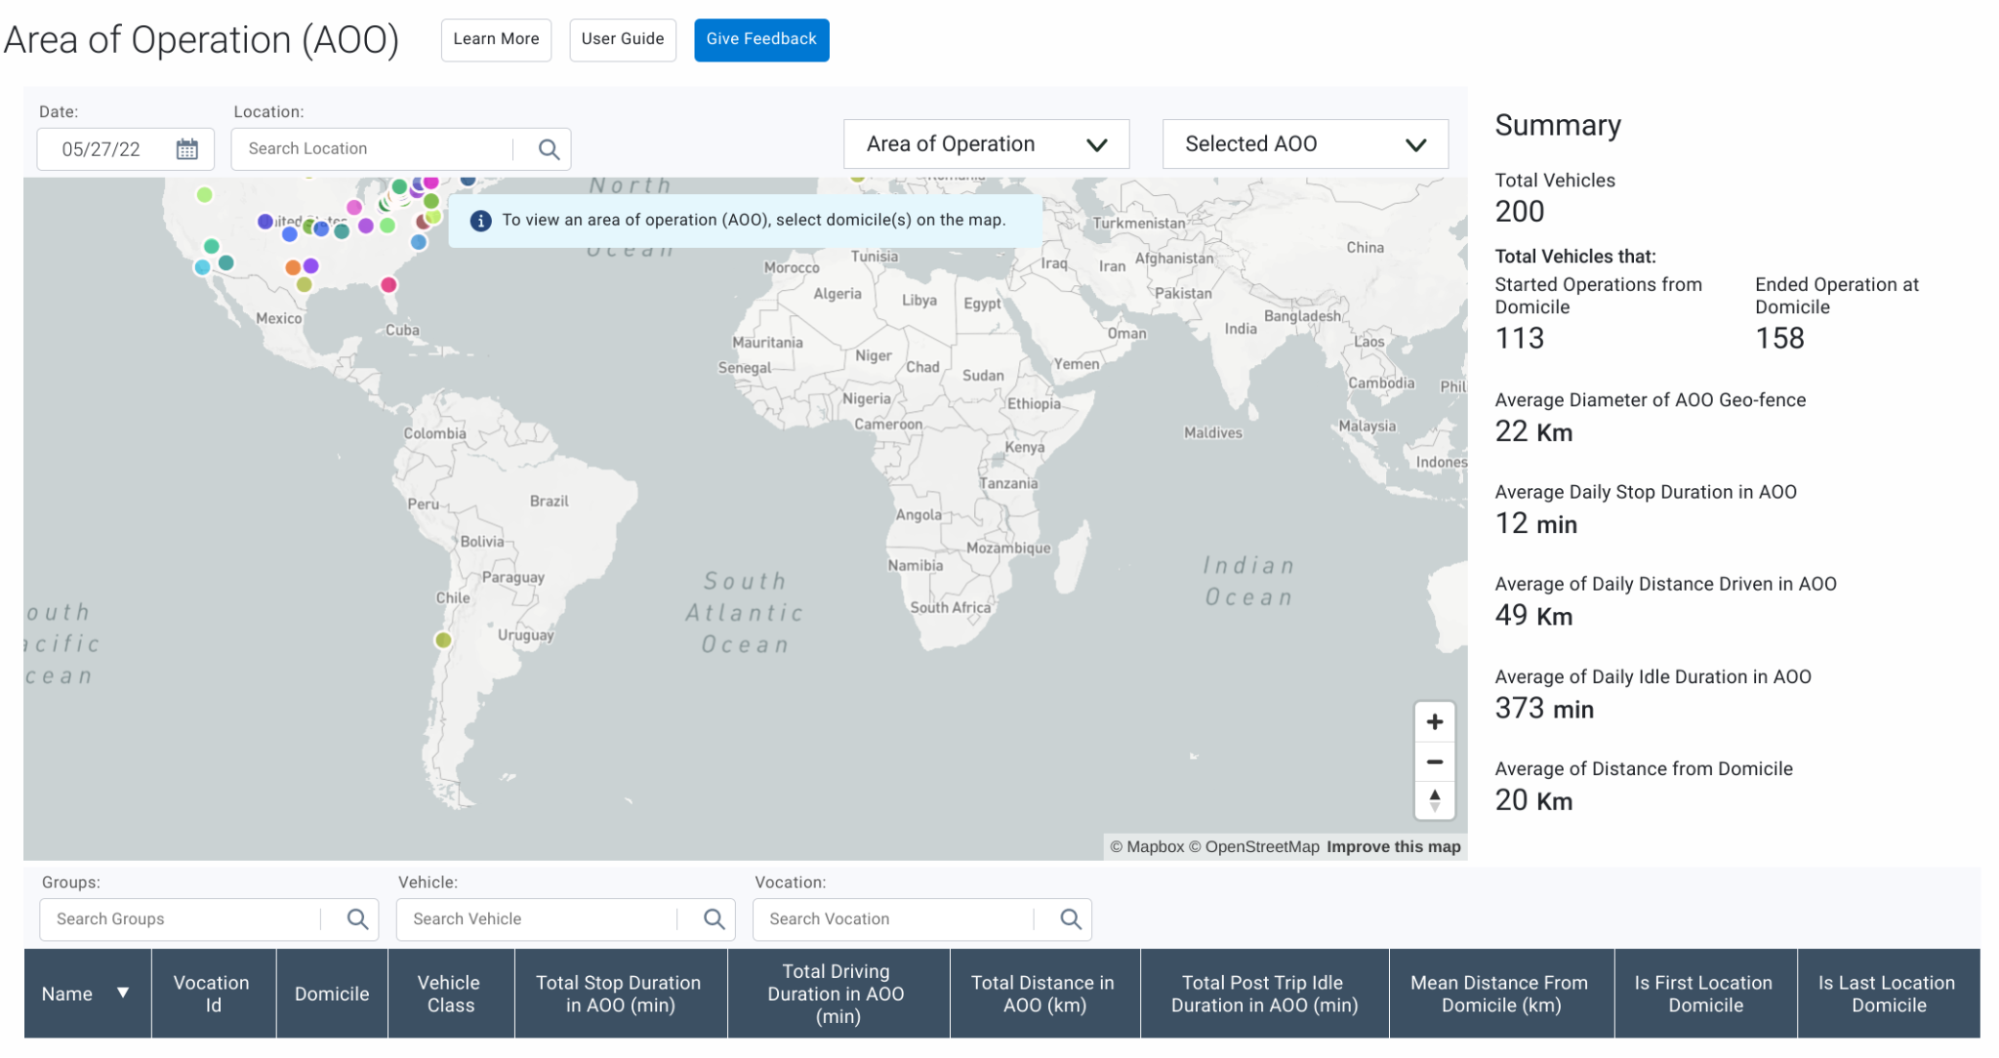
This experiment caters to users that have typical single day driving behaviors and return to base frequently (such as last mile delivery vehicles or hub and spoke field services). We are in the process of working on a graph network analysis that will cater to a broader group of users, as we garner feedback from this experiment.
How do I find the Area of Operations tool in MyGeotab?
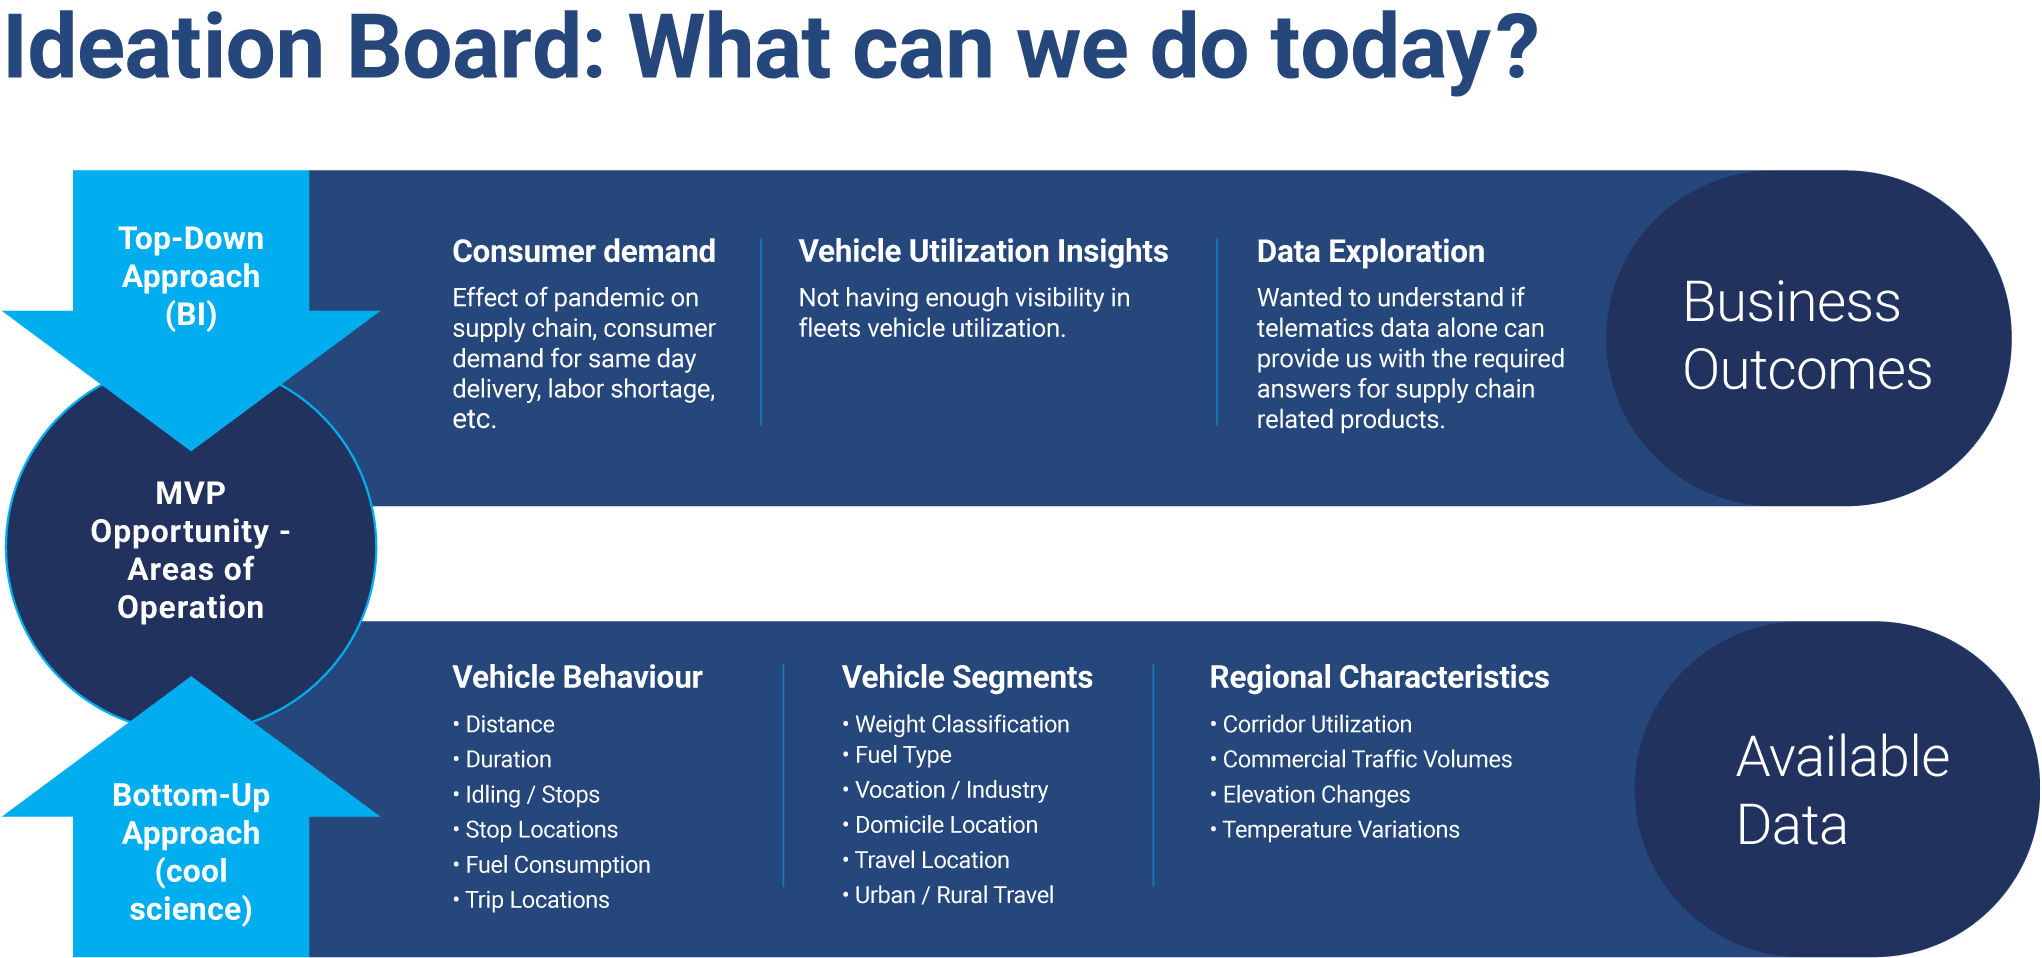
The Area of Operation table and experiment can be found in the Analytics Lab tab of MyGeotab. Analytics Lab is a testing ground for experimental data solutions driven by internal and external discovery, looking to surface relevant insights and obtain feedback during its entire lifecycle.
The experiment follows our typical life-cycle within the Analytics Lab of determining what business outcome we want to achieve and what available data we have. By following this framework we can start with a simple concept that we can test and get feedback, as we begin to work towards developing full features for supply chain use cases.
How can I help improve the Area of Operations experiment?
Our intention with this experiment is to provide users with valuable and actionable insights surrounding their utilization patterns. We want you to be able to get a first look at your data to help you navigate some of these utilization and supply chain challenges everyone is facing.
Fill out the survey at the bottom of the page or click the Give feedback button to help us get a better sense of how we can keep improving our product to provide you with the most valuable insights. We would also like to hear about your experience with the app, and if it was helpful to you.
We are excited to hear your feedback and continue to improve on this experiment!
Subscribe to get industry tips and insights
Paul Maida is a Product Discovery Lead, New Ventures at Geotab.
Table of Contents
Subscribe to get industry tips and insights
Related posts
.jpg)
Marketplace Spotlight: Redefining Fleet Security with Matrix iQ
July 15, 2026
2 minute read


How sanitation fleets can prevent return trips and reduce solid waste collection costs
June 15, 2026
3 minute read
.jpg)