Improve how your fleet runs with the Analytics Lab
Join the forefront of innovation, data analytics and artificial intelligence (AI).

Product Manager, Analytics Lab
May 29, 2025

Geotab is committed to developing brand new ways for businesses to continuously benefit from a data-driven environment and with the help of actionable insights. To help align with these goals, we have introduced Analytics Lab, which is now available as a default in MyGeotab 2102 or higher versions.
What is the Geotab Analytics Lab?
Analytics Lab is a testing environment that allows fleet customers and Partners to engage with and influence the direction of Geotab’s data solutions. The experiments are shared in the form of Apps, or as APIs (application programming interface) hosted within the API Explorer app. The list of data experiments is always evolving.
Available experiments and benefits
Fleet managers can take advantage of the following currently available experiments to make informed business decisions, gain a better understanding of their fleet performance and uncover trends. The experiments available will change over time as new ones are added. Keep checking back to see if there is one that interests you.
Safety Benchmark: Investigate how your fleet safety score compares to similar fleets in the industry
For fleet managers who need to define and measure safety goals, Safety Benchmarks provides actionable insights by analyzing your fleet’s safety performance and comparing it to peer groups.
Unlike typical benchmarking calculations that depend on surveys, the benchmarking analysis dynamically creates peer groups using artificial intelligence (AI). Therefore, the safety benchmarks are fact-based and empirical to help fleet managers make data-driven decisions.
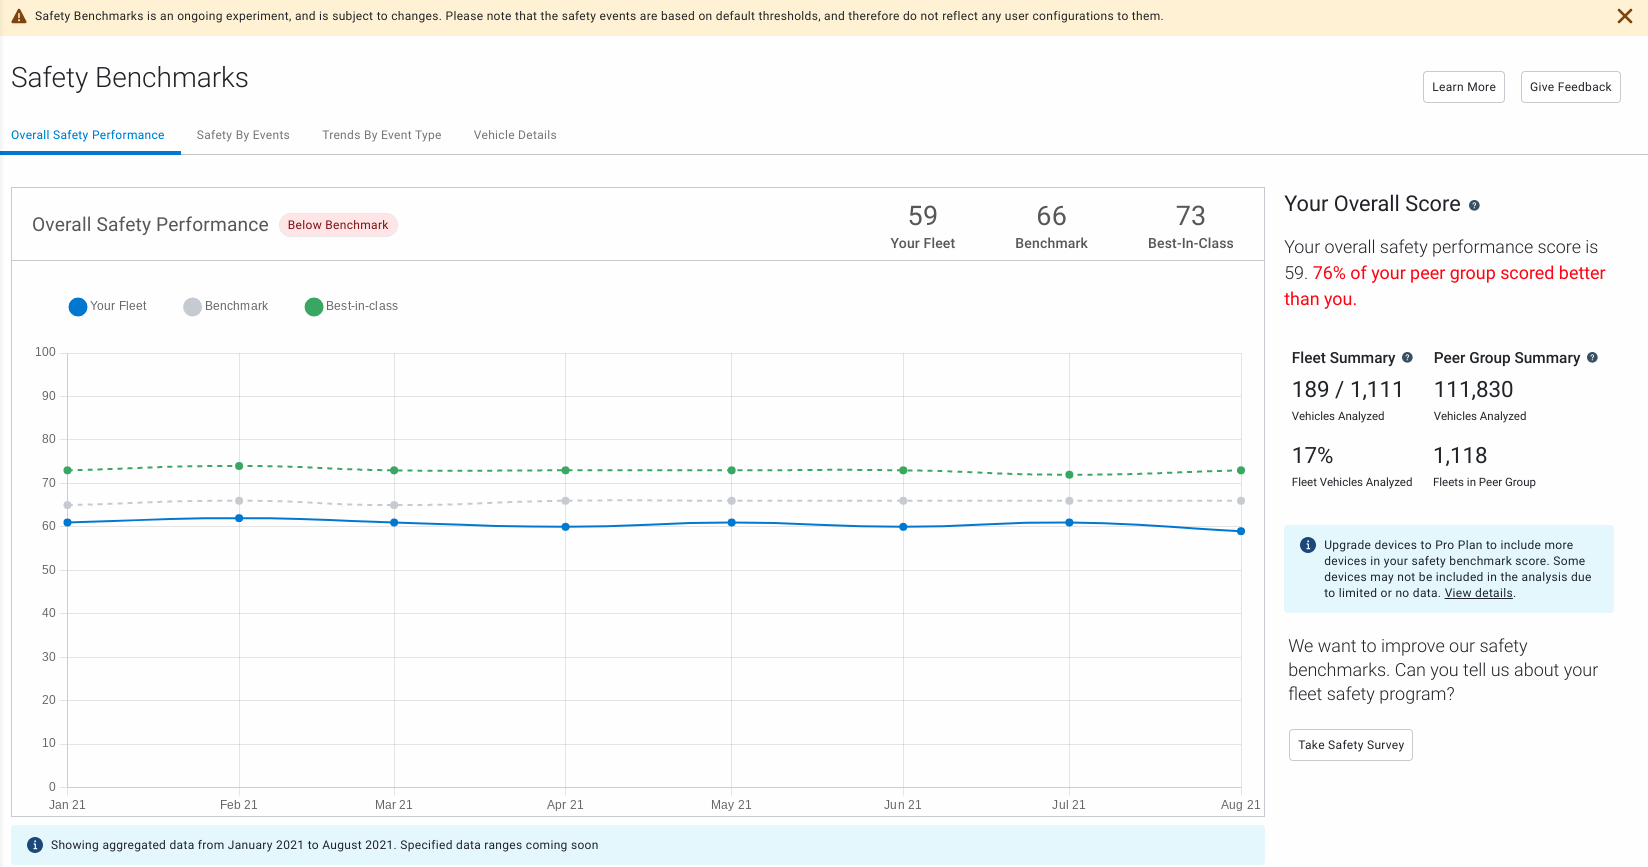
An example of a safety benchmark metrics from the Analytics Lab in MyGeotab
Intelligent zoning: Enjoy automatic, tailored predictive zoning
Take advantage of time-saving predictive zoning that can be tailored to your fleet’s unique needs. By using this data-driven approach, fleets can use historical activity to reduce effort and friction in the administration of Zones.
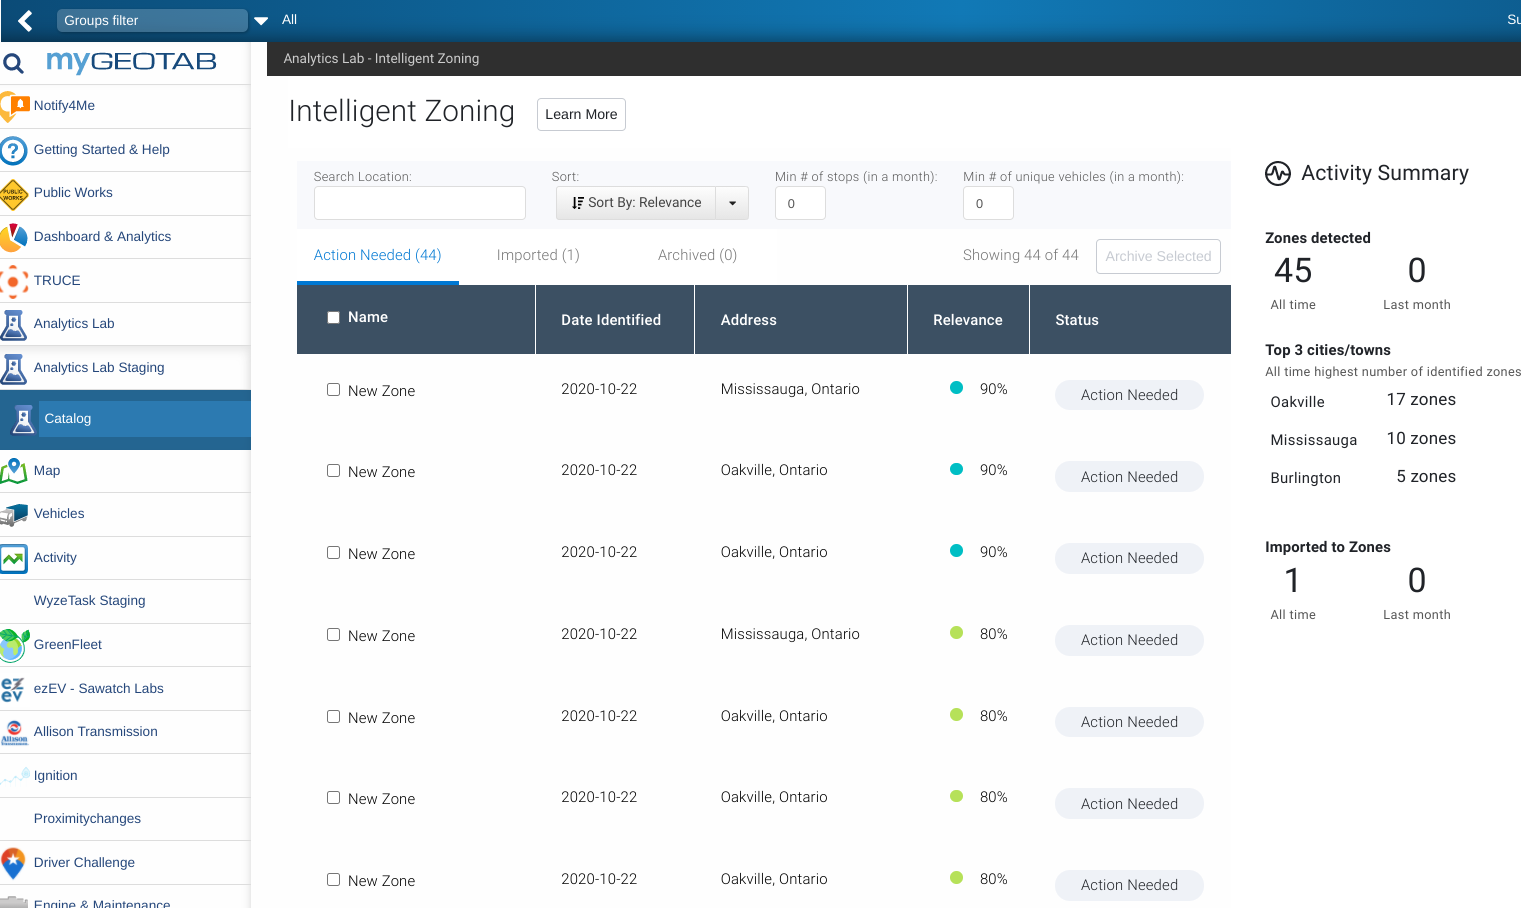
Intelligent zoning app UI showing detected fleet zones.
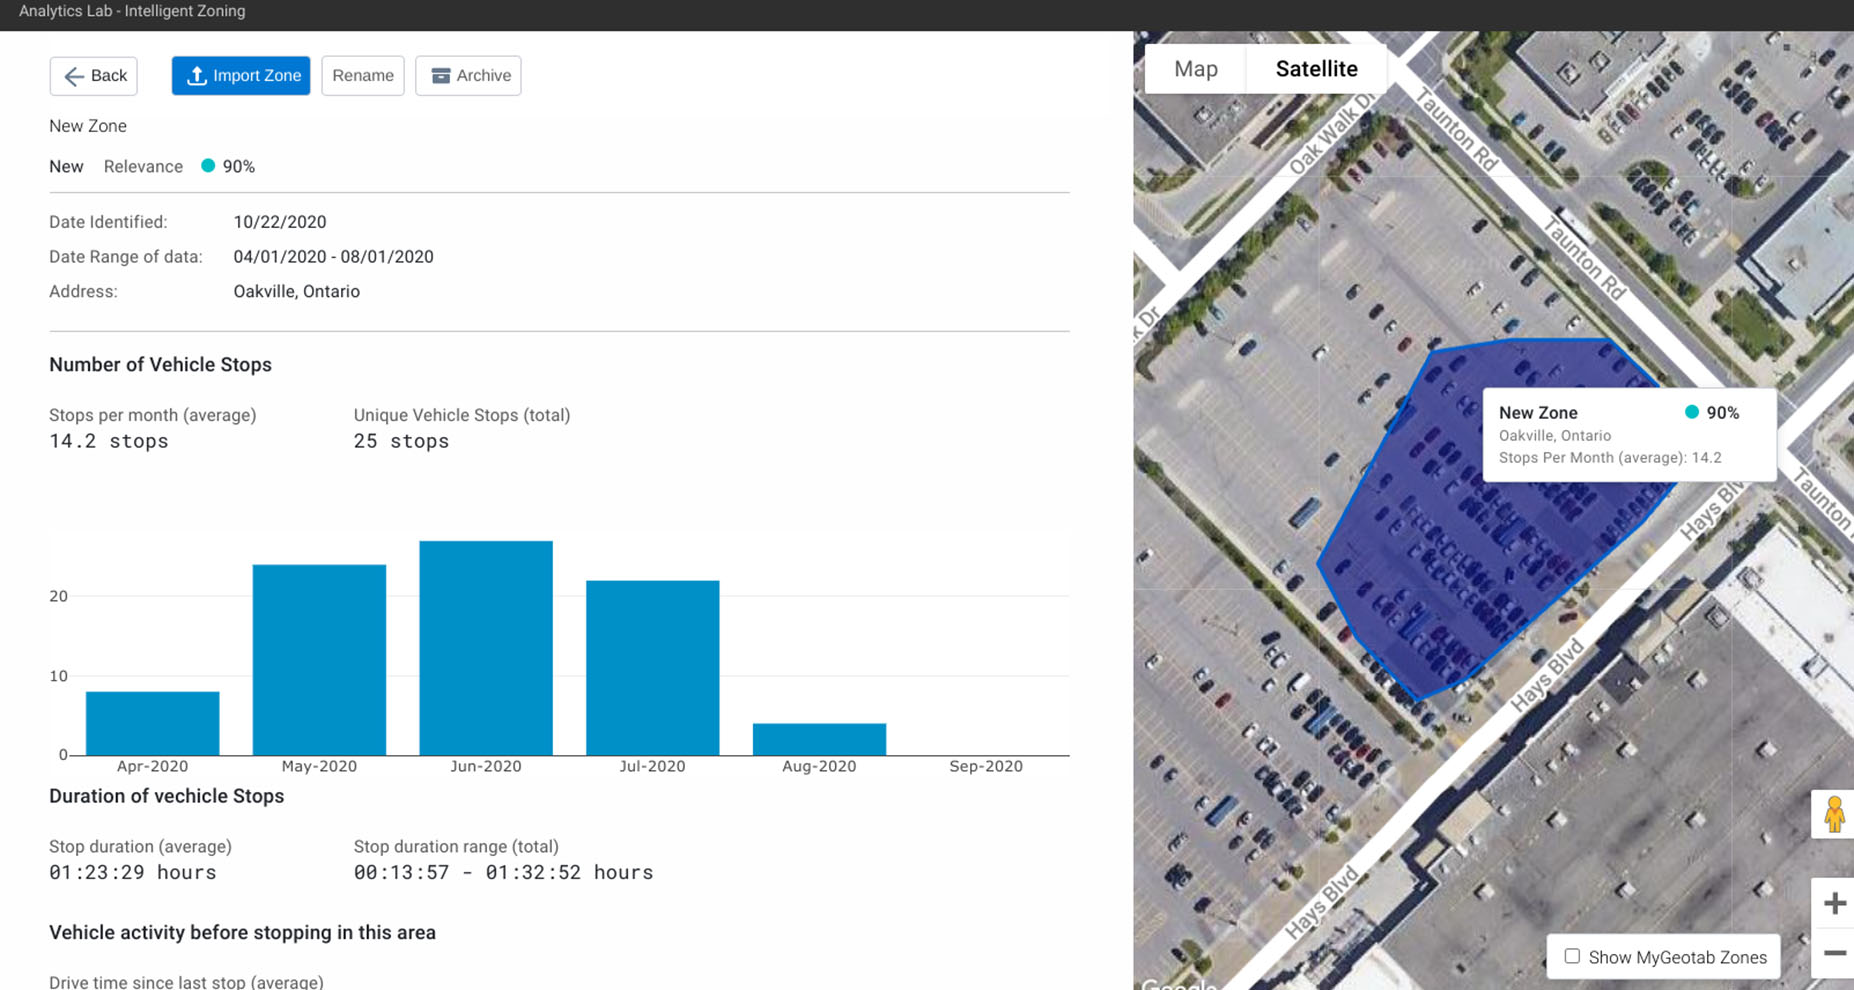
Intelligent zoning app UI showing map view of a fleet zone.
Collision detection: Monitor potential collision events
Review data points of potential collision events within your fleet. Make informed decisions to reduce exposure and mitigate risks of future events.
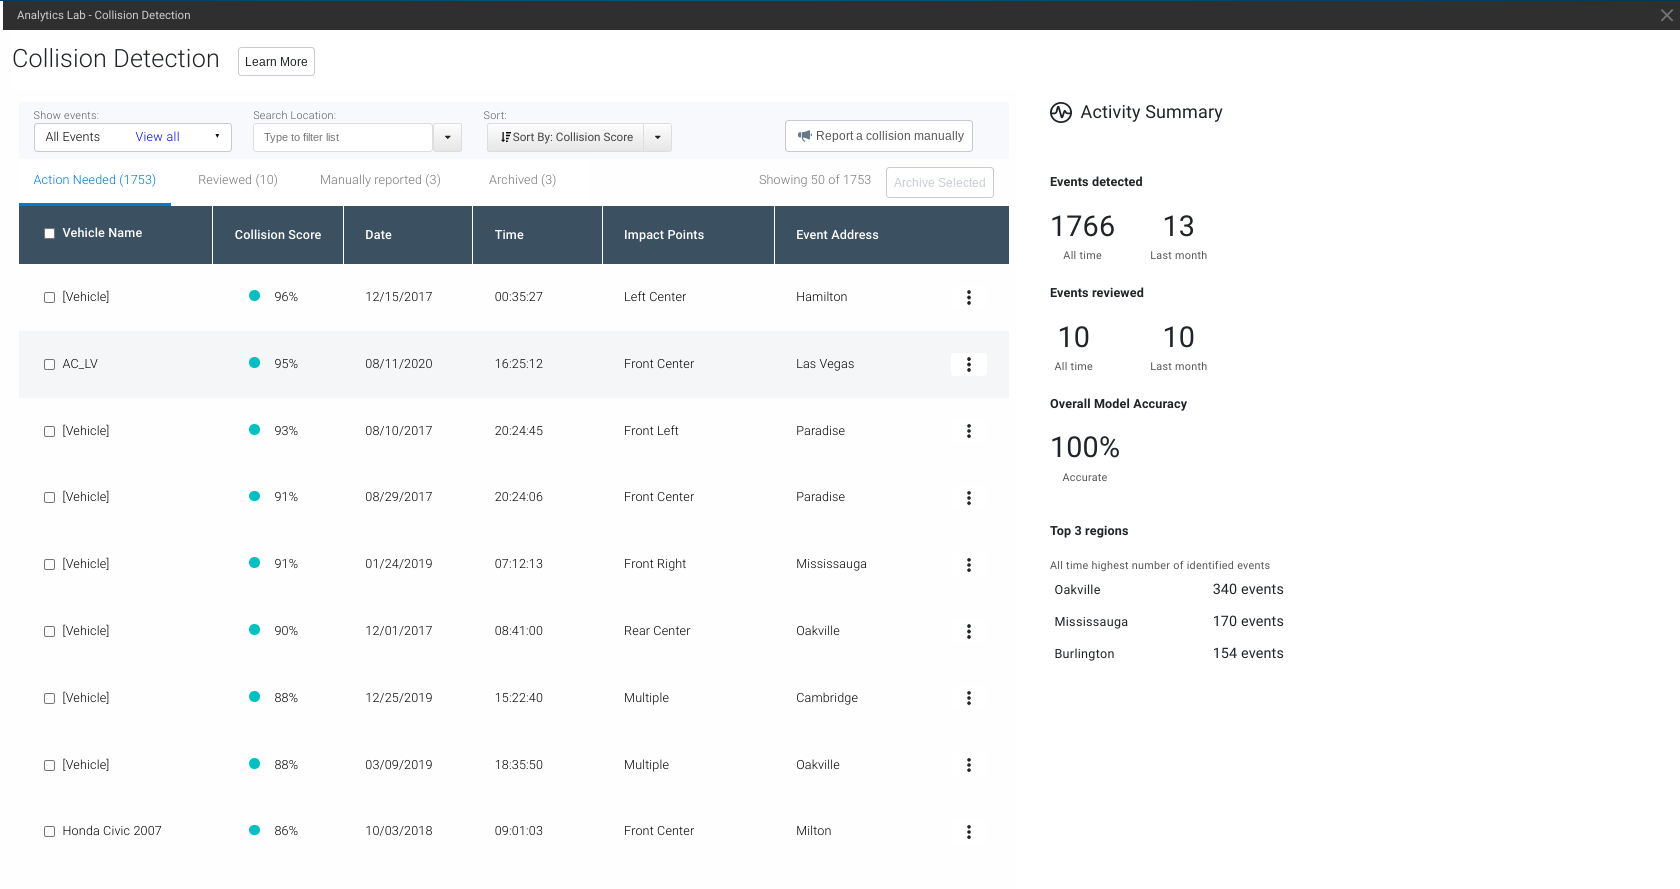
Collision detection app UI showing detected collision events.
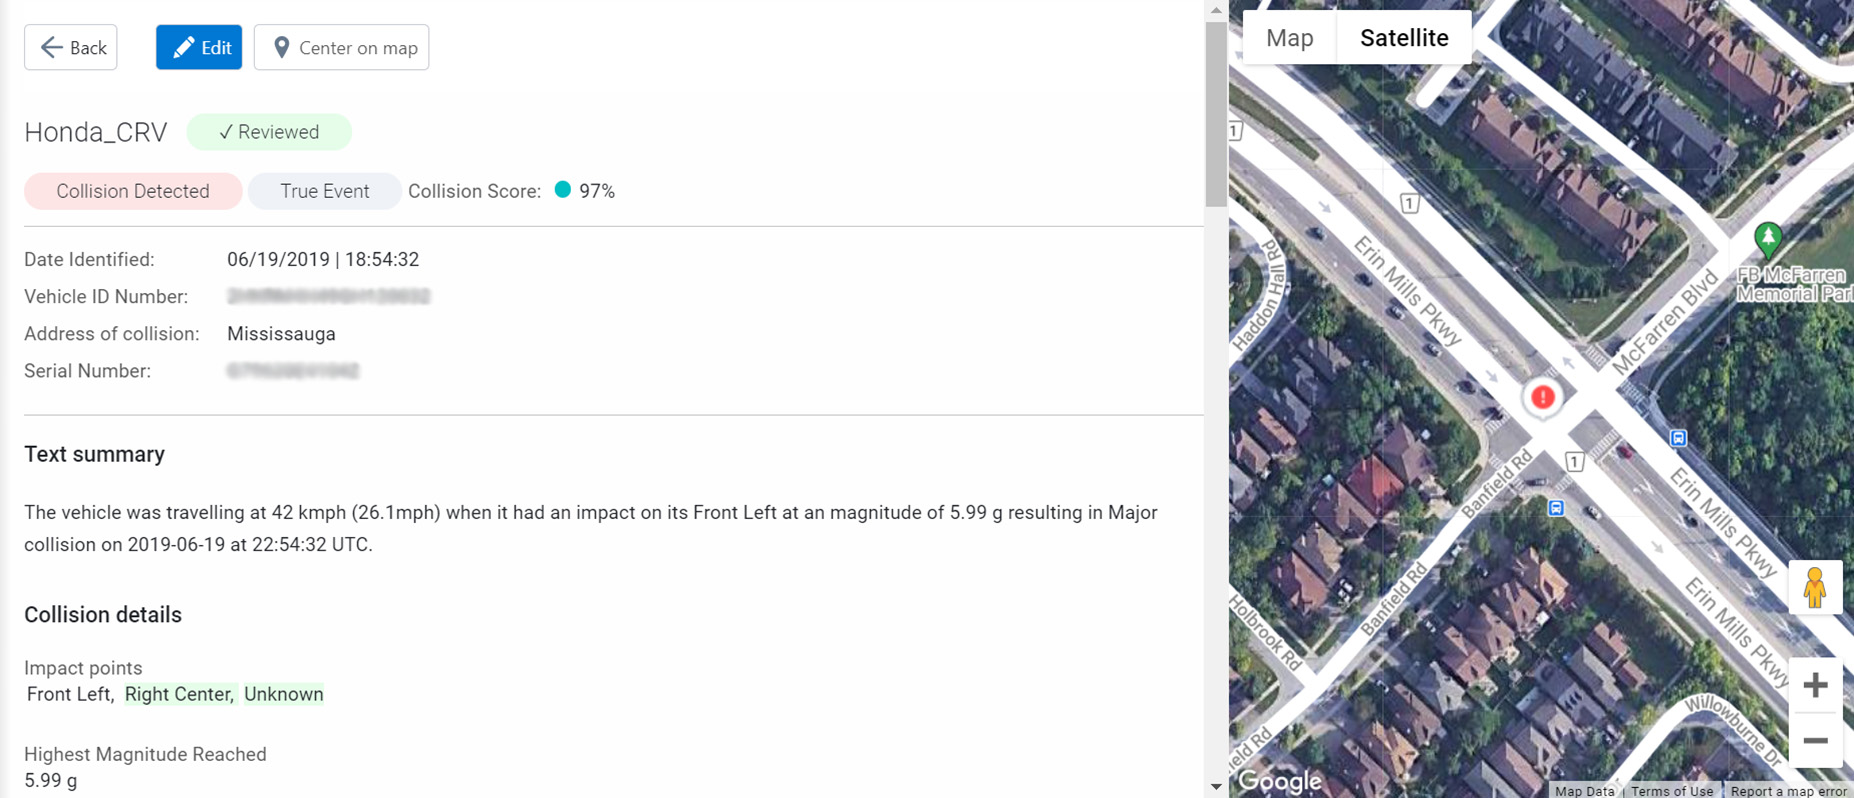
Collision detection app UI showing a satellite view of a collision event and its details.
Take advantage of the API explorer within Analytics Lab
Calling all data scientists and developers! Take your efforts a step further. Save time and gain insights on fleet activity by integrating with pre-formulated codes on a wide range of use cases.
Current use cases include:
- Service Center events
- Contextual Risk Index
- Nearby fuel stations
- Nearby rest areas
- Fuel benchmarking
- New zones
- Collision events
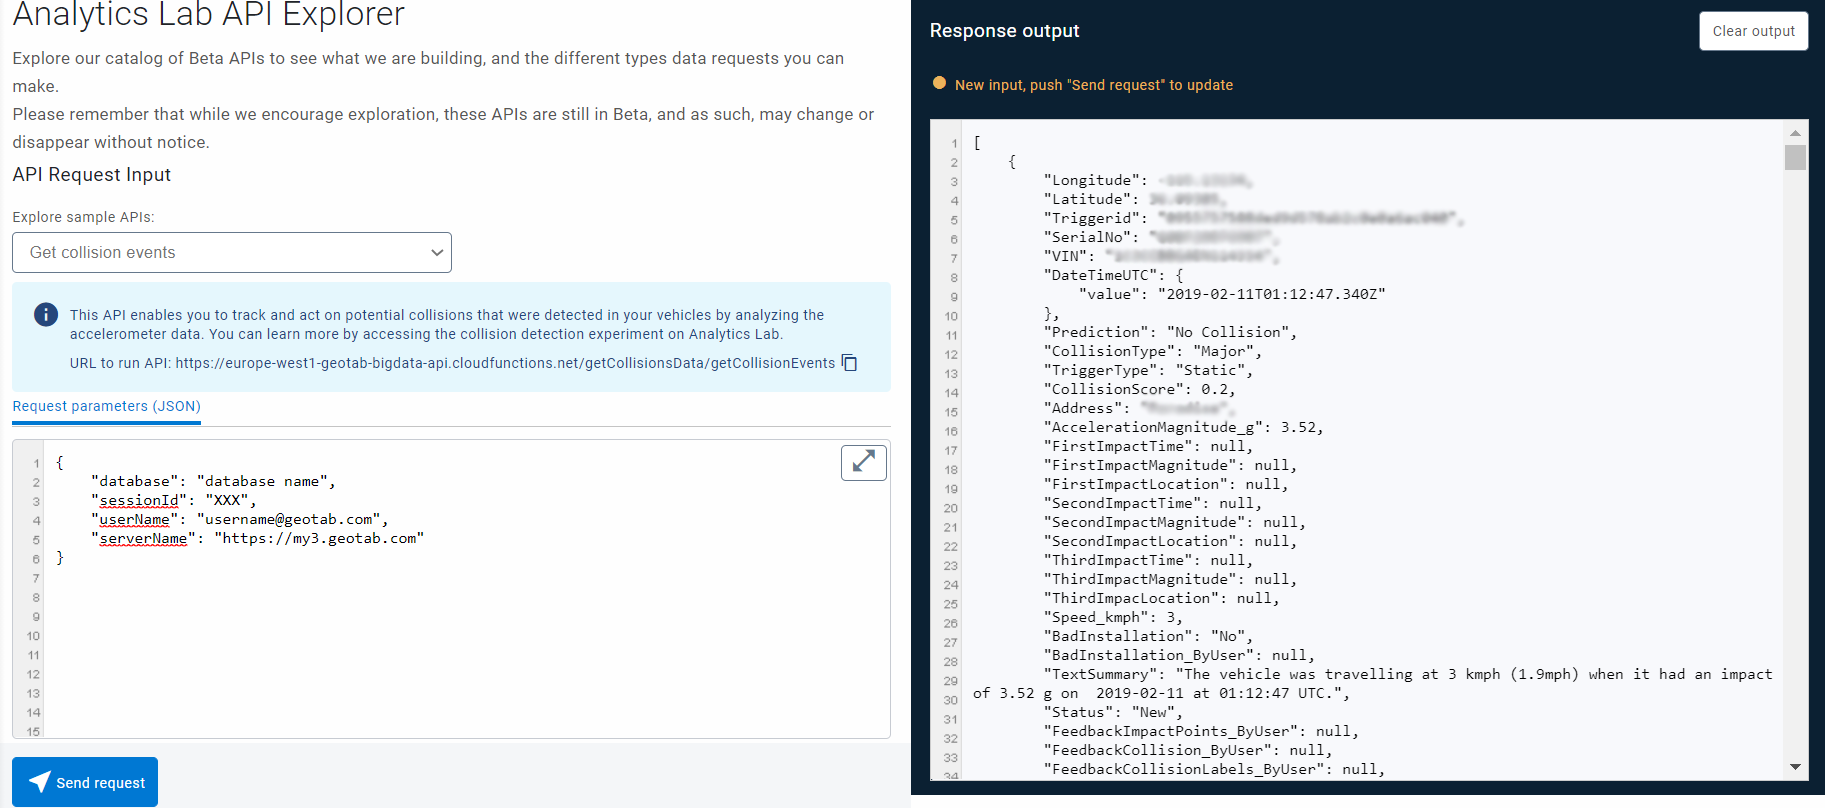
API explorer app UI showing collision events API.
How to get involved
Explore Geotab’s Analytics Lab and discover new insights to empower your fleet.
Visit Analytics Lab through the Dashboard & Analytics menu and get involved in testing the experiments today. Please note that Analytics Lab is now available by default in MyGeotab 2102 (or higher versions), and the previous Marketplace add-in has been discontinued.
Connect with our data experts for support on experiments, share your experience and learn more about Analytics Lab by joining our Community group.
If you have a new idea for a data experiment or want to submit feedback, use the Analytics Lab Feedback form.
Subscribe to get industry tips and insights
Product Manager, Analytics Lab
Abhinav Narayanan is a Product Manager, Analytics Lab for Geotab.
Table of Contents
- What is the Geotab Analytics Lab?
- Available experiments and benefits
- Safety Benchmark: Investigate how your fleet safety score compares to similar fleets in the industry
- Intelligent zoning: Enjoy automatic, tailored predictive zoning
- Collision detection: Monitor potential collision events
- Take advantage of the API explorer within Analytics Lab
- How to get involved
Subscribe to get industry tips and insights
Related posts

From video archives to active prevention: The case for AI dash cams
July 22, 2026
4 minute read

Best small fleet management software providers and how to choose one for your business
July 16, 2026
8 minute read


.jpg)