Finding patterns in collision data
Learn how speed, trip start, and trip duration are related to collisions in this deep dive on collision data from Geotab telematics.
By Geotab Team
Dec 22, 2023

Telematics makes for a great business tool by being able to identify single safety events, such as a driver speeding or not wearing a seatbelt. All this helps fleets to train and work with drivers on reducing safety risks. But telematics can bring even more to the table by helping unfold a larger view on fleet safety.
There may be habits going on with your operators that could easily go unnoticed without stepping back and looking at the information for trends. We generated some data points on patterns in collision events.
Here are a few of the findings:
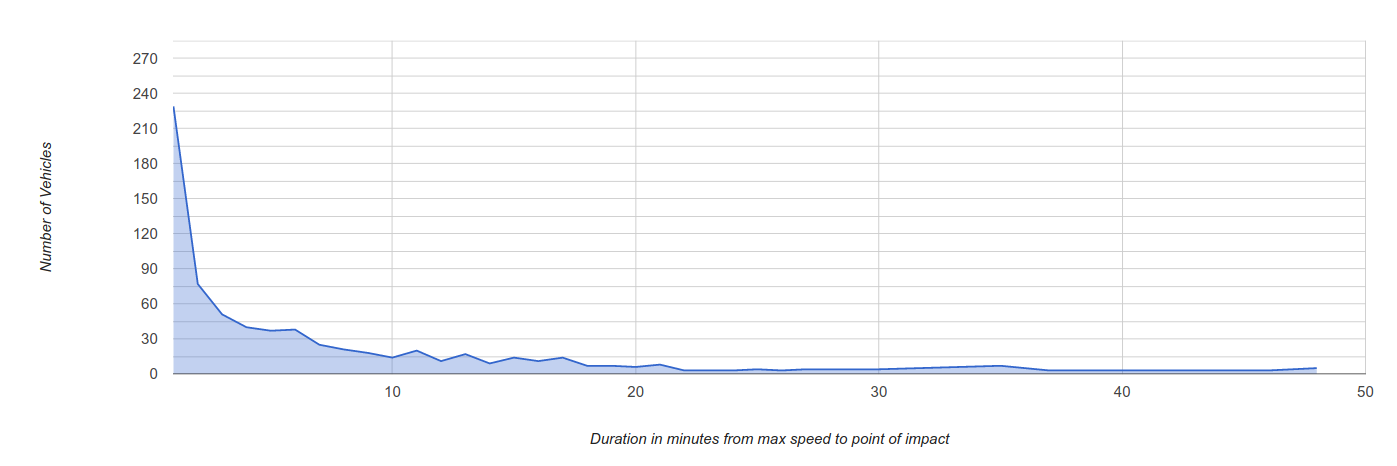
1. Time from Maximum Speed to Impact
The chart: This chart looks at the duration in minutes between a driver hitting the maximum speed in their trip and the point of impact in the collision (X-axis), and compares that to the number of vehicles in a collision during that time frame (Y-axis).
The findings: As you can see from the spike early on, there certainly seems to be a correlation with the speed and how soon a driver is likely to be in a collision.
In our sample:
- 29% of collisions occurred within 1 minute of the driver hitting the maximum speed in their trip
- 71% of collisions occurred within the first 10 minutes of the maximum speed
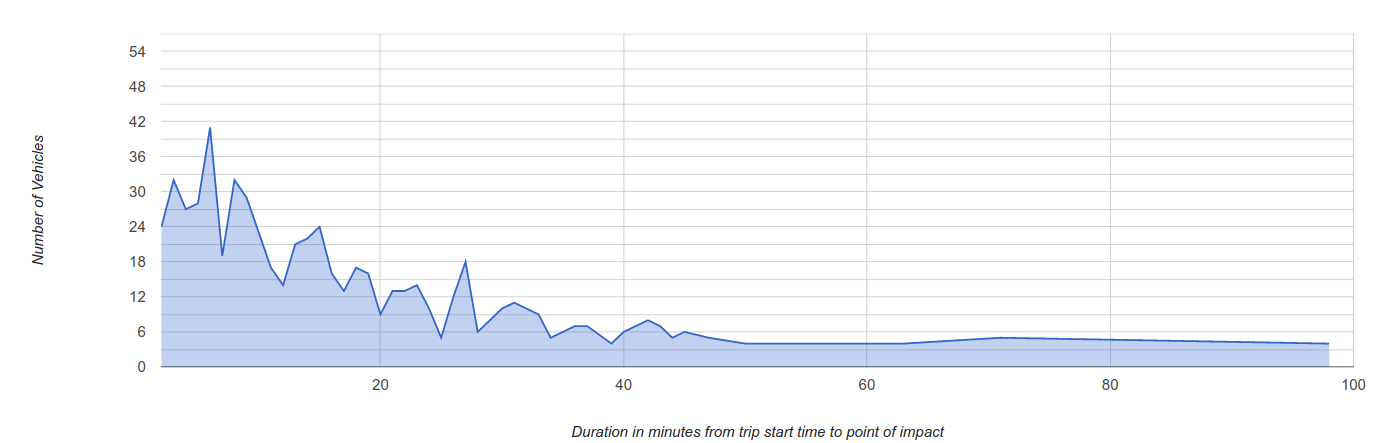
2. Time from Start of Trip to Impact
The chart: This chart compares the duration in minutes from the trip’s start time to the point of impact in a collision (X-axis) to the number of vehicles/collisions (Y-axis).
The findings: This trip collision study mostly gathered and used short trip data. By looking at the results presented in the chart below, it is clear that a large number of collisions can happen early on, right at the start of a trip. It is important for drivers to be fully prepared to practice safe and cautionary driving at all times.
In our sample:
- 33% of collisions occurred within the first 10 minutes of a trip
- 54% of collisions occurred within the first 20 minutes of a trip
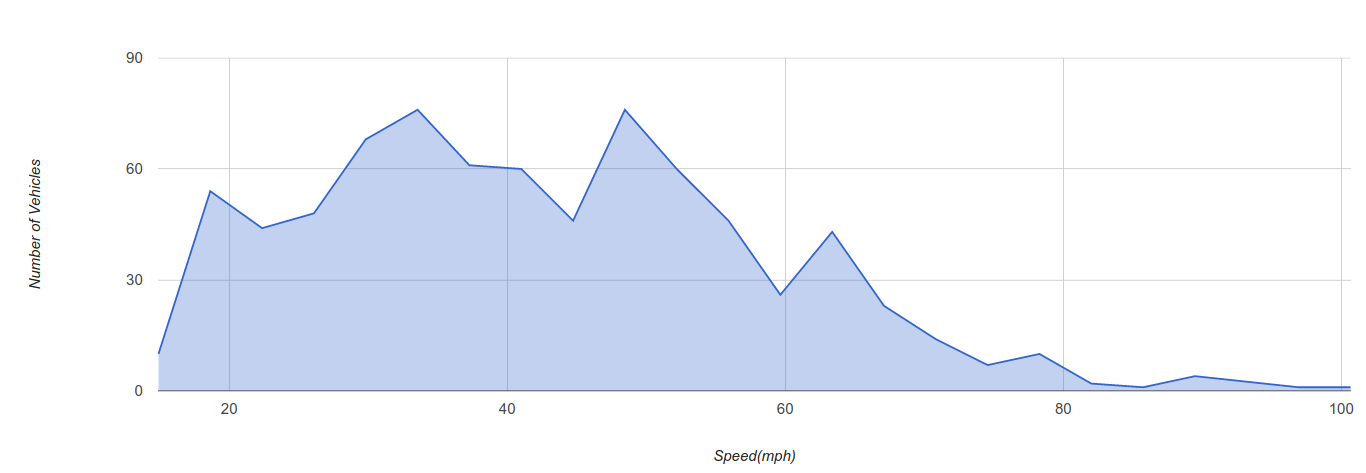
3. Speed Prior to Impact
The chart: This chart shows the driver’s speed in miles per hour (X-axis) and compares that to the number of vehicles/collisions that occurred at that speed (Y-axis).
The findings: While this chart has spikes throughout (and likely has few collisions past 80 mph since few drivers are going beyond that speed), we found one particular statistic of interest in our sample:
- 51% of collisions occurred below 40 mph in city driving conditions
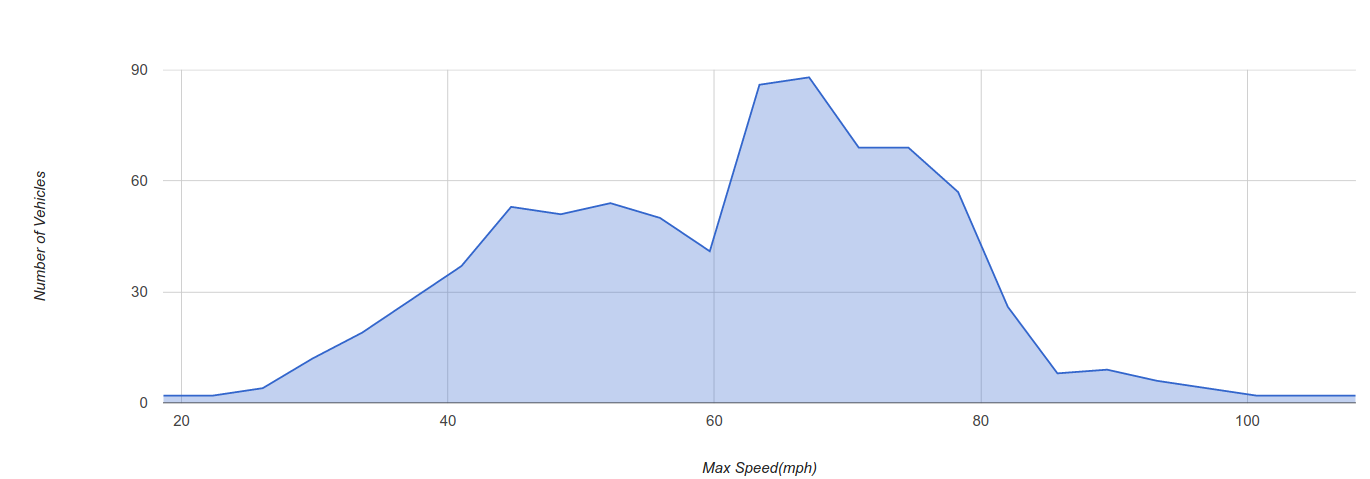
4. Maximum Speed of Drivers in a Collision
The chart: This chart looks at the maximum speed a driver hit during a trip (X-axis) and compares that to the number of vehicles/trips that had a collision in which that maximum speed occurred (Y-axis).
The findings: Drivers going more than 60 mph at any point during a trip seem to be more likely to get involved in a collision based on the spikes that can be seen in the chart above.
Even considering the maximum speed of some freeways, in our sample:
- 32% of vehicles had a maximum speed above 70 mph during their trip in which a collision occurred
Conclusion: Dig In
Don’t be afraid to extrapolate your own fleet’s data to find these larger trends and share them with your drivers as part of your safety training and safe driving reminders.
Related:
6 Road Crash Statistics You Shouldn’t Ignore
Collision Reconstruction with Telematics Data
Subscribe to get industry tips and insights
The Geotab Team write about company news.
Table of Contents
Subscribe to get industry tips and insights
Related posts

From video archives to active prevention: The case for AI dash cams
July 22, 2026
4 minute read
Closing blind spots in cargo security with a 360 fleet camera system
July 22, 2026
3 minute read
The safest mile in field service is the one nobody drives
July 22, 2026
2 minute read

B.C.'s Dashcam Mandate Creates an Opportunity for Safer Roads Across Canada
June 5, 2026
2 minute read
B.C.'s new dash cam law: A six-month clock is about to start for commercial fleets
June 2, 2026
5 minute read