Guide to driver scoring and scorecards
Driver safety is top priority, no matter the fleet size or type. Read how driver scorecards can help with productivity, safety, optimization and compliance.

By Melanie Serr
Dec 13, 2024

Driver safety is an important priority for fleets, no matter the fleet size or type. How can fleet managers tackle this issue and improve driver safety and performance? Driver scorecards are one solution. In this article, we’ll discuss driver scorecards and their effectiveness.
See also: How to empower drivers to improve safety
What are driver scorecards?
A driver scorecard is a type of driver performance evaluation based on specific driving metrics, such as speeding, aggressive behavior or idling. They are measured via a GPS fleet tracking or telematics system. Fleet and safety managers can use scorecards to track risky behavior and determine which drivers need additional training. They can also use scorecarding to identify the best drivers in the fleet, so that those drivers can be rewarded.
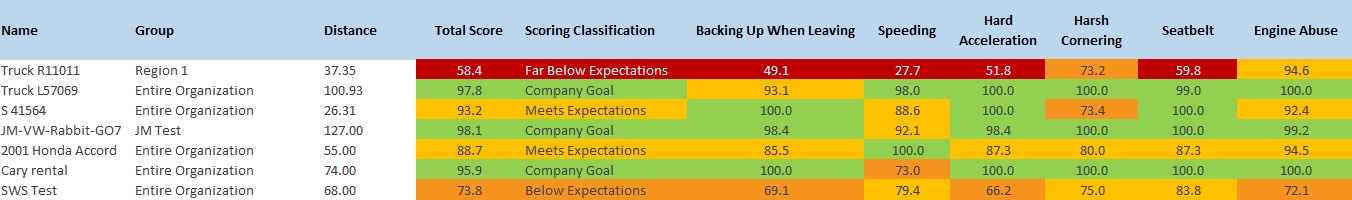
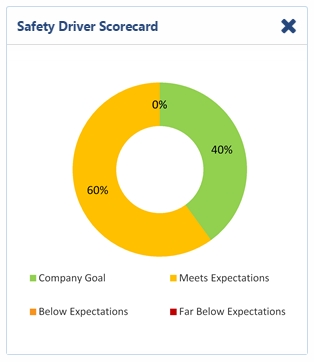
The scorecard template includes two components:
- Driver/Vehicle Report — Lists the different drivers or vehicles and shows their score in each measured category.
- Summary Chart — Shows overall performance (whether it meets company goals or is below expectations).
See also: How to get driver buy-in on driver scorecards
Key metrics to evaluate driving performance
Depending on your particular fleet goal, there are different metrics that you can measure and include in your driver scorecard. The following chart shows some metrics that can be helpful in evaluating driver performance.
Scorecard metrics by fleet goal
| Fleet Focus Area | Metrics |
| Productivity |
|
| Safety |
|
| Fleet Optimization |
|
| Compliance |
|
How to gamify driver safety
A good way to maintain driver buy-in is to use the Geotab Safety Scorecard for gamification. By using gaming techniques to motivate safe driving and long term engagement with safe behaviors, you can leverage insights from the scorecard to “gamify'' safety metrics within your fleet.
The Driver Safety Scorecard works using a traffic light color system, grouping drivers into colors (green, yellow and red) to show where they are on the spectrum in comparison to the rest of your fleet.
- Green report: Reward top drivers through simple recognition. Acknowledgement goes a long way toward retainment and overall job satisfaction. If your brand has swag, this is a great opportunity to use it to incentify top monthly drivers.
- Yellow report: Use this as an indication of which drivers are at risk of needing red level remediation. Compare green driver’s behaviours with yellow drivers, and provide coaching to those who need advice on how to improve their score. When improvement is seen, remember to recognize it. Positive reinforcement goes a long way.
- Red report: Coach drivers that don’t meet the standards outlined in your company’s fleet policy. It’s best to view these scores as opportunities to teach individual drivers instead of punishment. Bring these results to safety meetings to discuss the common areas for improvement.
One way to take scorecard gamification further is to connect scores to real-world outcomes for the driver. Geotab Vitality does this by converting daily behavior scores into earnings — drivers receive rewards from brand partners based on their performance across braking, speeding, acceleration, and cornering. The financial connection changes how drivers relate to their scorecard: it becomes something they actively check and improve, not just a number their manager reviews.
For a deeper dive into driver safety, read our Driver Safety Scorecard white paper.
Tips for designing your safety scorecard
There are several strategies you can take when designing your scorecard, such as:
- Rate each driver compared to the overall fleet average
- Compare drivers to fleet goals
- Focus on the return on investment (ROI). Put a cost to each behavior, e.g., wear and tear on tires from harsh braking and cornering or speeding over 65 mph
- Add a weighting to each rule, e.g. target speeding by putting more weight (30% +) on speeding in the total score
- Make your own category
- Score out of 100 (requires a quick calculation)
What is the Driver Safety Scorecard?
The Driver Safety Scorecard is a free Geotab Marketplace solution that focuses on three primary elements of unsafe driving:
- Aggressive driving
- Seat belt usage
- Speeding
These elements are used to generate a safety scorecard, which gives you the ability to view individual drivers’ habits.
To improve visibility into your fleet’s safety, download the Driver Safety Scorecard to your MyGeotab dashboard.
What could happen if you don’t use the Driver Safety Scorecard?
If you're not monitoring your drivers’ safety, there are several outcomes that could occur, including:
- Liability exposure as a result of risky and aggressive driver behavior
- Damaged goods
- Increased maintenance costs
- Decreased asset residual value
- Increased risk of DOT inspection violations
How effective are driver scorecards?
The number one reason driver scorecards are used is to help improve driver safety and manage high risk behavior. In addition to this, scorecards are effective for increasing fleet productivity, improving vehicle health and increasing driver compliance or reducing violations.
Driver scorecards provide an easy to understand visual of an organization's most at-risk drivers, presenting a real opportunity to make improvements.
Scorecards have several advantages for driver behavior management. The flexibility of a scorecard means that it can be tailored to the needs of the individual fleet. Additionally, they are objective measurements that provide a fair rating of all drivers.
Case studies on safety scorecards
Black & Veatch: Increased safety and fewer collisions
The consulting and engineering fleet, Black & Veatch, developed a custom scorecard to help identify at-risk drivers. Driver safety scores were reported each month to supervisors, management, and also employees. Through drivers scorecards and policy changes, Black & Veatch improved their average fleet safety score by 28% and lowered their collision rate from over 5 to 3 collisions per million mile (PMM). The number of high risk drivers was also reduced by 87%. Read the full case study.
Frontier Technologies
This Maritime-owned and operated company helps provide support and technical expertise to Canadian telecommunications and security companies. After using Geotab for 15 years, Frontier Technologies wanted to delve deeper into Geotab’s offerings to help use fleet data to their advantage. Using Geotab’s latest technology, Frontier Technologies was able to decrease speeding from 150 events per month to 50, which has helped greatly improve driver safety scores and the company’s carbon footprint. Read the full case study.
Conclusion
Driver safety scorecards are an excellent reporting tool for any fleets looking to create, track and improve fleet safety metrics.
Visit Geotab Community to ask questions or post your own success tips or stories to help others.
Subscribe to get industry tips and insights
Melanie Serr is a Senior Manager, Brand Communications for Geotab with an eye on fleet safety and all things tech.
Table of Contents
Subscribe to get industry tips and insights
Related posts


Crafting a fleet incident management plan that helps your municipality get ahead of claims
July 16, 2026
5 minute read
.jpg)
Marketplace Spotlight: Redefining Fleet Security with Matrix iQ
July 15, 2026
2 minute read
B.C.'s Dashcam Mandate Creates an Opportunity for Safer Roads Across Canada
June 5, 2026
2 minute read

B.C.'s new dash cam law: A six-month clock is about to start for commercial fleets
June 2, 2026
5 minute read