New study: Be alert to moose car crash risk
A study by University of Toronto students using Geotab’s Intelligence Data analyzed hazardous driving areas and moose car crash data
By Geotab
Dec 23, 2021

A 2018 study by University of Toronto students using Geotab’s Intelligence Data highlights the importance of being aware of hazardous driving areas, and particularly moose habitats. The risk of a moose car crash is no joke, especially considering the consequences. A collision with the animal which stands about 6 ft and weighing up to 1,500 lb could result in serious damage to a vehicle, such as shattering glass, destroying the windshield or roof, and even leading to driver fatality.
University of Toronto Students Leverage Geotab’s Intelligence Data
Students from the first-year Statistical Reasoning and Data Science course were asked to conduct a statistical analysis based on Geotab’s Intelligence Data from data.geotab.com and present their findings at a poster fair.
“Hazardous Driving Areas in Canada” was selected by the Geotab Data & Analytics team as the top presentation. Ruei-Hung Chen, Xuechun Qian, Zhenyu Xuan and Ziyang Li collaborated on this project looking at the severity of hazardous driving conditions in Canada.
Hazardous Driving Areas Dataset Identifies Areas Prone to Accidents
The study leveraged Geotab’s dataset on Hazardous Driving Areas. Geotab assigns a severity score based on several factors, including harsh braking incidents, accident-level events, and traffic flow in the area.
Municipalities and regional governments can use the data to investigate areas prone to accidents and inform decisions on road changes or new signage to improve safety.

Statistical reasoning and data science in action at the University of Toronto.
The Value of Open Datasets
Professor Nathan Taback, Associate Professor, Teaching Stream, Department of Statistical Sciences and Computer Science, and Director, Data Science Programs in Statistical Sciences, at the University of Toronto, explains the importance of datasets such as the Geotab Hazardous Driving Areas:
“These datasets provide detailed information about transportation in many countries which doesn’t seem to be readily available elsewhere.”
When asked what advice he has for people working with open datasets, Professor Taback says, “Make sure you understand how the data was collected and what the data represents. We were able to discuss our questions with Brenda who provided insight into what the data represented and how variables were derived.”

Geotab’s Brenda Nguyen and Fiona Zhao review research at the University of Toronto poster fair.
Study Finds Newfoundland and Labrador Has Highest Severity Score for Hazardous Driving
The study, carried out in early 2018, compares the severity score of each province in Canada and found that Newfoundland and Labrador was the most hazardous province for driving. The province with the lowest median was Manitoba.
In order to determine which province was the most hazardous for driving, the students first checked which province had the highest median severity score - Newfoundland and Labrador came up at the top. Then, to verify that Newfoundland and Labrador’s median severity score was indeed different than the other provinces, they conducted a series of hypothesis tests to compare the median severity score of Newfoundland and Labrador against the other provinces.
The students found that Newfoundland and Labrador’s median severity score was indeed the highest and statistically significantly different than the other provinces’ median severity scores.
They pointed to the prevalence of highway accidents in Newfoundland and the high number of moose vehicle accidents reported as a possible explanation for the higher severity of hazardous driving.
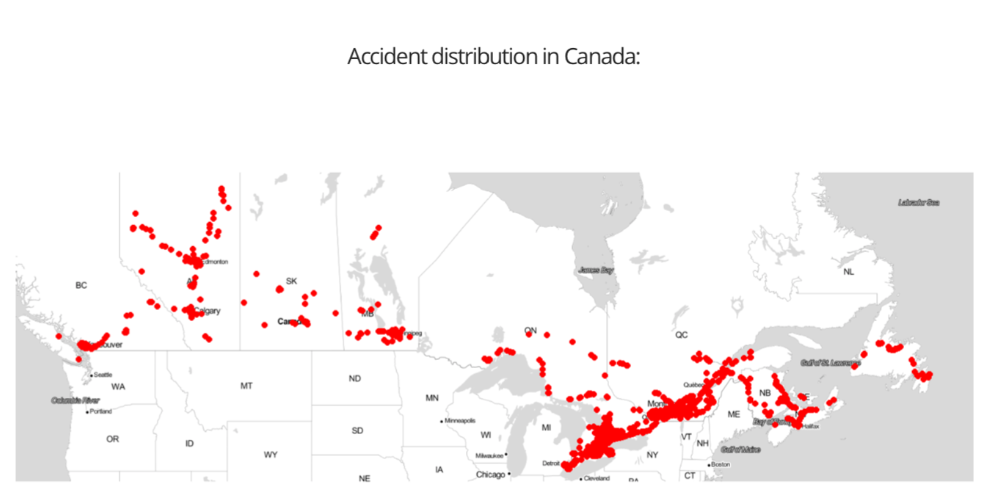
Data visualization from “Hazardous Driving Areas in Canada” presentation by Ruei-Hung Chen, Xuechen Qian, Zhenyu Xuan and Ziyang Li.
Summer Brings Threat of Moose Car Crash to Roads
According to data from the Government of Newfoundland Labrador, the most moose-vehicle collisions occur in the months of June, July and August, with July being the highest. Similarly, Maine Department of Transportation historical data from 2016-2017 shows the highest number of moose crashes in June, followed by May, September and July. A time of day analysis shows that 7-9 p.m. in the evening is the most frequent time for collisions.
Moose populations exist in wooded areas across Canada, in Alaska, Colorado, the Northeast United States, as well as in northern Europe, but they are known to gather by and travel along roads and highways. Moose come out to roadways for many different reasons, such as feeding on roadside grasses, avoiding flies, and using the open paths for moving between areas.
Areas for Further Research
Based on the study findings, Professor Taback indicates that it would be interesting to pursue further research to reveal areas that may pose an increased risk of accident or injury by combining Geotab’s hazardous driving data with other data sources (Geotab and non-Geotab).
The new availability of data from diverse organizations such as Geotab presents exciting opportunities for research.
Professor Taback notes, “The most exciting thing is the emergence of the role that statistics is playing in the emerging field of data science. This new field includes statistics, machine learning, and technology to handle large amounts of data.”
Learn more about Geotab Intelligence Data by visiting data.geotab.com.
Related:
Everything You Need to Know About data.geotab.com
Geotab Announces Winners of Data Challenge
Subscribe to get industry tips and insights
Geotab team
Table of Contents
Subscribe to get industry tips and insights
Related posts
B.C.'s Dashcam Mandate Creates an Opportunity for Safer Roads Across Canada
June 5, 2026
2 minute read
B.C.'s new dash cam law: A six-month clock is about to start for commercial fleets
June 2, 2026
5 minute read
Reefer trailer temperature monitoring: How it works, systems, and fleet benefits
May 26, 2026
4 minute read
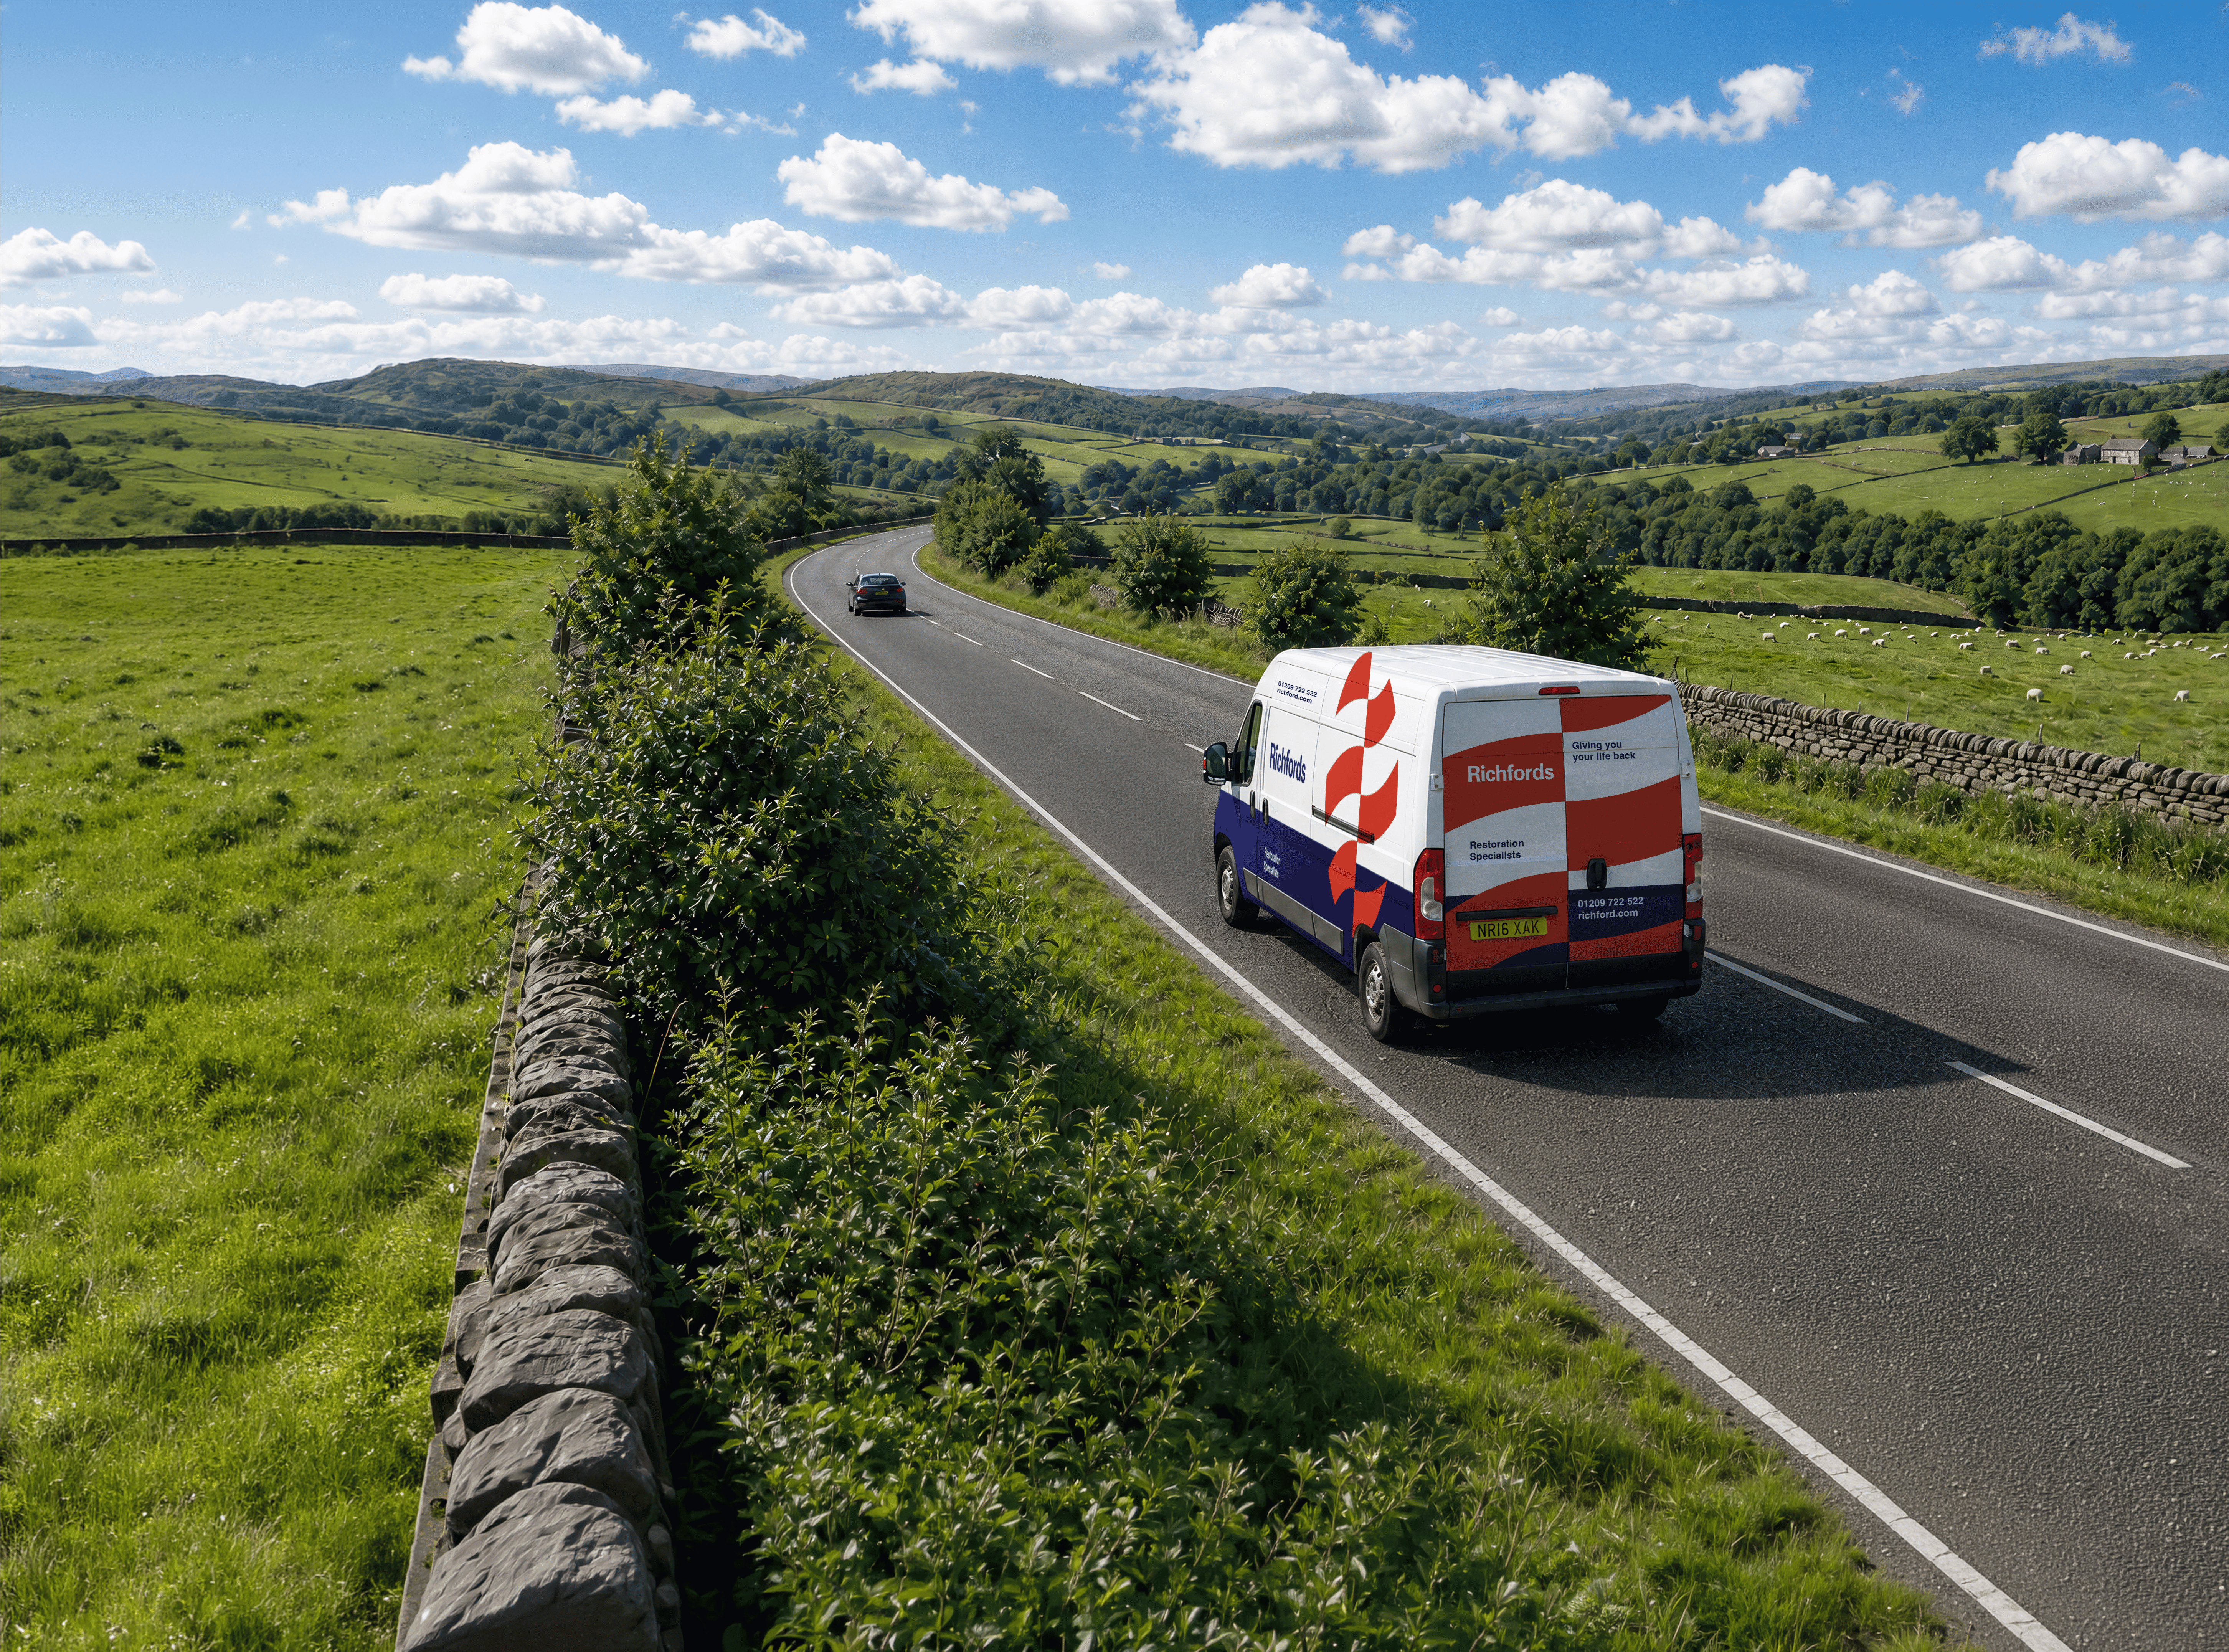
Fleet Safety Results: Richfords Cuts Speeding and Harsh Driving with Geotab Vitality
May 11, 2026
3 minute read