Everything you need to know about data.geotab.com
Read a quick intro to data.geotab.com — how it works and an overview of the datasets, including smart city and intelligence data.

By Mike Branch
Vice President, Data and Analytics at Geotab
Apr 24, 2023

Each day, all over the world, there are hundreds of thousands of connected vehicles driving — gathering critical details on road condition, driving patterns, and even weather. How can smart cities and businesses connect with this intelligence? Geotab has made these insights available on a new website. Read this post for a quick intro to data.geotab.com.
Launched at GEOTAB CONNECT 2018, data.geotab.com offers free aggregated data to users via Google BigQuery. Billions of data points from over one million Geotab connected vehicles are collected every single day through Geotab GO devices. The datasets and tools combined provide valuable insight for use by public and other private organizations to improve safety and efficiency, optimize operations, and discover new solutions for infrastructure challenges such as traffic congestion and poor road conditions.
For a recap of what happened at GEOTAB CONNECT, please see this blog post.
See also:
Simplifying data exploration and visualization with Geotab Ignition
Empowering business with data intelligence: Fiona Zhao interview
Data.geotab.com: How it works
The data collected by Geotab is securely sent to our gateway servers using a cellular network and is then integrated into our data environment in Google BigQuery. Here, users have free access to the aggregated data collected from all vehicles from one central location. To gain access to the Intelligence Data BigQuery project, simply sign up on data.geotab.com with a gmail account.
One of the key benefits of the datasets on data.geotab.com are the insights that cover a variety of different fleets and industries. Customers go beyond their own data environment and see the big picture of trends, patterns and behaviors on a much larger scale with rich location, engine and vehicle behavior data.

The datasets: Smart City and Intelligence Data
When you visit the website, you will notice that the data is grouped into two major categories: Smart City and Intelligence Data. As the number of datasets continue to grow, the Smart City category will focus primarily on insights that are most relevant to government organizations such as municipalities and school boards. The Intelligence Data will contain some of the same datasets, however it will also include critical insights for organizations such as fleets, weather networks, data organizations, and much more.
A third selection from the categories is the Data Science Package — a newly introduced data solution for Geotab’s larger customers. The package allows customers to use the platform and take action on their own volumes of data and the datasets available on data.geotab.com
Below, we give a quick overview of each of the datasets, what information they hold, and how they could be used. Note: this isn’t an exclusive list of use cases.
Hyper-local Barometric Pressure
About this dataset: The Hyper-local Barometric Pressure dataset identifies the ambient air pressure data in specific areas, captured through on-board pressure sensors.
Significance: Air pressure changes as a function of elevation, weather patterns, and temperature and impacts weather in a reciprocal manner. Measurements, including the on-board sensors, are used by the engine control unit (ECU) to rebalance and adjust the air-to-fuel ratio for current conditions. This ensures, to the extent possible, optimized combustion efficiency regardless of where the vehicle is driving.
How this data could be used: This data can identify how changes in air pressure are affecting the combustion efficiency of both gasoline and diesel engines, and the brake thermal efficiency of diesel engines. It can develop predictive maintenance, fuel efficiency, and consumption estimations. It can also predict weather and track storms.
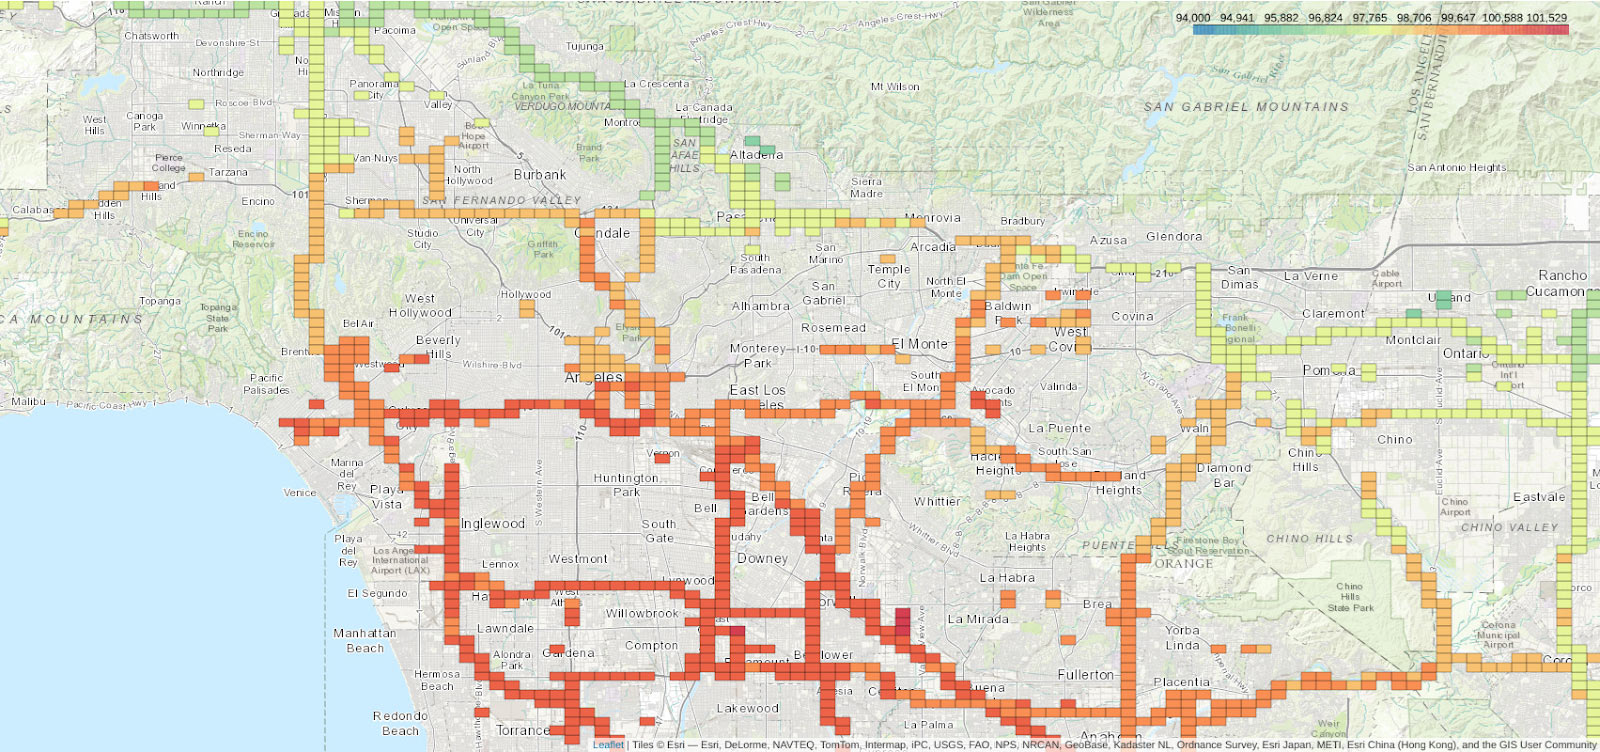
The map above shows air pressure (Pa) on Dec 5 in Los Angeles.
Hyper-local Temperature
About this dataset: The Hyper-local Temperature dataset pulls in temperature data from all vehicles where Geotab is able to extract the ambient air temperature.
Significance: Weather information is usually gathered from various websites and weather channels, which does not represent variable weather dynamics within a large city. This dataset can help users plan for alternate routes based on potential icing conditions on nearby bridges and roadways. For city officials, it can provide insight into urban planning and design, potential road hazards, transportation infrastructure, and much more.
How this data could be used: This data can be useful for detecting in real-time which bridges remain above freezing temperature. This allows users to direct maintenance crews to areas of highest priority based on current and expected conditions, and notify citizens of potentially dangerous road conditions.
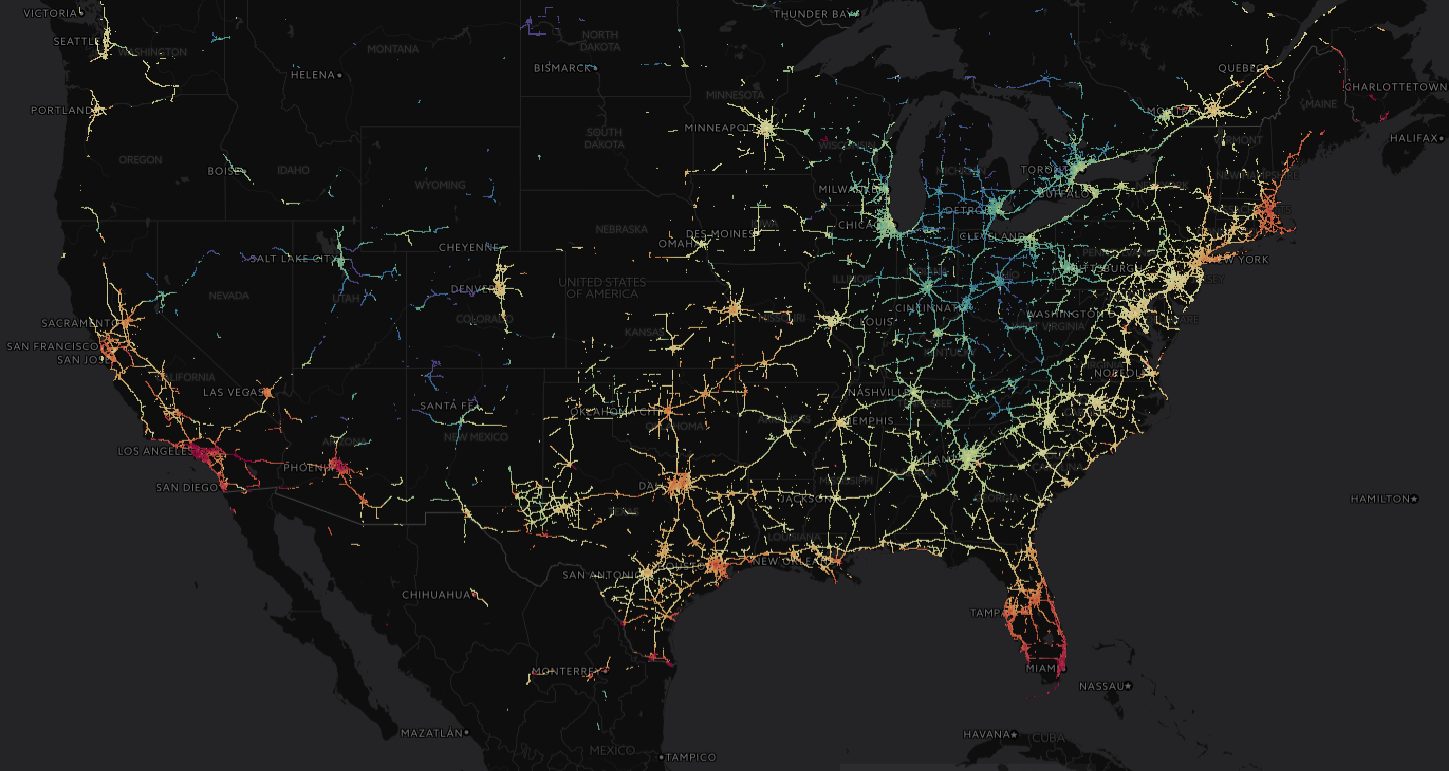
One hour of Geotab temperature data in the U.S.
Areas of Idling
About this dataset: Areas of idling are intended to show where vehicles are stopped in place and using fuel. The data is broken down by vehicle type, class (where applicable), and fuel type.
Significance: Idling an engine can increase vehicle maintenance costs with excessive wear and tear on cylinders, spark plugs and the exhaust system. Furthermore, an idling engine produces twice the emissions as a moving car. By monitoring idling time and consciously making an effort to reduce it, it helps the environment, finances, and your own health.
How this data could be used: This data can be useful for monitoring problematic areas to help reduce idling and identifying types of vehicles that are contributing to high idling times in problematic areas.
.png)
Map of areas of highest idling in Oakville, Ontario (red indicates longer idling times).
Cell Coverage Dark Spots
About this dataset: The Cell Coverage Dark Spots dataset is intended to show a city where there are issues with cellular coverage (regardless of carrier).
Significance: Internet of Things (IoT) devices are becoming more reliant on uninterrupted connectivity to the Internet, often from cellular network. Working towards building the city of tomorrow means it is important to ensure IoT devices are capable of communicating everything, in real-time, 24 hours a day. By analyzing “dark spots” and problematic areas that exist, it becomes easier to understand where these areas are within an urban infrastructure to ensure that connectivity issues are resolved in the future.
How this data could be used: The data can be useful for identifying which specific areas have cell coverage dead zones. It can also help identify the possible causes of specific dark spots, topography, network overlaps, or other transmission signals such as satellites or lack of cell towers to determine a feasible solution.
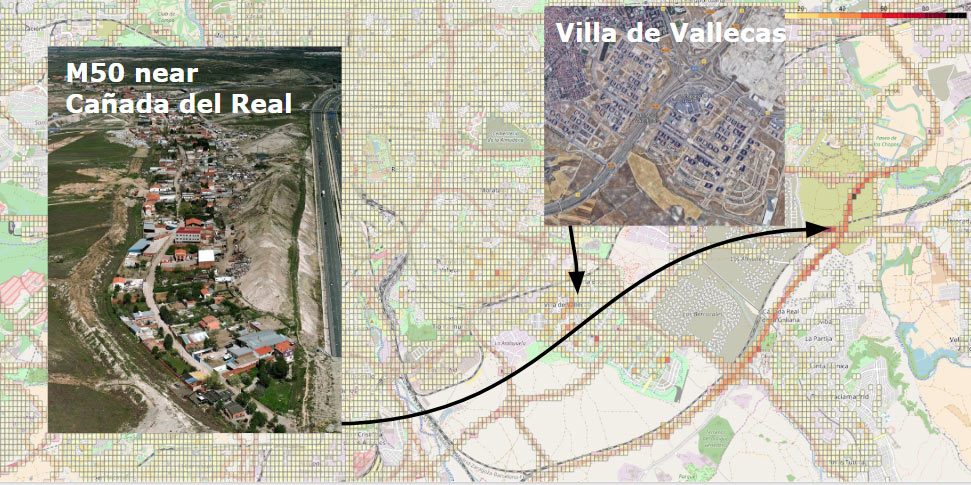
Cell coverage dark spots in Madrid, Spain
Hazardous Driving Areas
About this dataset: This dataset identifies accident level events and harsh braking within a specific area. Each area is assigned a severity score that is based on the frequency and severity of occurrences, which is an intersection of the number of accident level events, harsh braking events and traffic flow in the areas.
Significance: According to the World Health Organization (WHO), over one million people die every year as a result of road traffic crashes. As the global population continues to rise, the volume of traffic accidents will continue to be a growing concern for communities.
A growing number of cities, including Chicago, Los Angeles, Toronto and Mexico City, among others, have embraced the Vision Zero movement — making a commitment to achieve zero traffic-related fatalities and serious injuries. Data collection and analysis is critical for making informed decisions on funding and infrastructure changes related to safety. The City of Toronto has stated that they will employ “a data-driven and targeted approach, focusing on the locations where improvements are most needed.” Geotab is a Vision Zero Network Supporter.
How this data could be used: The information in the Hazardous Driving Areas dataset can be used to identify areas that are prone to incidents and can help prioritize areas and determine which roads need improvements and new signage. It can also help analyze and interpret the correlation between the frequency of incidents in a hazardous areas and the characteristics of that area including areas under construction, events in hyper-local areas, railway crossings with busy roads, and lane merges in close proximity to exits.
.png)
Hazardous driving hot spots in the City of Toronto.
Road Impediments
About this dataset: The Road Impediments dataset helps identify potential road hazards using captured z-axis (up/down) accelerometer measurements — located within Geotab’s telematics GO devices.
Significance: Z-axis variations are indications of abnormalities in the driving surface including temporary obstructions, potholes, speed bumps and general road surface issues. Our hope is that the combination of current road condition measurements and an understanding of heavy-duty vehicle traffic will be a valuable tool for pavement preservation programs.
How this data could be used: This data can be useful for preventative maintenance and pavement preservation. It can also be used for route optimization to reduce the impact of road conditions on vehicle operating costs.
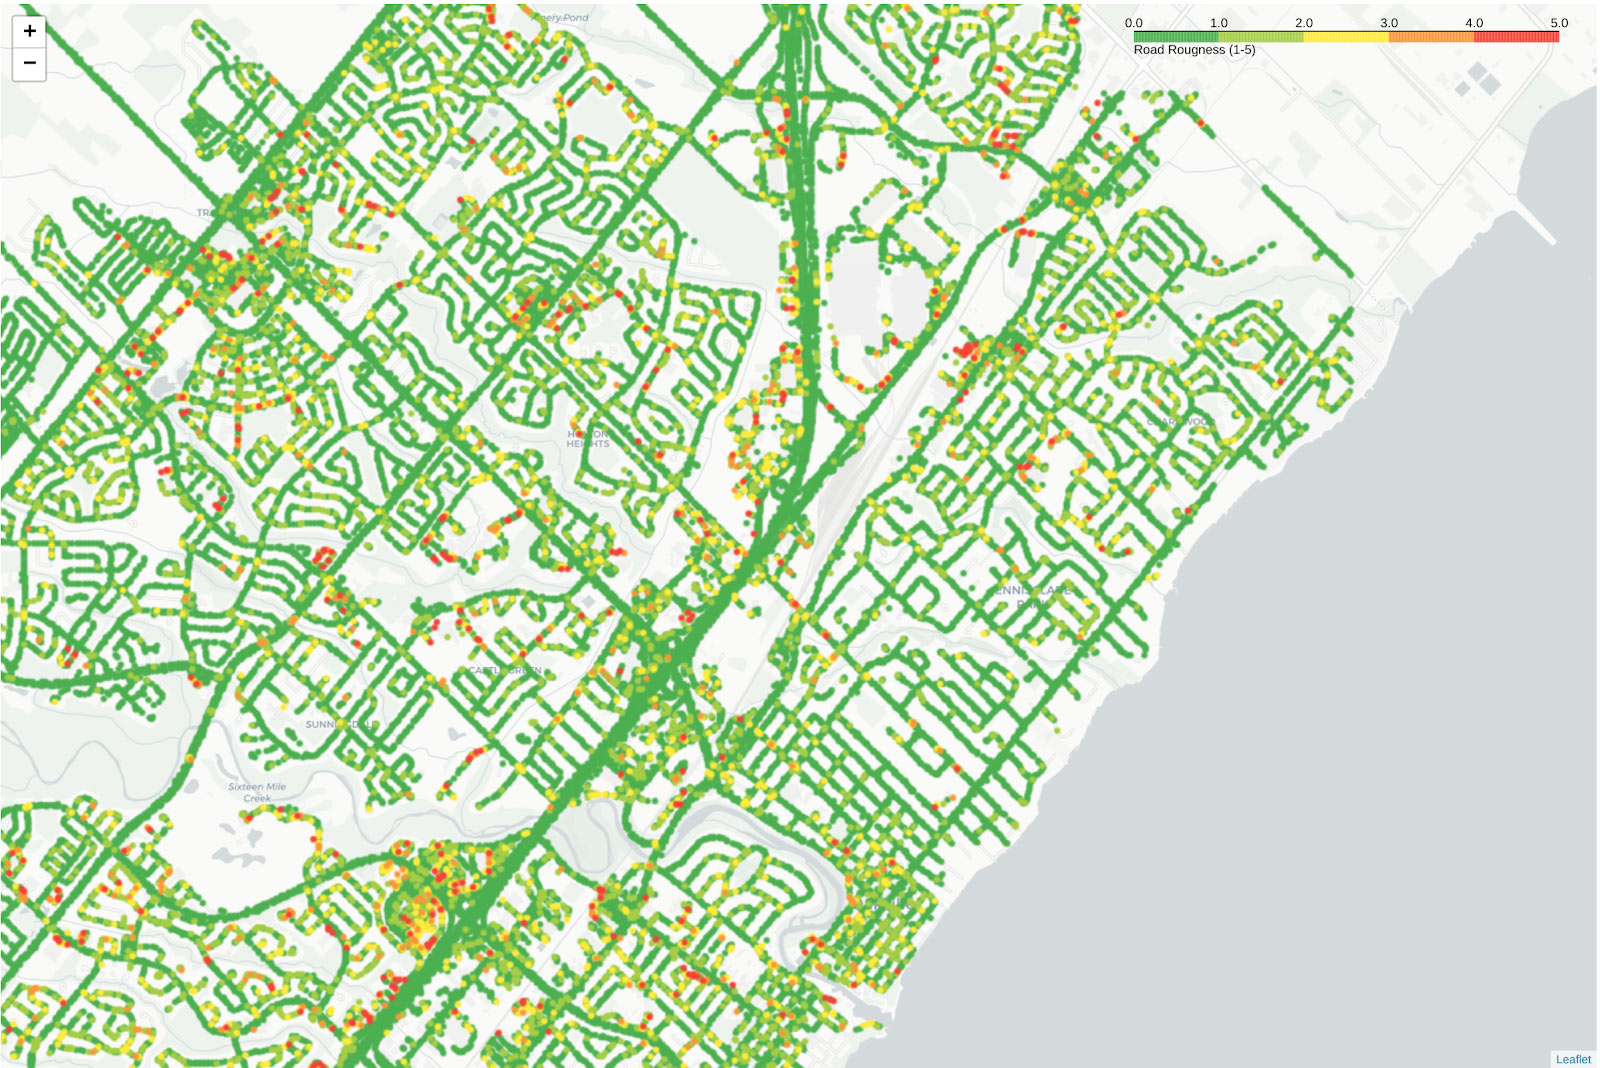
This color-coded map shows smooth road surfaces in green, while red locations are areas of higher accelerometer activity.
Searching For Parking
About this dataset: This dataset identifies different areas within a city where drivers are experiencing a difficult time searching for parking.
Significance: If you drive, you know how painful searching for parking is. Studies have revealed that searching for parking not only causes anger and frustration, but also contributes to additional greenhouse (GHG) emissions and traffic congestion.
How this data could be used: This data can be used to identify areas with high demand for parking which will assist with city management parking developments and help create additional services such as discounted fees, parking reservations, and security. It can also help identify areas where drivers are spending their time prior to parking, which can assist with the optimization and adjustments of parking signage, road operations, maintenance, and road infrastructure design.
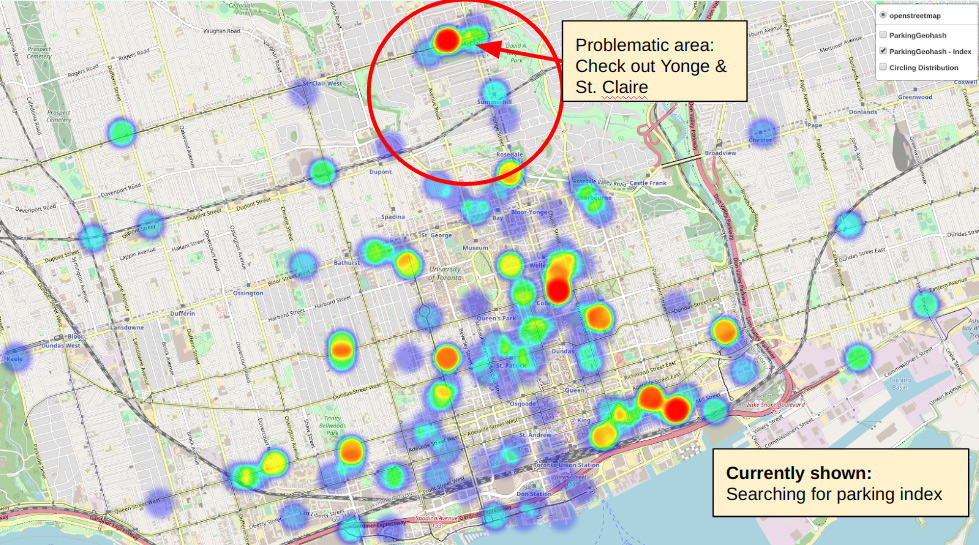
Problematic areas based on the Searching For Parking Index. The red spots indicate areas where Toronto drivers have difficulty searching for parking.
Fuel Station Metrics
About this dataset: The Fuel Station Metrics provides the location of fuel stations and various metrics associated with these stations including fuel type, vehicle type, popular hours, and amount of time spent at the station.
Significance: Combining metrics such as frequency of customer visits, distribution by vehicle class, fuel type available, proximity to highway, and number of fuel stations available, it becomes easier for commercial fleets, municipalities, and fuel station managers with their decision-making process.
How this data could be used: This data can be used to identify areas where fuel types are lacking. With the dataset, recommendations for adding site locations for electric vehicles (EV), adding a new product line to the existing fuel stations, and opening new fuel stations with required fuel types could be provided. For heavy-duty fleets, segmenting station peak times by vehicle class, and then incorporating that information into a mobile app would allow drivers to select their ideal stations to optimize efficiency and save time.
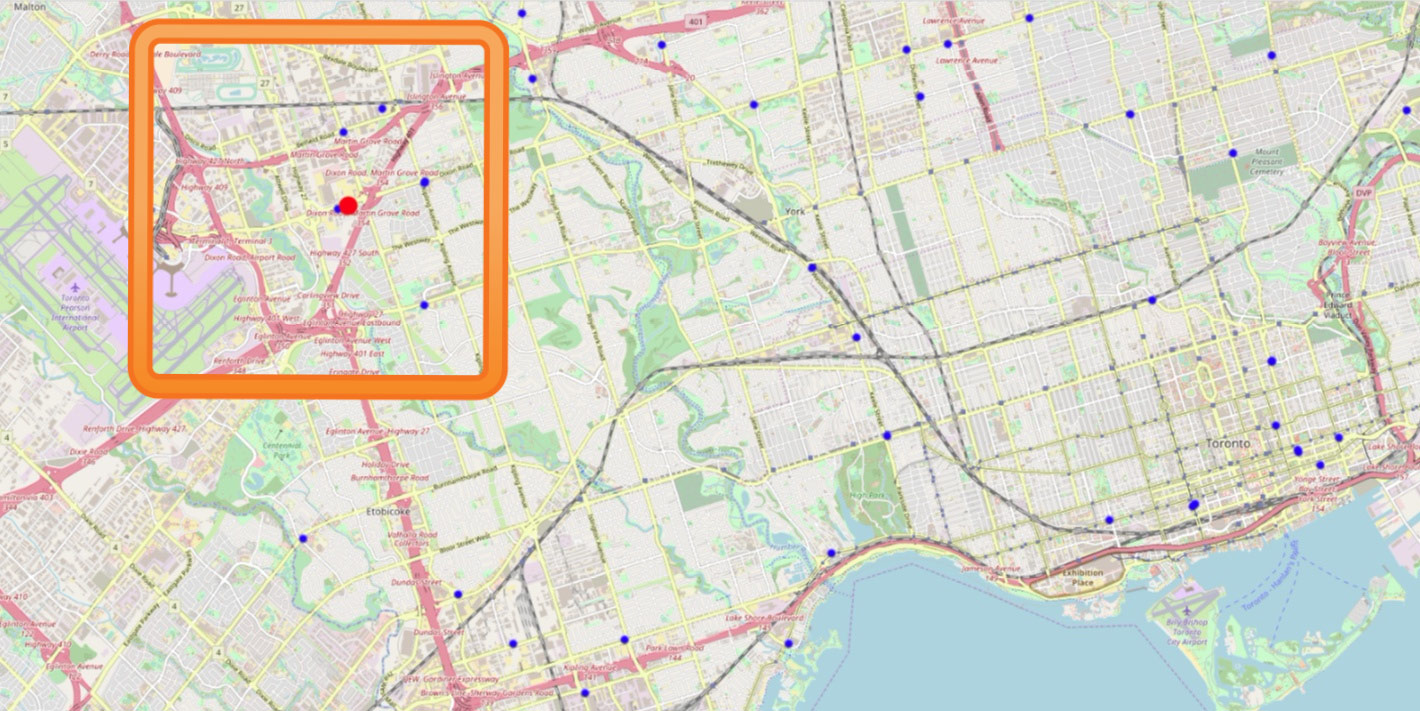
This map of fuel stations in Toronto indicates the most visited fuel station with the red circle. It is located within an area where three major freeways intersect.
Service Center Metrics
About this dataset: This dataset provides the location, frequency of visit to the service center, the composition of vehicles being serviced, and the average time spent for a repair based on aggregate service center visits.
.png)
Significance: Customers can easily locate the closest service centre based on location, the best average cycle time, broken down by vehicle type, or any other customized criteria from the dataset.
How this data could be used: The data can provide fleet managers with the information they need to send their employees to the closest service centre with the shortest cycle time for their type of vehicle.
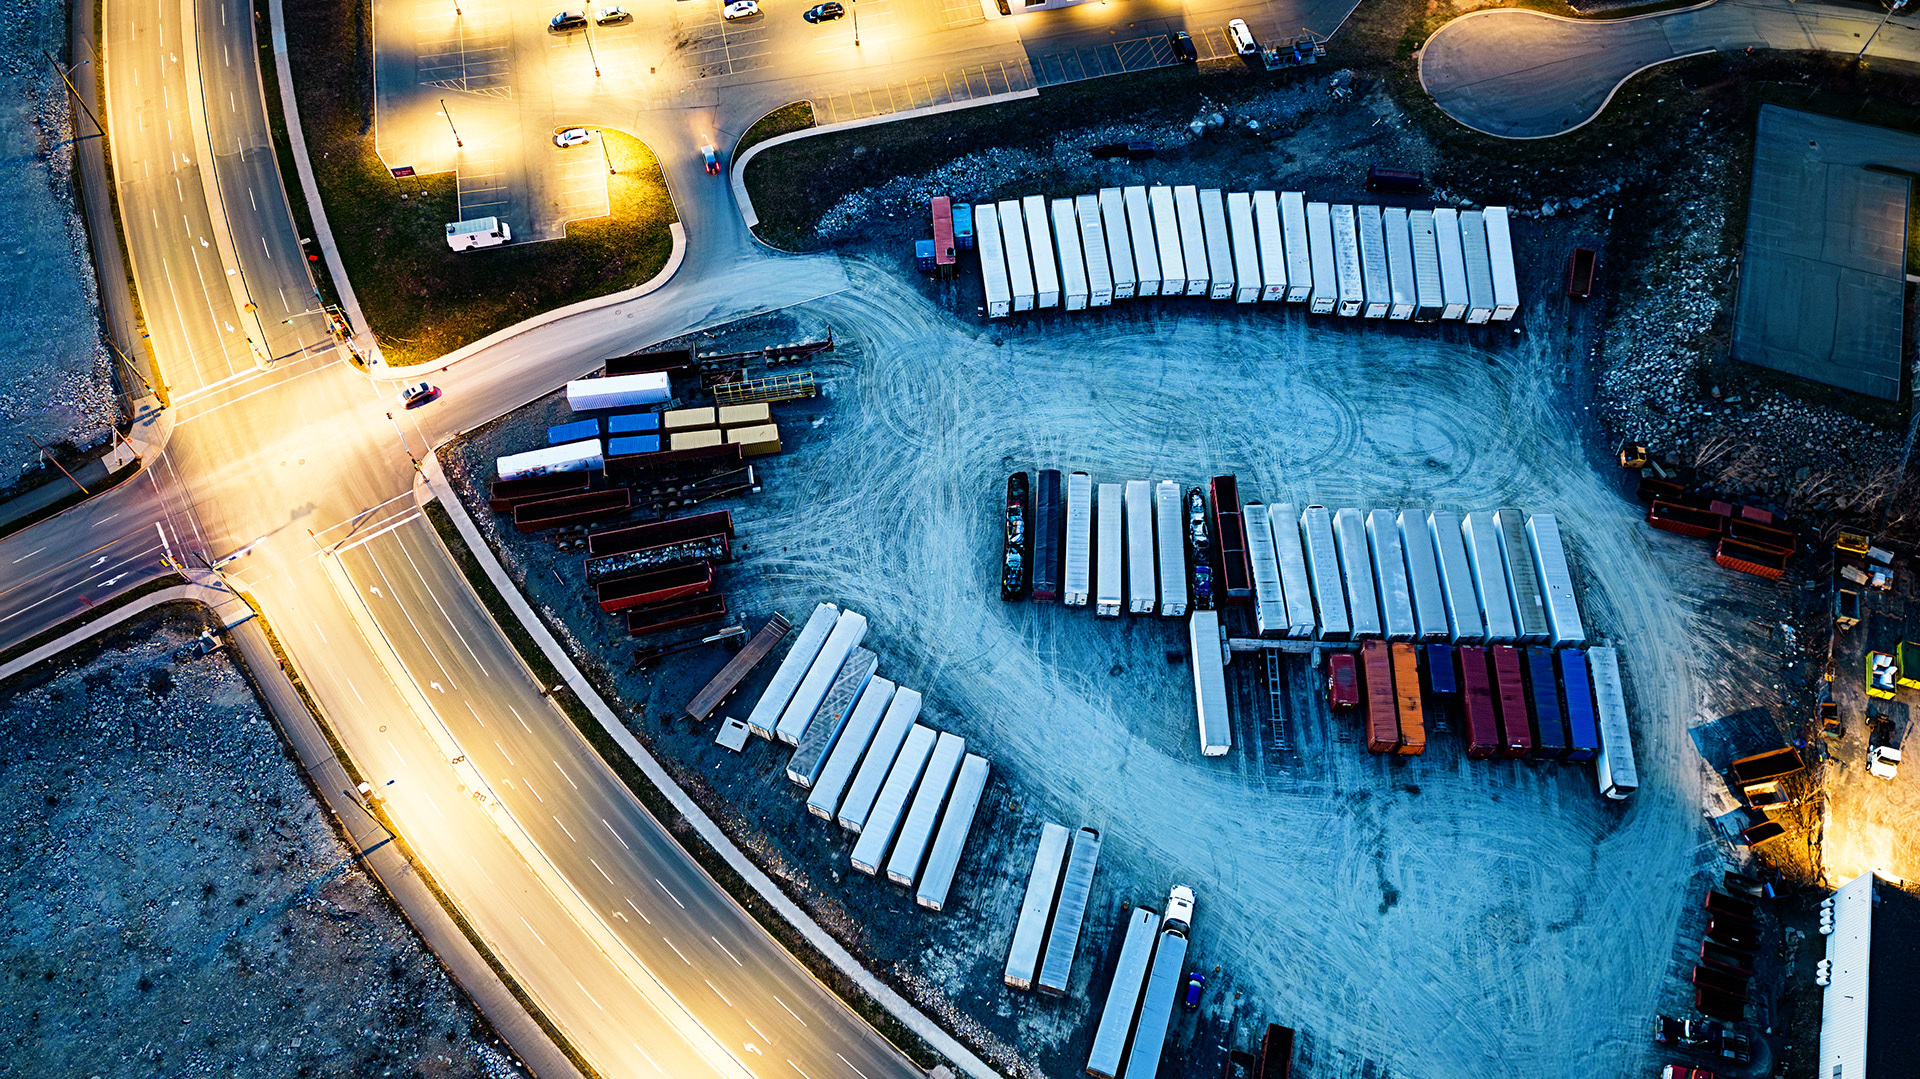
Truck Parking Locations
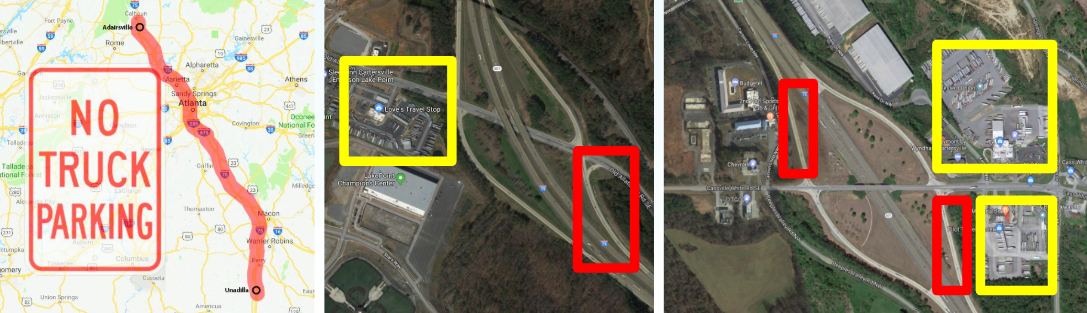
About this dataset: This dataset provides locations where heavy duty trucks (class 7 and 8) usually park.
Significance: Rules mandate rest periods and breaks for commercial heavy vehicle (CHV) to reduce driving while fatigued, a factor that contributes to motor vehicle crashes. With accurate information about public parking spots, drivers won’t be left with the dilemma of either continuing to drive fatigued, or to park illegally along ramps and road shoulders.
How this data could be used: The data can provide the latitude and longitude of truck parking locations that can help CHV operators find parking spaces that are closest to them. The data can also be used for a mobile app to provide the nearest truck stop locations to your location (independent of chain), and an on-demand method of looking at which ones are the busiest/least busiest.
A Geotab analysis of heavy truck parking at a busy interchange near Atlanta Georgia found trucks at popular stops such as TravelCenters of America, Flying J, and Loves. It also found trucks parked in unsafe areas likely due to insufficient parking availability, such as along the on- and off-ramps (see image below). Parking intelligence data can be used in numerous ways, such as for determining new locations for safe truck parking locations, or informing policy decisions and new regulations.
Conclusion
Visit data.geotab.com today to learn more about the datasets and explore the possibilities. If you are looking for a different dataset not provided, please submit a request for an aggregate dataset on our Contact Us form.
Related:
Geotab announces winners of data challenge
Geotab partners with city of Columbus for smart Columbus operating system insights
Subscribe to get industry tips and insights
Mike Branch
Vice President, Data and Analytics at Geotab
As Geotab’s Vice President of Data and Analytics Mike Branch leads the development for solutions that enable insight from over 5.8 million connected vehicles and 100 billion telematics records that Geotab processes daily.
Table of Contents
- Data.geotab.com: How it works
- The datasets: Smart City and Intelligence Data
- Hyper-local Barometric Pressure
- Hyper-local Temperature
- Areas of Idling
- Cell Coverage Dark Spots
- Hazardous Driving Areas
- Road Impediments
- Searching For Parking
- Fuel Station Metrics
- Service Center Metrics
- Truck Parking Locations
- Conclusion
Subscribe to get industry tips and insights
Related posts

Closing blind spots in cargo security with a 360 fleet camera system
July 22, 2026
3 minute read
The safest mile in field service is the one nobody drives
July 22, 2026
2 minute read

Best small fleet management software providers and how to choose one for your business
July 16, 2026
8 minute read

Why field service routing decisions are costing you more than fuel (and how to fix it)
May 14, 2026
4 minute read
Cargo theft prevention has entered the AI era. Is your fleet keeping up?
May 11, 2026
4 minute read