Decrease in traffic congestion helps to increase efficiency of essential commercial vehicles during COVID-19 pandemic
Connected vehicle data analysis from Geotab highlights changes in congestion and vehicle speed in seven U.S. cities
March 2, 2022
•1 minute read
.jpg)
- There has been an average road speed increase of 16 percent.
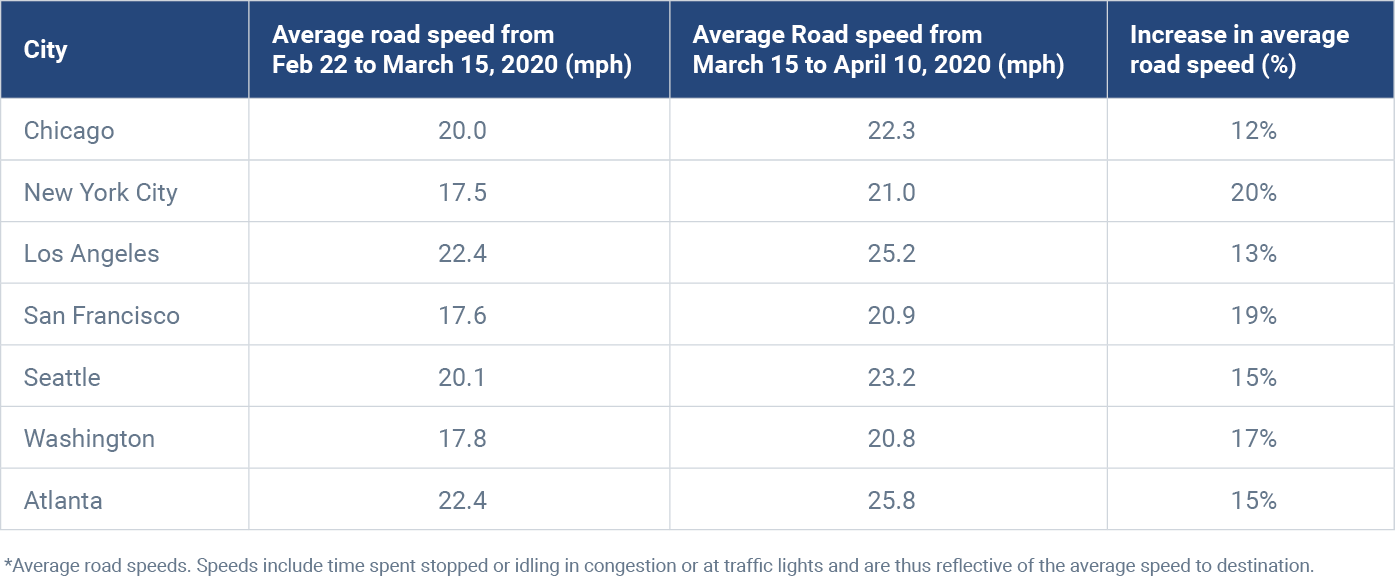
- New York City has shown a 20 percent increase in average road speeds, the most significant increase of the seven cities.
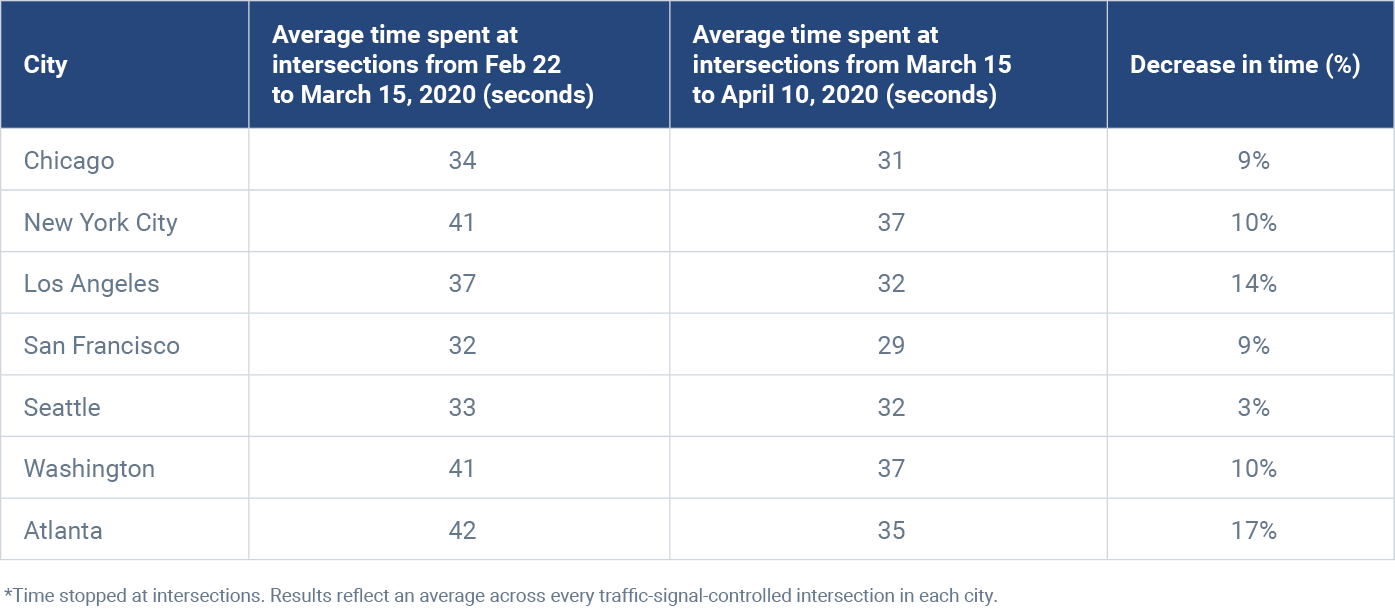
- There has been a significant decrease in the time stopped at intersections across all seven cities, with Atlanta having the largest reduction of approximately 17 percent.
TORONTO, ON - April 14, 2020 - Geotab, a global leader in IoT and connected transportation, today revealed new data insights highlighting the impact that COVID-19 has had on commercial vehicle activity in seven major U.S. cities. The data, which is processed from more than 2 million Geotab connected vehicles worldwide, shows an increase in average commercial vehicle speeds and a reduction in time spent at intersections compared to averages from February 22, 2020 to March 15, 2020, indicating reduced congestion in these cities following regional stay-at-home orders.
“Now more than ever, commercial vehicle drivers are tasked with moving essential goods across the country to help ensure that U.S. citizens have access to necessities like groceries, toiletries and more,” said Mike Branch, Vice President of Data and Analytics at Geotab. “Through our analysis, we have seen a noticeable decrease in traffic congestion based on average speeds and time spent at intersections. This means that with less traffic on the roads, commercial vehicles are able to travel through typically congested major cities in a more efficient way, allowing these essential drivers to get where they are going quicker.”
According to the analysis, the U.S. city with the largest increase in average road speeds was found to be New York City, moving from an average speed of 17.5 mph to an average of 21.0 mph - a 20 percent increase. San Francisco and Washington had the second largest increase in average road speeds.
In addition to average road speed, the analysis also examined the average time stopped at city intersections after March 15, 2020 compared to average times from February 22, 2020 to March 15, 2020. The city with the largest reduction in time spent at intersections was Atlanta at 17 percent, with an average of 35 seconds spent at an intersection compared to 42 seconds before March 15. The city that has shown the smallest reduction in time spent at intersections is Seattle, with a three percent difference since before March 15.
“Examining connected car datasets at the city level helps provide some clarity and understanding about what is happening in our communities during unprecedented times such as this,” added Branch. “As citizens across both the U.S. and the world continue to stay home, our support for frontline essential workers continues to be of the utmost importance.”
To learn more about Geotab’s key COVID-19 data insights, visit the Geotab blog.
To access visual assets, click here.
Media Contact
Nicole Riddle
Media Relations Manager
pr@geotab.com
About Geotab
Geotab is a global leader in connected operations, video telematics and AI-powered insights. Trusted by more than 100,000 customers — from small and mid-size fleets to Fortune 500 enterprises and public-sector organizations, including the U.S. federal government — Geotab connects approximately 6 million vehicles and assets and processes 100 billion data points daily. With ISO/IEC 27001:2022, SOC2, FIPS 140-3 and FedRAMP authorizations, Geotab's open platform and partner ecosystem unify safety, compliance and operations in a unified system. Our mission: a safer, more efficient and more sustainable world in motion. Learn more at www.geotab.com and follow us on LinkedIn or visit Geotab News and Views.
GEOTAB and GEOTAB MARKETPLACE are registered trademarks of Geotab Inc. in Canada, the United States and/or other countries.
Geotab in the News
Related News

Geotab and Hyundai partner to deliver hardware-free, native telematics integration
March 30, 2026
2 minute read
September 3, 2025
2 minute read
.jpg)