The impact of COVID-19 on congestion and commercial traffic in cities
Learn how COVID-19 is impacting congestion and commercial traffic in cities.
Mar 8, 2022
As a result of the COVID-19 outbreak, there has been a significant drop in commercial vehicle transportation in many areas throughout North America. While macro-level trends are important to consider because the real-time insights can support public and private sector decision-making on effective resource allocation, analysis at the city level can also reveal important insights. Geotab has examined commercial transportation activity at the city level in order to provide visibility to our fleet customers regarding the impact of COVID-19 on congestion and driver safety in different cities.
Geotab will be updating this blog post weekly as we believe this data can and should be combined with other datasets to support government response, fleets and the general public. You can access COVID-19 related datasets for free at ignition.geotab.com.
See also:
- The impact of COVID-19 on commercial transportation and trade activity
- What if the reduction of CO2 emissions didn't end with COVID-19?
- How COVID-19 is impacting the U.S-Canada border
Weekdays have become weekends
The Geotab Data & Analytics team examined traffic-signal controlled intersection metrics in seven major cities in the U.S. and Mexico City. At each intersection, several metrics were computed including the average speed through the intersection, average number of stops, average stop time and percentage of vehicles required to stop at an intersection either due to traffic signals or congestion. Once aggregated to the city level, this provides a clear indication of congestion within a city.
Prior to mid-March, on a weekday in New York, commercial vehicles would spend an average of 42 seconds stopped at an intersection compared to 37 seconds on a weekend. What is evident in the heat map below is a clear blending of weekday and weekend metrics rolling into an average of 37 seconds stopped, regardless of what day of the week it is, indicating a significant decrease in congestion.
Note the vertical lines that indicate less congestion on Saturdays and Sundays prior to mid-March virtually disappear in several cities such as Atlanta, Chicago, Los Angeles, New York, and San Francisco.
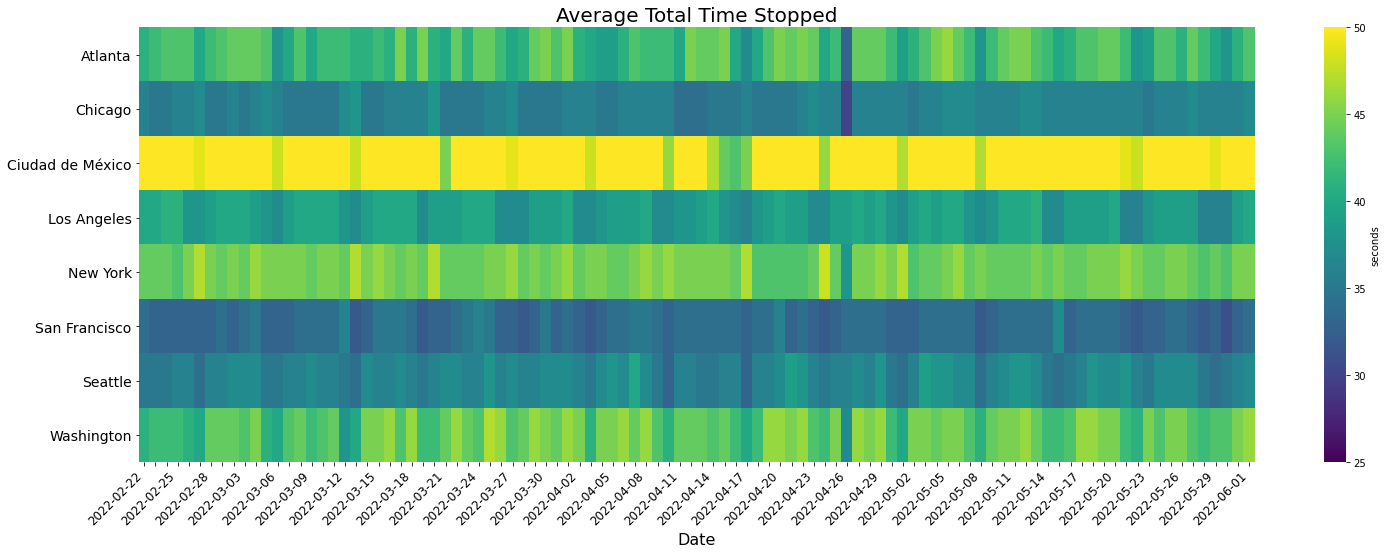
Figure 1: Average total time stopped at an intersection.
See also: How Covid-19 is impacting U.S.-Canada border crossing times
As an example, let’s take New York City’s hour-by-hour average intersection stop times — you can clearly see how weekdays and weekends have blended together after March 15, and the morning and evening rush hour spikes have all disappeared
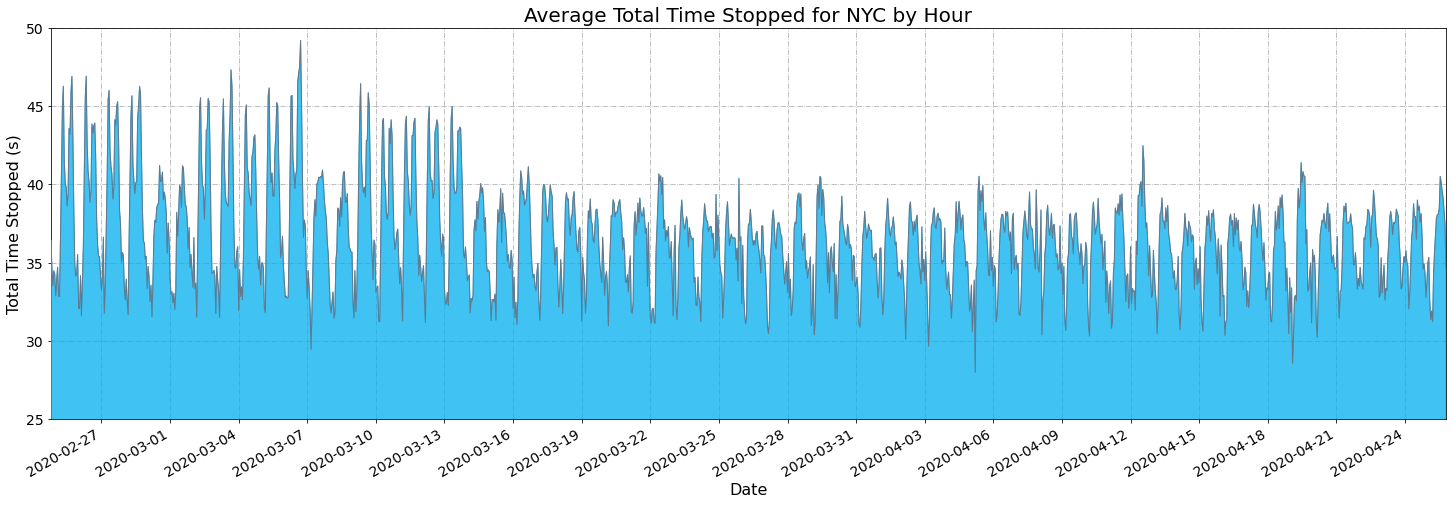
Figure 2: Average total time stopped at intersections in New York.
In addition to a decrease in stop times at intersections, the data shows an increase in average speed as well, and a similar blending of average speeds between weekends and weekdays.
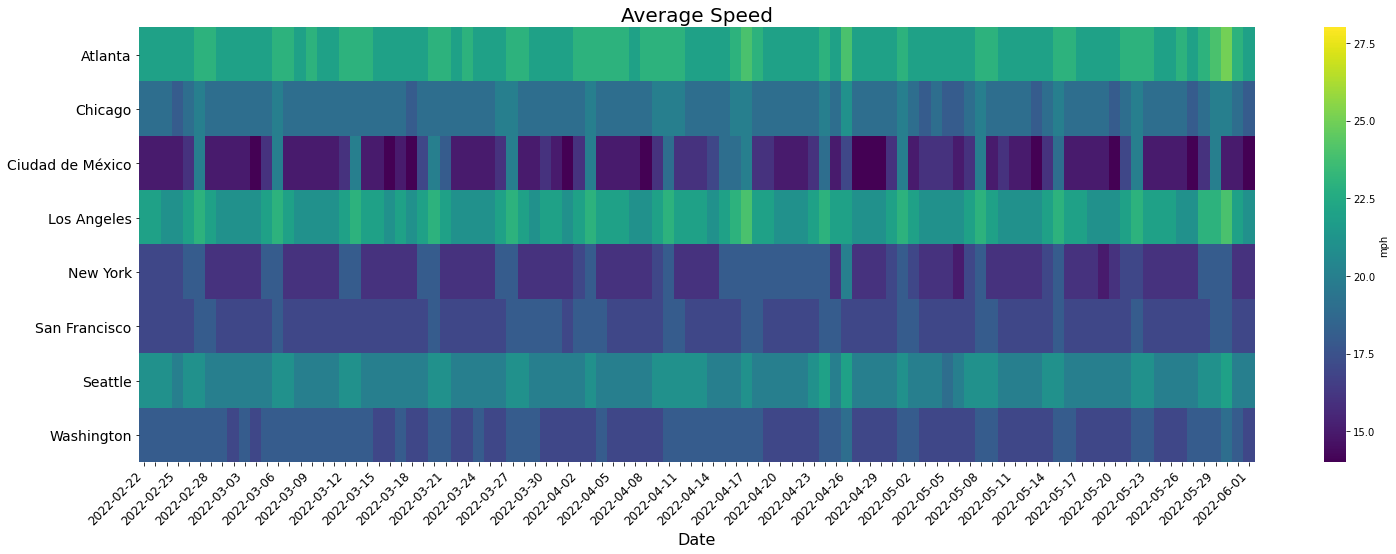
Figure 3: Average speeds based on cities.
Rush hour evaporates
In New York City, there is an increase in the average speed through intersections across the city after March 15. Despite New York City being one of the busiest places in the world, the notion of a rush hour seems to have been virtually eliminated. Average speeds throughout the course of the day compared to nighttime are still drastically different. However, two dips in speed for the morning and evening rush hour which were previously apparent have virtually disappeared.
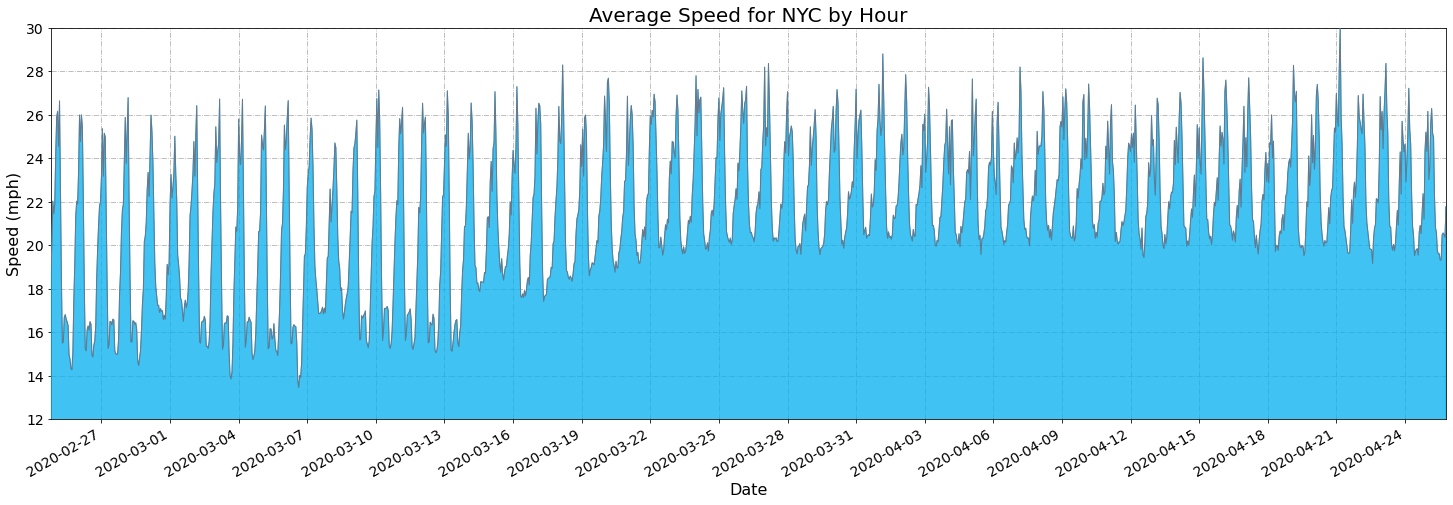
Figure 4. Intersection trips by hour in New York City.
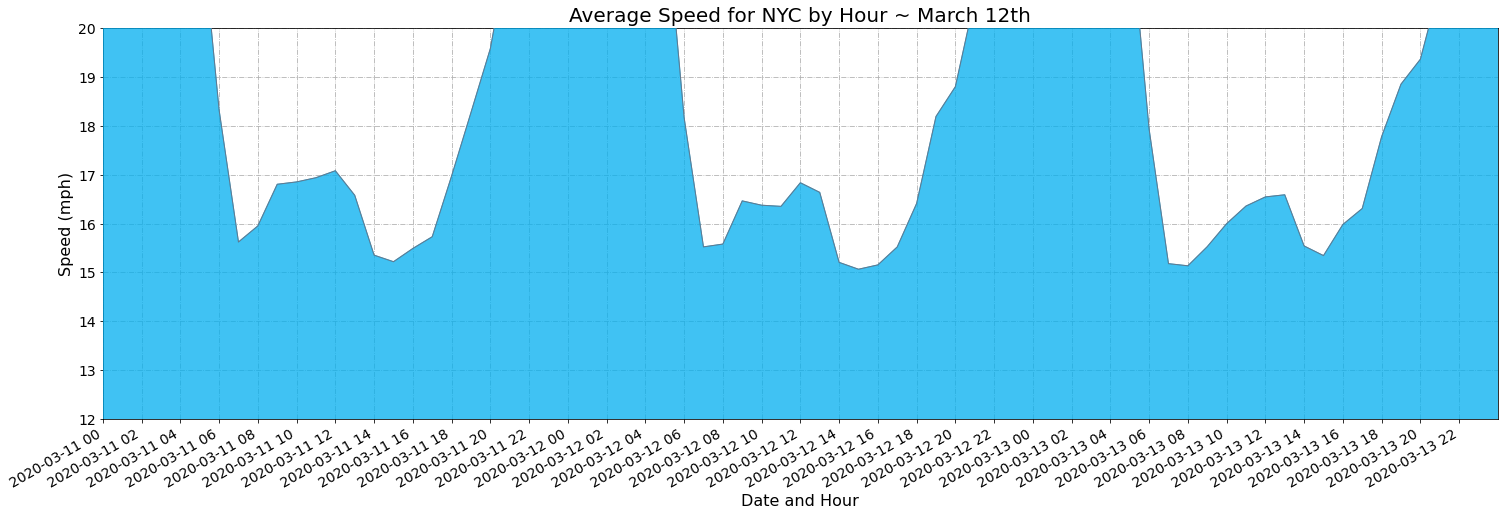
Before March 15: Rush hour still exists as the two speed valleys indicate morning and evening rush hour.
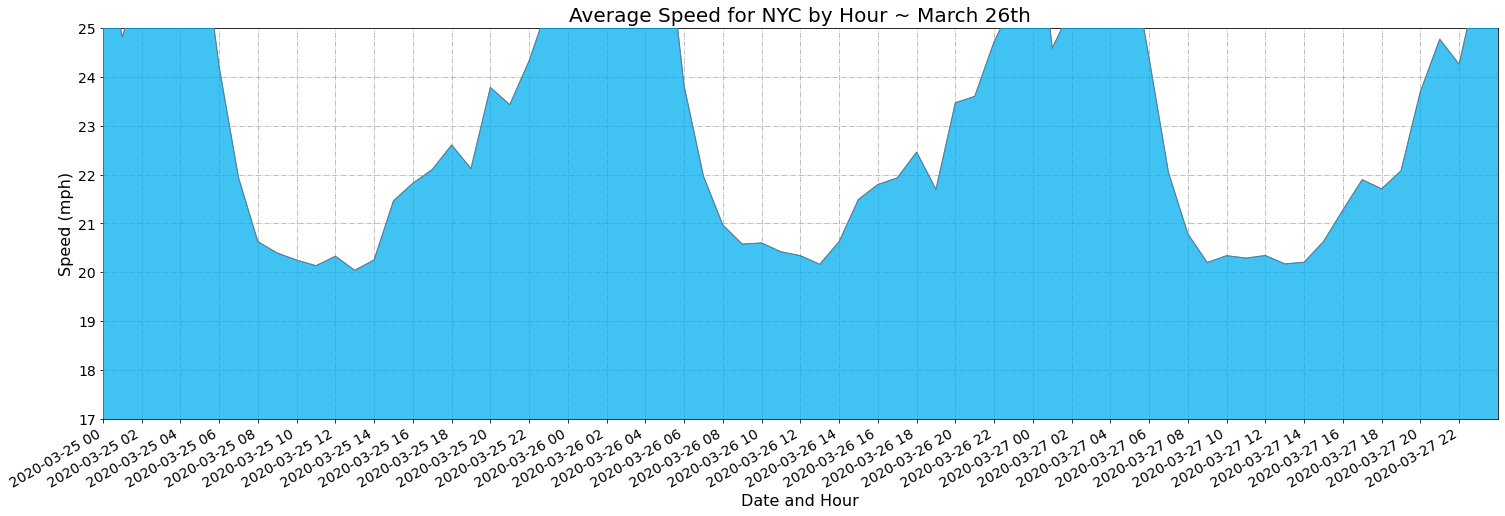
After March 15: Rush hour is virtually eliminated as the morning and evening valleys no longer exist and average speed has increased significantly.
Change in driving
In some cities, as the speed has increased, so have incidents of harsh driving (this includes hard braking, cornering and acceleration). While we have not seen a significant difference, there is a slight increase which should be closely monitored by fleets to ensure the safety of their drivers.
As an example, in New York City, although there has been a decrease in the overall volume of commercial traffic, the daily number of harsh driving events per active commercial vehicle has increased in the incidents for trucks (as seen in figure 5). This is not true for the other commercial vehicles types on the road which have remained fairly consistent in the incidents per active vehicle.

Figure 5. Harsh braking, hard cornering and hard acceleration events per active vehicle in NYC by vehicle type.
What happened to traffic congestion in Mexico City?
Mexico City is more congested than any of the U.S. cities analyzed, with an average daily stop time at intersections of 60 seconds before March 15 compared to 40 seconds for New York City. Average speeds are also much slower. What is interesting to note is that the behavior depicted after March 15 in the U.S. is not present in Mexico City. In fact, the increased speed and reduced stop times at intersections don’t become apparent until the week of March 22 and March 29 — putting the pandemic-related behavior of their commercial vehicle activity 1-2 weeks behind the U.S.
What this means for consumers
For consumers who count on having food stocked on the shelves of local supermarkets, the decreased city congestion makes it easier for fleets of vehicles to continue to provide essential services to citizens. There is also a rise in vehicle speed and a slight increase in instances of harsh braking and hard cornering. Drivers familiar with driving in congested cities are now more liberated in these very same areas, so fleets should carefully monitor driving behavior during this time to help ensure the safety of their employees on the road during this unprecedented time.
Stay updated
If you have any questions or concerns, please contact your Geotab Account Manager, Business Partner or Authorized Geotab Reseller. For media inquiries, contact pr@geotab.com. You can also follow us on Facebook and Twitter (@GEOTAB) for on-going updates.
See also: Interview with Mike Branch on the Commercial Transportation Recovery Dashboard
Subscribe to get industry tips and insights
The Geotab Data & Analytics Team write about news related to data.
Table of Contents
Subscribe to get industry tips and insights
Related posts

Construction fleet management software: What mixed fleets should look for
July 29, 2026
5 minute read
Beyond consumer apps: 5 ways integrated navigation protects your fleet
July 23, 2026
6 minute read

From video archives to active prevention: The case for AI dash cams
July 22, 2026
4 minute read


Crafting a fleet incident management plan that helps your municipality get ahead of claims
July 16, 2026
5 minute read
.jpg)
Marketplace Spotlight: Redefining Fleet Security with Matrix iQ
July 15, 2026
2 minute read