The impact of COVID-19 on commercial transportation and trade activity
Learn how COVID-19 is impacting commercial transportation and trade activity in North America.
Mar 8, 2022

With the current COVID-19 pandemic, now more than ever, it is important to leverage fleet intelligence solutions. Geotab has identified changes to commercial transportation and trade activity since the onset of COVID-19, based on an analysis of anonymized and aggregated insights from its base of over 2 million commercial vehicles worldwide.
Geotab will be updating this blog post weekly as we believe this data can and should be combined with other datasets to support government response, fleets and the general public. You can also access the border activity data for free at ignition.geotab.com, with more datasets being updated in the near future.
See also:
- The impact of COVID-19 on congestion and commercial traffic in cities
- What if the reduction of CO2 emissions didn't end with COVID-19?
- How COVID-19 is impacting the U.S-Canada border
Overview
The insights are split into two categories to better illustrate the impact on the commercial transportation sector in North America.
- Commercial transportation activity includes regional volume of trips and fuel activity, split by various operations.
- Trade activity includes metrics that help show how trade has been affected, from border wait times to port activity.
Impact on volume of commercial transportation activity in the U.S. and Canada
Since Monday, March 16, there has been a significant drop in commercial transportation activity in both the U.S. and Canada when baselined against data from February 1 to March 15. On average, Canada is operating at 84% of normal commercial transportation activity, with the Maritimes operating at 74% (the lowest percentage compared to normal.)
In the U.S., the impact is more significant, operating at an average of 85% of normal commercial transportation activity and the U.S. Federal Region, which includes the State of New York and New Jersey, most impacted at 70% of normal activity.
The heat map below shows a region-by-region breakdown of commercial transportation volumes based on a percentage drop from a normal weekday or weekend, baselined against metrics from February 1 to March 15, 2020.
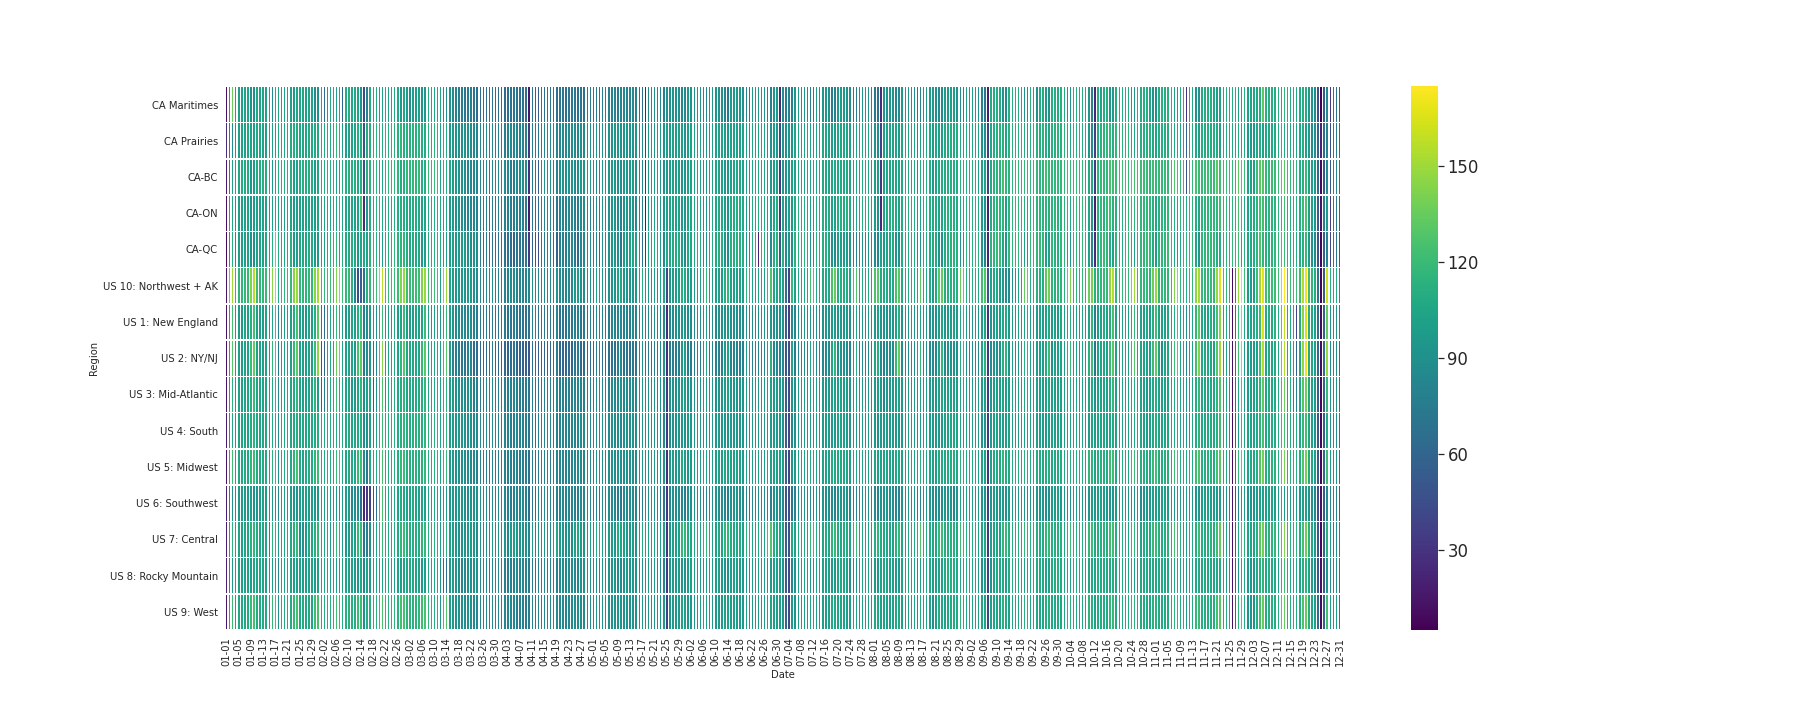
Figure 1. Commercial vehicle activity volume as a percentage of normal operations by macro region in Canada and the U.S.
Applying the same analysis to Latin America yielded similar results in aggregate, but we see vast differences in fleet activity from country to country, though it is unclear whether this can be attributed to Covid-19 as the sample size of vehicles is smaller and the demographics of Geotab-connected fleets may vary greatly between localities.
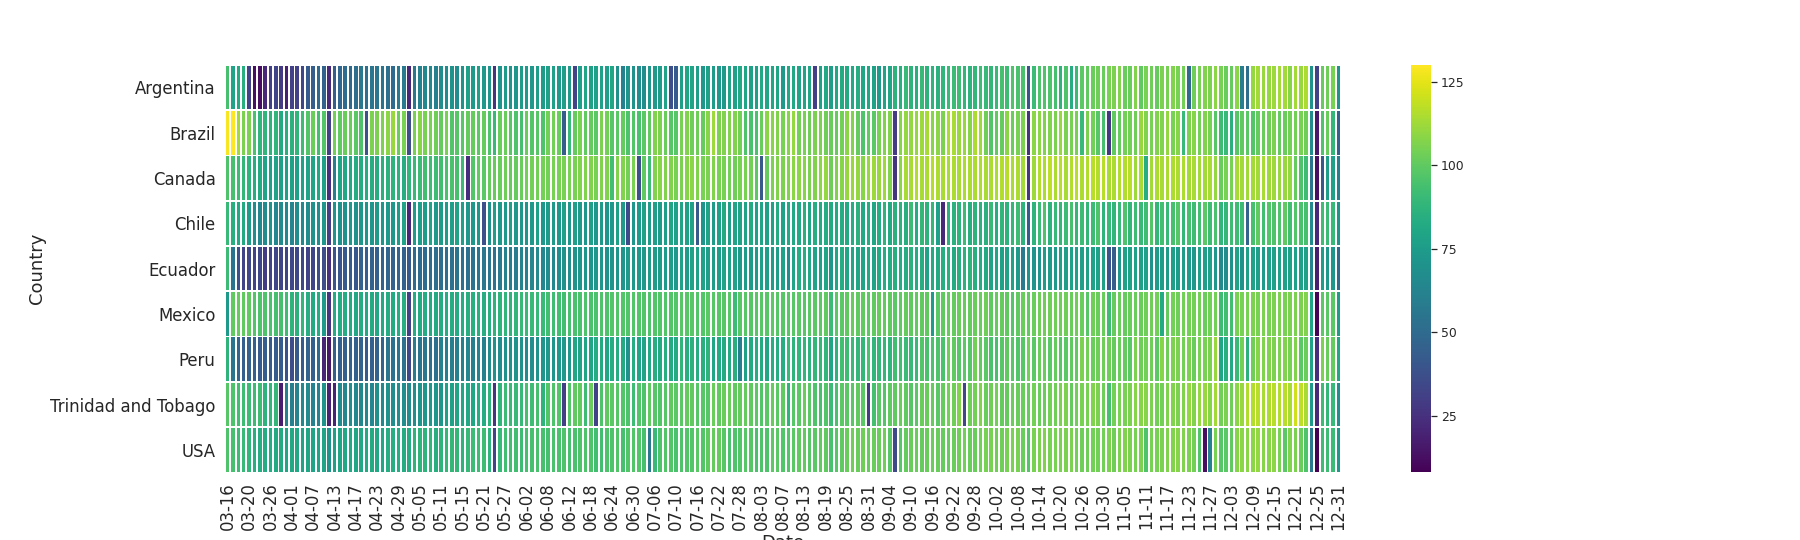
Figure 2. Commercial vehicle activity volume by Country in the Americas, as a percentage of normal operations.
From the heatmap, it appears that commercial fleets activity was reduced greatly in Argentina, Peru and neighboring Ecuador, while Brazil and Mexico were least affected. As noted here, Guatemala has been hit hard by the effects of the pandemic between Mar 23 - Apr 17 (20 days) and fleet activity has started to increase, overall we can see about 100% normal activity has returned since Mar 16.
A deeper dive into Mexico - where the vehicle pool is large enough for a city-to-city comparison, Northern Mexico (Tijuana and Monterrey) are amongst the least affected prior to the partial border closure on March 20, but later see drops in activity similar to that of Mexico City, Toluca, and Guadalajara in the center of the country.Impact on transportation activity to industrial, commercial, and retail locations.
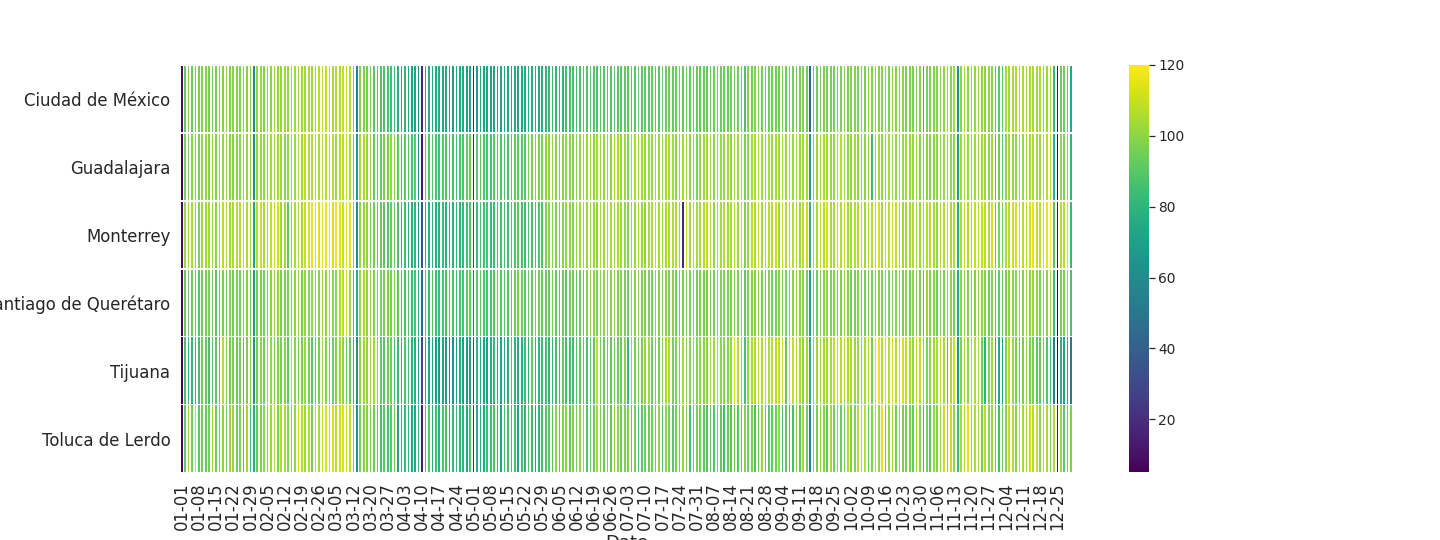
Figure 3.Commercial vehicle activity volume in select cities in Mexico, as a percentage of normal operations.
The situation in Europe is also compatible, with Spain seeing the greatest drop in fleet activity following the imposition of social distancing as early as March 16. This is in contrast to the UK, where fleet activity starts to drop much later. Netherlands has had the least impact during the Covid-19 pandemic and the fleet activity has started to increase since April 29.

Figure 4.Commercial vehicle activity volume by Country in Europe where sufficient data available, as a percentage of normal operations.
Looking at the North American trend, commercial transportation activity is quite similar to what we’re seeing above. However, there is a noteworthy difference in the decline of commercial vehicle activity between heavy-duty trucks at 88% of the normal activity and cars at 67% of the normal activity, baselined against data from February 1 to March 15, 2020. The chart displays heavy-duty trucks (HDT), medium-duty trucks (MDT), light-duty trucks (LDT), and multi-purpose vehicles such as vans (MPV).
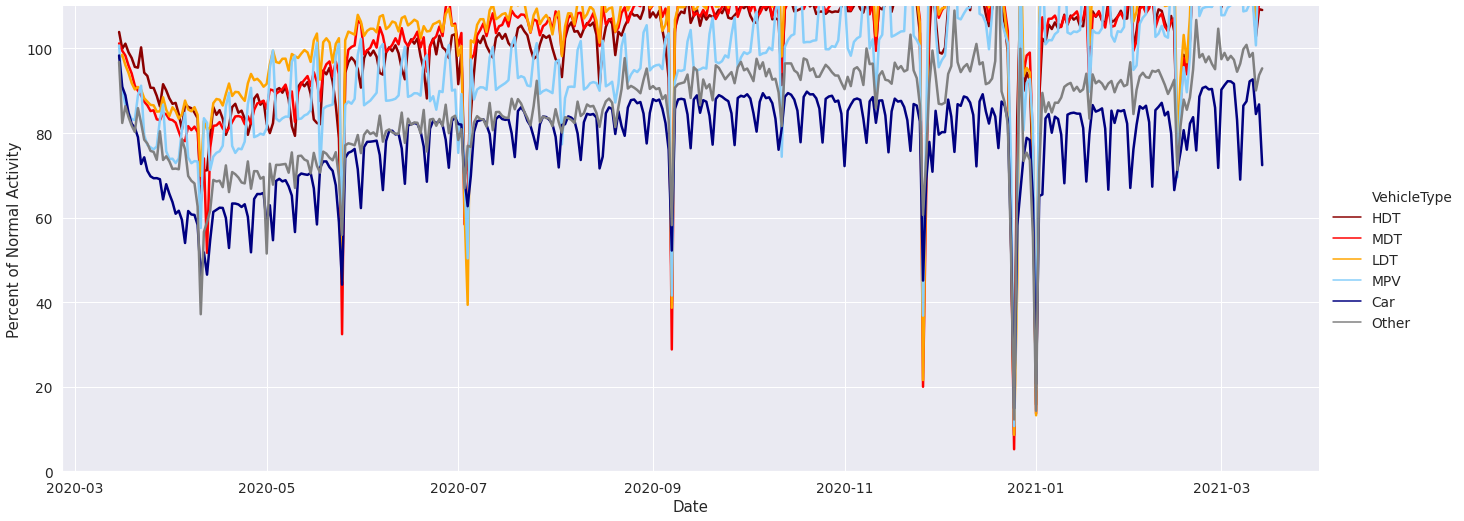
Figure 5. Longitudinal view of commercial traffic volume in North America, measured by number of trips relative to normal activity, broken down by class of vehicle.
Impact on transportation activity to industrial, commercial, and retail locations
Using building locations and tags from OpenStreetMap, Geotab analyzed how the reduction in commercial traffic impacted each industry: industrial, commercial, retail and warehouses (grocery stores and supermarkets were considered separately.)
The dataset suggests that all retail, industrial and commercial locations have been impacted by the drop in commercial transportation activity. However, it is somewhat encouraging to note that commercial transportation activity to grocery stores has dropped the least, with 93% of normal activity. It is important to note that this activity comprises both delivery of goods but other services as well.
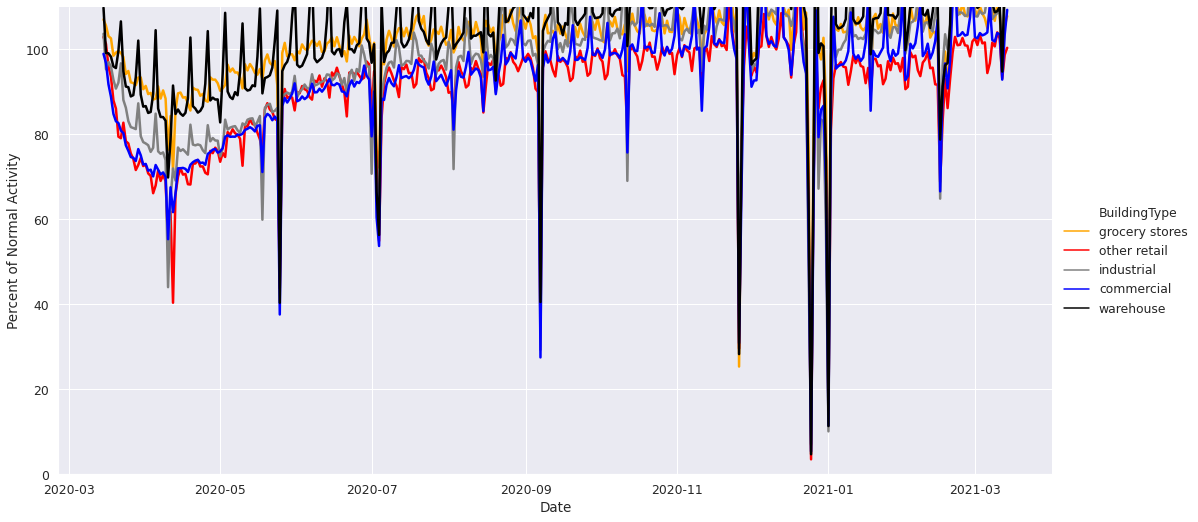
Figure 6. Grocery stores, retail, commercial, industrial and warehouse activity in the U.S., Canada and Mexico.
Impact on fuel use in commercial transportation
With a drop in commercial transportation activity, a notable decline in fuel consumption would also be expected. However, this trend is not evident across all types of commercial vehicles. The trucking economy has been quite steady, which equates to the consistent (if not increased) demand for the transportation and logistics sector. As schools are closed and social distancing measures are being taken, a drop in bus activity is also consistent with what we’re seeing in the data below.
The chart below shows how fuel fill up activity has changed during the COVID-19 pandemic. As noted here, heavy-duty trucks (HDT) have recorded the lowest decline and light-duty trucks (LDT) have increased fuel fill up activity since mid-April.
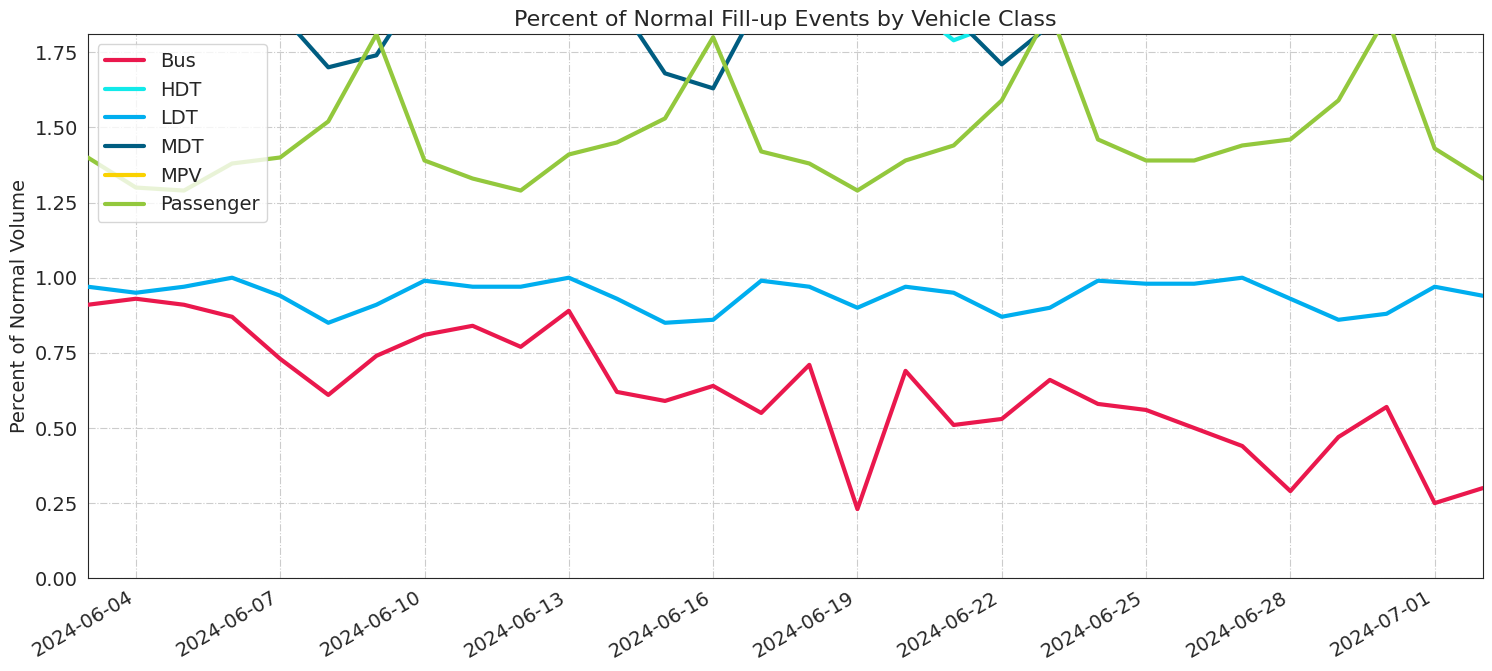
Figure 7. Weight class fueling percent of normal volume.
The impact of COVID-19 on trade activity
It is important to understand how trade is being impacted by this pandemic. Is commercial activity to and from ports and airports remaining consistent? What does border crossing activity look like? The insights presented below analyze the impact COVID-19 is having on commercial trade traffic through the examination of borders and ports in Canada and the U.S.
Border trip and wait times have dropped
At the major U.S.-Canada border crossings in Ontario: Detroit-Windsor, Fort Erie, Queenston and Sarnia, the data suggests a drop in cross-border activity to 81% of normal commercial transportation volumes, baselined against normal operations from February 1 to March 15, 2020. From the figure below, it is evident that although the border crossing time did not change, truck volume started to increase since late May. For further insights on how COVID-19 is impacting cross-border activity, read more here.
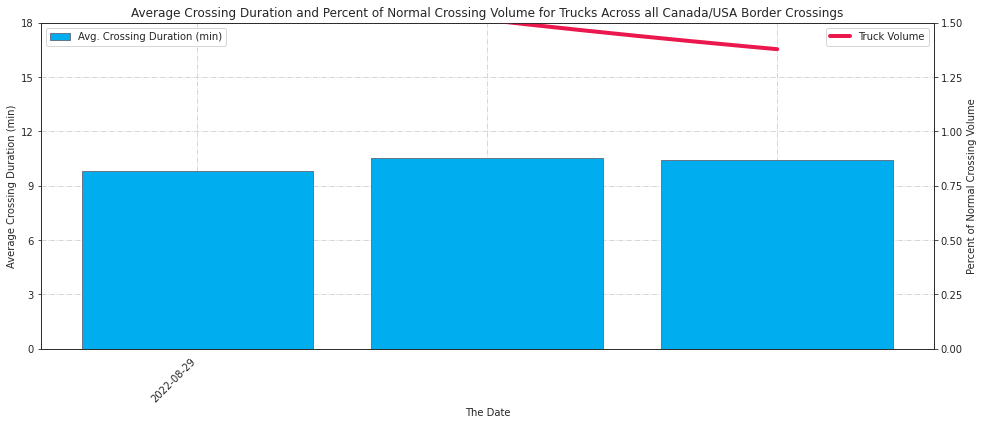
Figure 8. Average crossing duration and percent of normal crossing volume for trucks across all U.S.-Canada border crossings.
Airport activity
An analysis was performed that examined the commercial transportation activity volume to and from select Canadian and U.S. airports baselined against volumes from February 1 to March 15, 2020. In the four Canadian airports analyzed, there was an average decrease in volume of 33% since March 16, with Toronto’s Pearson International Airport experiencing the largest drop to 50% of normal operations. In the U.S., we are seeing sharper declines. Of the 8 airports analyzed, commercial transportation activity to and from the airports had an average decrease in volume of 44% with Las Vegas McCarran seeing the biggest drop to under 32% of normal commercial transportation activity.
The charts below illustrate the decrease in volumes to and from Canadian and U.S. airports since March 16 baselined against volumes from February 1 to March 15.
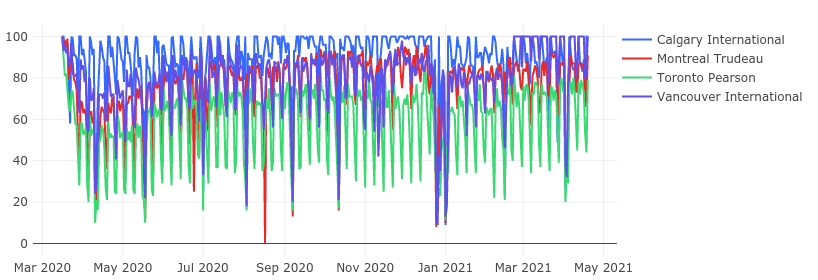
Figure 9.1. Canadian airports: Percent of normal trip volume to and from the airport.
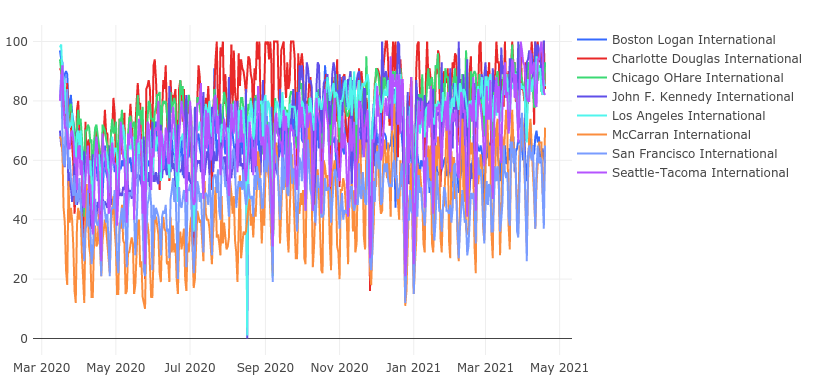
Figure 9.2. U.S. airports: Percent of normal trip volume to and from the airport.
Port activity
The ports of Montreal, Seattle, Tacoma and Vancouver have shown strong volumes with higher levels of variability over the last few weeks when baselined against volumes from February 1 to March 15, 2020. The overall traffic at ports on April 3rd was 99% of the baseline.
Figure 10. Port activity in Montreal, Seattle, Tacoma and Vancouver.
Conclusion
Overall, the Geotab analysis shows a decline in commercial transportation activity in North America from COVID-19. Although this is a general trend, for the heavy-duty trucking industry, we are observing that volumes seem to be less impacted and more consistent to pre-pandemic baseline volumes, especially when observing fuel fill-ups. In addition, for the light-duty trucking industry, the fleet volumes and fuel fill-ups have started to increase since mid-April.
Commercial trade appears to be most impacted by the drop in volume of activity across the U.S.-Canada border and the drop in volume of activity to and from select Canadian and U.S. airports. Interestingly, activity to and from select sea ports has not changed significantly from normal pre-pandemic baseline volumes, with the exception of the Port of Seattle.
Stay updated
If you have any questions or concerns, please contact your Geotab Account Manager, Business Partner or Authorized Geotab Reseller. For media inquiries, contact pr@geotab.com. You can also follow us on Facebook and Twitter (@GEOTAB) for on-going updates.
See also: Interview with Mike Branch on the Commercial Transportation Recovery Dashboard
Subscribe to get industry tips and insights
The Geotab Data & Analytics Team write about news related to data.
Table of Contents
- Overview
- Impact on volume of commercial transportation activity in the U.S. and Canada
- Impact on transportation activity to industrial, commercial, and retail locations
- Impact on fuel use in commercial transportation
- The impact of COVID-19 on trade activity
- Border trip and wait times have dropped
- Airport activity
- Port activity
- Conclusion
- Stay updated
Subscribe to get industry tips and insights
Related posts
.jpg)
Marketplace Spotlight: Redefining Fleet Security with Matrix iQ
July 15, 2026
2 minute read

AI readiness checklist for field service fleets: Is your data ready for AI?
July 6, 2026
1 minute read


How sanitation fleets can prevent return trips and reduce solid waste collection costs
June 15, 2026
3 minute read
.png)
Elevating the Ecosystem: The BlueArrow Approach to Integrated Telematics
May 27, 2026
2 minute read