What if the reduction of CO2 emissions didn't end with COVID-19?
During COVID-19, CO2 levels have plummeted. The inevitable return to regular business activity could prove to be a pivotal moment for fleets.
Jun 2, 2025

Across North America, limiting exposure to and helping slow the spread of the COVID-19 virus remains of critical importance. As citizens continue to practice self-isolation as a result of stay-at-home orders, we've seen a predictable reduction in travel and commercial activity. Consequently, we've also seen a decrease in traffic congestion, idling and perhaps most significantly, a drastic decline in CO2 emissions. But what if some of the emissions reductions didn’t end with COVID-19?
See also:
- The impact of COVID-19 on commercial transportation and trade activity
- The impact of COVID-19 on congestion and commercial traffic in cities
- How COVID-19 is impacting the U.S-Canada border
Post-shutdown CO2 emissions are lower than normal
The significant decrease in CO2 emissions across North America can be seen in the following charts based on a Geotab analysis of anonymized and aggregated insights from over 2 million commercial vehicles worldwide.
Looking at the period before March 15 (left side of the chart below, in yellow), we see a typical 100% of normal emissions on a day-to-day basis, with some minor variations. As soon as the lockdowns begin across North America, we see a drastic reduction in emissions, down to 40% or less of normal for some cities. As you can see below, New York City has seen the largest reduction, sitting at 38% of pre-pandemic CO2 emissions.
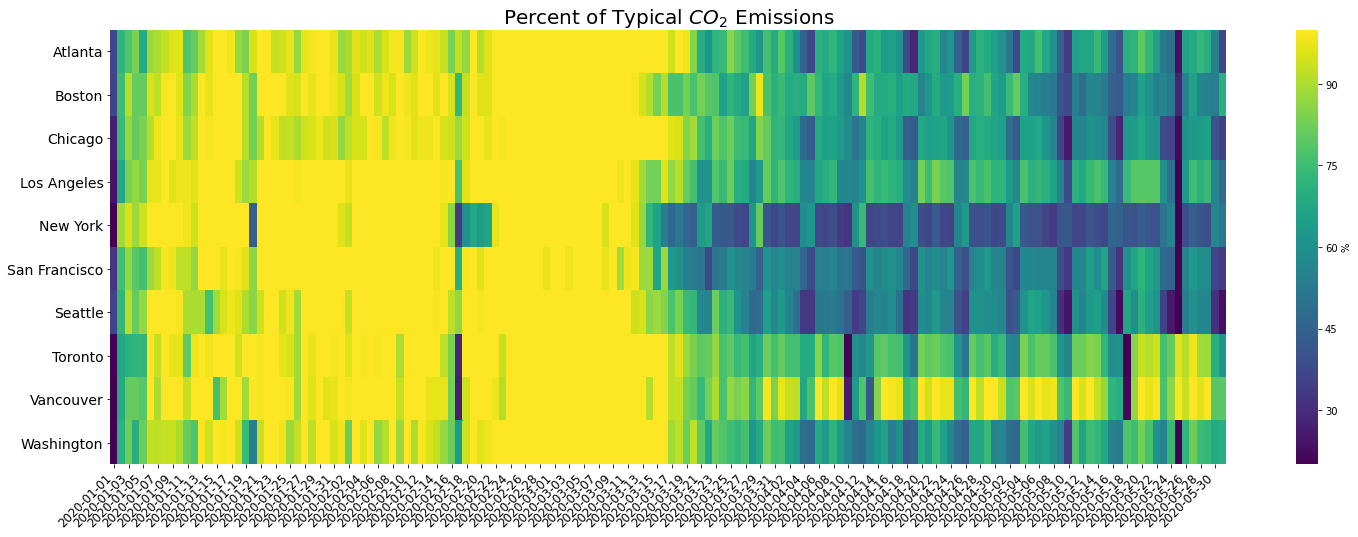
Figure 1. Percentage of typical CO2 emissions in major North American cities.
Given that the analysis of each city is dependent upon the size of the city, the number of vehicles and Geotab’s proportionate coverage of vehicles in that city, it is important to note that the raw numbers cannot be compared across cities but rather can only be compared to the city itself over time.
Reduction in congestion a contributing factor
Geotab has identified that with reduced traffic congestion due to fewer vehicles on the road, there has been a gradual increase in average moving speeds. The analysis examining congestion in select U.S. cities shows an increase in moving speeds across the board, with New York City seeing the largest increase of 16%. This increase in moving speeds directly correlates to a decrease in traffic congestion.
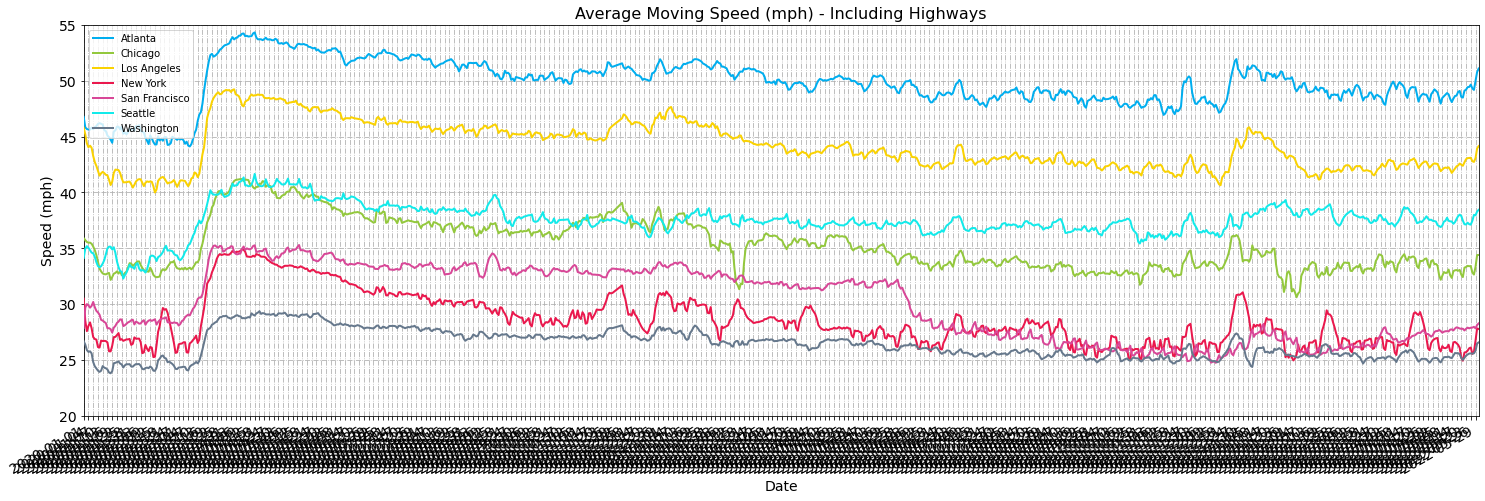
Figure 2. The average moving speed of commercial vehicles.
The decrease in congestion is also reflected in a reduction of idling times at intersections across the select cities. When compared against the period prior to March 15, 2020 when many lockdown measures began in North America, we see a consistent decrease in idling times across all major cities evaluated.
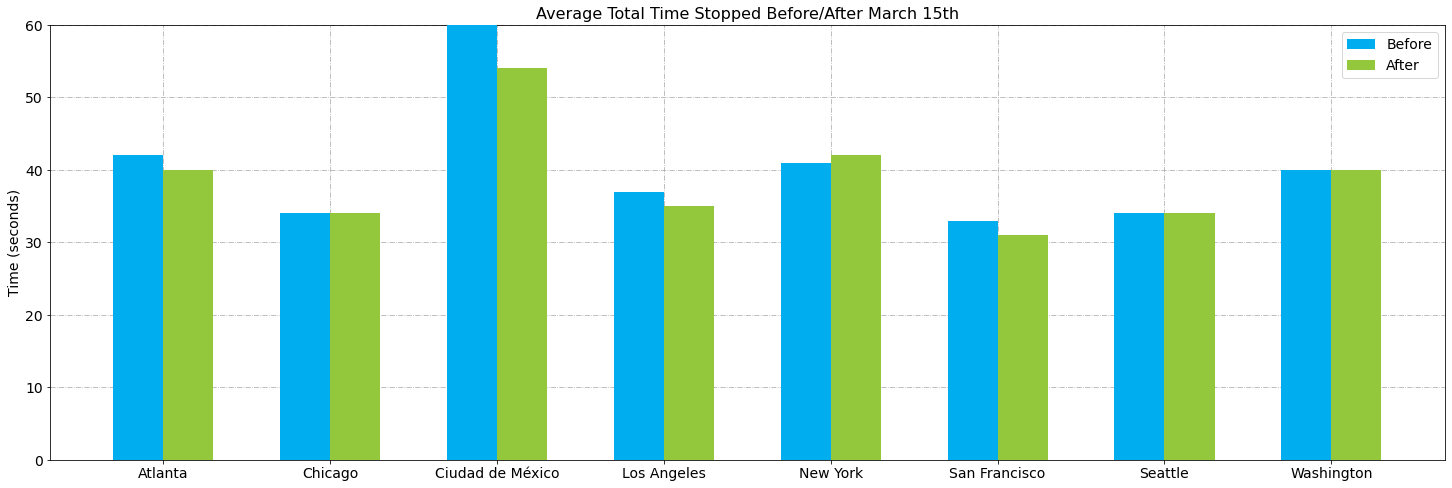
Figure 3. Average idling duration at intersections before and after March 15.
According to the United States Environmental Protection Agency (EPA), a typical passenger vehicle emits about 4.6 metric tons of carbon dioxide per year. There are many contributing factors that likely play a part in the quarantine-related idling reductions we’ve seen in large cities, including reduced delivery/pickup services, shorter (or non-existent) wait times at intersections and a lower total number of trips to name a few. However, using the anonymized, aggregated idling data we do have from Geotab-enabled vehicles in a city, we can safely estimate that even a minor reduction in idling per intersection leads to a relatively large reduction in idling per day.
Using the above example, if our data showed a reduction of 3 seconds of idling per intersection, that would equal anywhere from 1-4 days worth of idling eliminated per day, depending on the day of the week. Using numbers from Natural Resources Canada (NRCAN), this works out to a reduction of 600-800kg of CO2 for the city of Chicago (on weekdays), which is about 3.5% of the total emissions from Geotab-connected vehicles alone. Add that to the reduced congestion percentage, which eliminates 30 seconds (on average) at each intersection each time a vehicle is not required to stop, and it adds up to roughly another 1250kg of CO2 saved – about 5-6% of the total, which brings us to 8-9% of the total emissions reduction.
Looking at the same data through a heatmap provides us with yet another lens from which to view the decrease in idling time. As the heatmap below shows us, idling has trended downwards over time, with some cities showing more pronounced reductions than others. In the United States, of the cities analyzed, Atlanta and Los Angeles are showing the largest decrease, with a 16% reduction in average idling times.
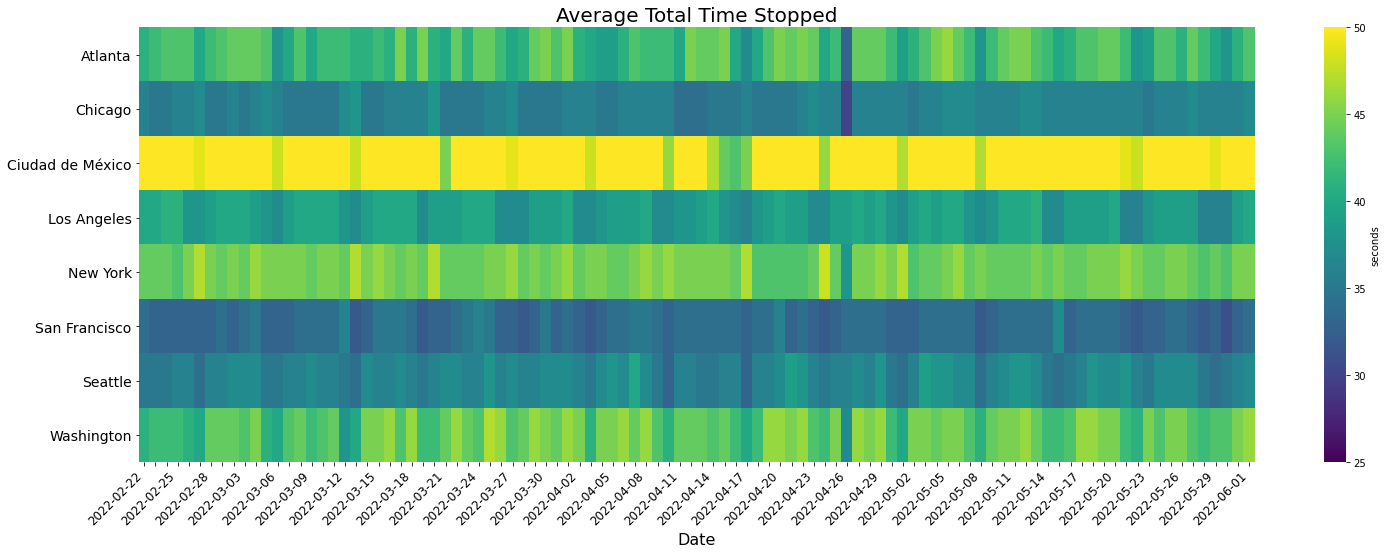
Figure 4. Average time stopped (idling) before passing through an intersection.
In addition to a reduction in idling, the data also shows a decrease in the percentage of vehicles that need to stop before passing through an intersection. This number is a reflection both of red-light signal timing and reduced congestion. With congestion declining, we see a corresponding reduction in the percentage of vehicles stopping, regardless of the traffic light phase. This all works to further reduce idling, ultimately leading to a decrease in CO2 emissions.
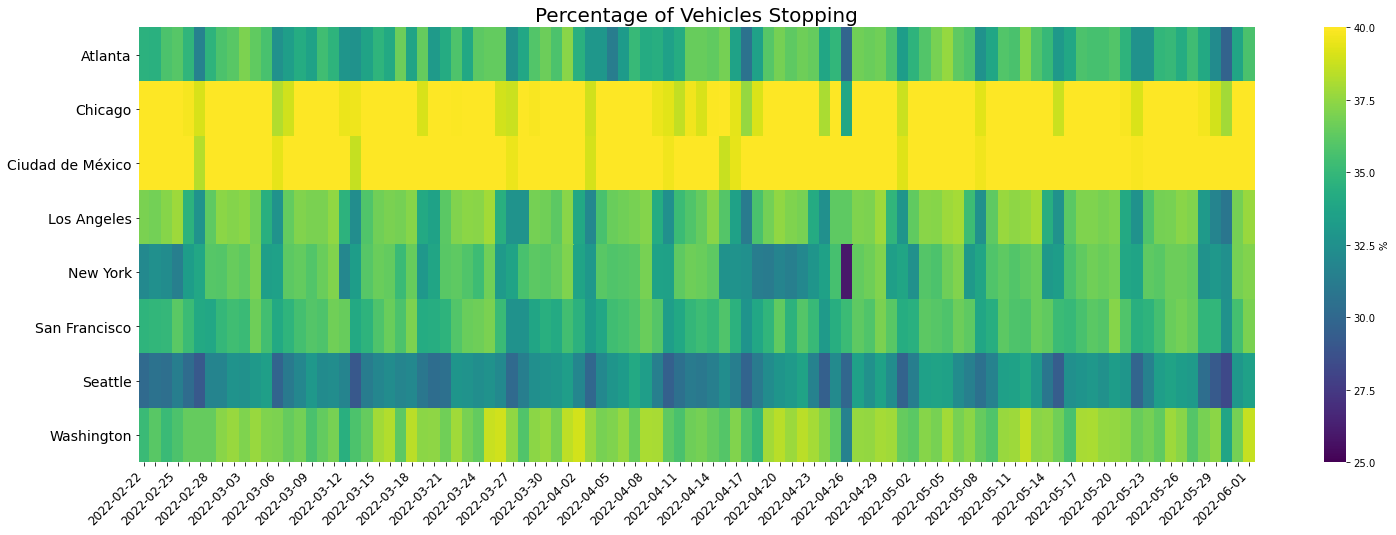
Figure 5. Percentage of vehicles stopping before passing through an intersection.
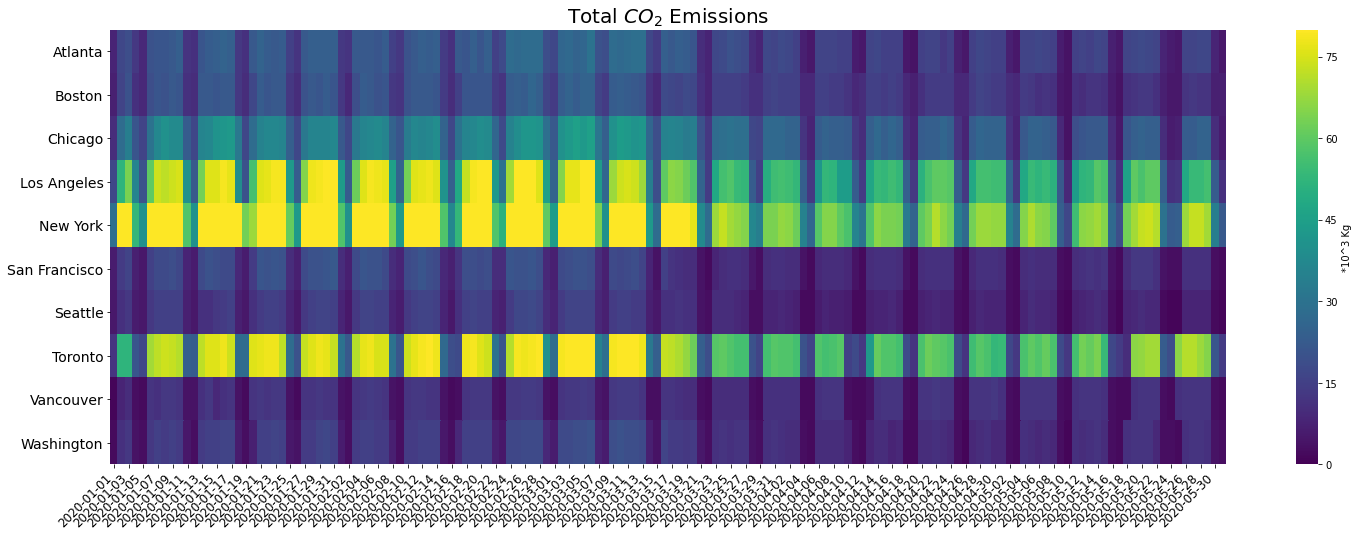
Figure 6. Total CO2 emissions from Geotab-connected commercial vehicles in major U.S. cities.
A pivotal moment for CO2 reduction efforts
As North Americans continue to practice social distancing amidst the COVID-19 pandemic, the data has shown that major cities are seeing a significant reduction in carbon emissions. While vehicle traffic will no doubt increase once self-isolation orders are lifted, the inevitable return to regular business activity could prove to be a pivotal moment for fleets to reevaluate their carbon emission reduction strategies.
For instance, implementing fuel-saving measures, such as enforcing fuel efficient driving techniques, can not only help reduce costs and improve safety, they can ultimately help fleets reduce CO2 emissions. This unique situation could also provide fleet operators with the opportunity to gain even greater savings, and limit carbon emissions through an examination of fleet vehicles to determine possible candidates for replacement with fuel-efficient alternatives, or even EVs. The Geotab Electric Vehicle Suitability Assessment (EVSA) is a free tool designed to help fleet managers explore the viability of adding EVs to their fleet, and determine whether it makes financial sense to do so.
Geotab's new Green Fleet Dashboard provides fleet managers with visibility into a fleet's environmental impact, making it easy to track daily and weekly emissions along with fuel usage metrics with insight into how driving behavior contributes. The Green Fleet Dashboard is now available as an add-in on the Geotab Marketplace.
*NOTE: The Green Fleet Dashboard is now deprecated and integrated within MyGeotab as the Sustainability Center. Visit the Sustainability Center page to learn more.
See also:
Subscribe to get industry tips and insights
The Geotab Data & Analytics Team write about news related to data.
Table of Contents
Subscribe to get industry tips and insights
Related posts

Charged up: 6 data-driven strategies to maximize EV range in summer
June 19, 2026
2 minute read
The EV Confidence Gap: How to maximize your electric fleet and reduce costs
April 23, 2026
2 minute read
.jpg)
Neil Cawse: Sustainability’s pragmatic path — Delivering value today
March 25, 2026
1 minute read

How long do electric car batteries last? The updated guide to real-world EV battery health
January 12, 2026
10 minute read

Run on Less data redefines electric truck viability
December 17, 2025
4 minute read