Collision reconstruction with telematics
Table of Contents
- What is collision reconstruction?
- How collision detection works
- Possible Collision exception rule and notifications
- Minor Collision detection
- Possible Minor Collision rules
- Rules adjustment
- Possible reasons for not detecting a collision
- Data accuracy
- Data validation
- How to analyze and interpret collision data on MyGeotab
- Relevant data to collision reconstruction
- Key reports for analyzing collision data
- First steps to take when a collision occurs
- Step 1:
- Step 2:
What is collision reconstruction?
When a vehicle collision occurs, it’s important to know what happened and why. Rebuilding as much information as possible is vital for insurance, training and potential litigation. This is when collision reconstruction with telematics can help.
Collision reconstruction with telematics is the process of using fleet tracking technology and software to understand the events that occurred before, during and after a collision.
Telematics data is highly valuable because it provides an accurate scientific record of events. It allows you to go beyond word-of-mouth testimony. The granularity of the data can tell you many things about a collision. As well, telematics makes it possible to gain a broader perspective by looking at the historical patterns for a specific driver or vehicle.
Geotab Collision Reconstruction Add-In
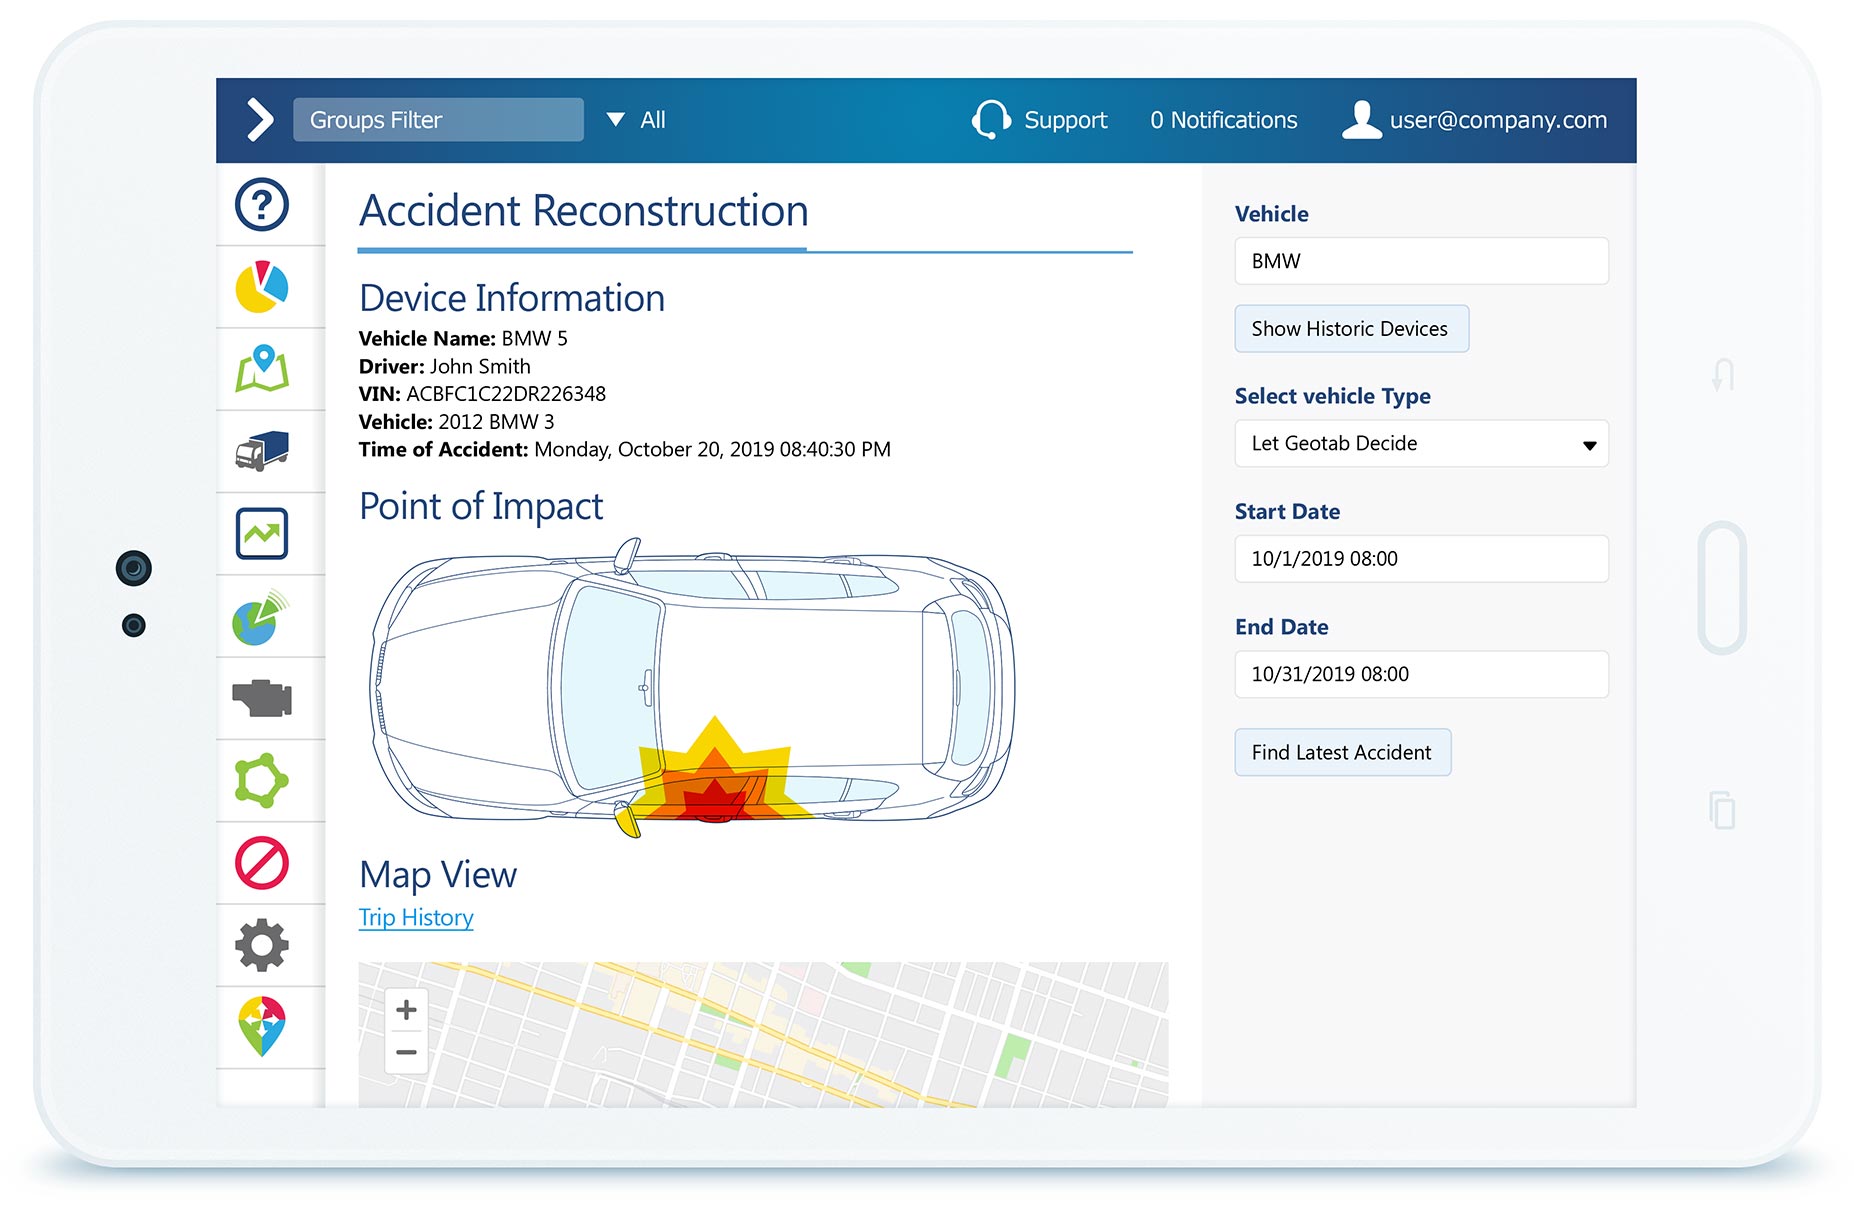
The Collision Reconstruction Add-In for MyGeotab is a free solution for viewing, analyzing and interpreting collision data from Geotab tracking devices. Learn more about this solution at marketplace.geotab.com.
In MyGeotab, users can access a number of different types of data that are critical to collision reconstruction, including Trips History, Collision and Log Data, Speed Profile, and Accelerometer and RPM graphs. By reviewing and analyzing this data, you can verify the events of the collision.
How collision detection works
Collisions are detected by the Geotab GO device upon any acceleration greater than or equal to 2.5 G, where G is 9.81 m/s2 (the acceleration due to the Earth’s gravity). This is classified as a collision-level event. Geotab GO device firmware will not use Up/Down accelerometer data (also known as the Z axis) in this calculation. The calculation uses the magnitude of the hypotenuse between X and Y (√(X2+Y2)) where X is Forward/Braking and Y is Side to Side.
When the Geotab GO device detects a 2.5 G event in any direction, the device is triggered to start recording at 100 Hz frequency. This detailed, high resolution information will be reflected in the trip in MyGeotab, and includes acceleration, GPS speed and brake data (if available.)
See also: What is g-force and how is it related to harsh driving?
Possible Collision exception rule and notifications
MyGeotab has a built-in rule called Possible Collision. This rule is triggered if the accelerometer detects a change in speed of more than 2.55 g-force in the forward/braking or side-to-side direction. If possible, the device will send detailed forensic information about position, speed and acceleration of the vehicle.
To receive a notification when a possible collision is detected, a user can set this rule to “On” in MyGeotab. Even if the Possible Collision rule is not enabled, you can still see details in the Log Details and Collision report. This rule is separate from the Collision Reconstruction Add-In and can be set even if the Add-In isn’t installed.
Note: False alarms are possible. Knocking the device can trigger the rule accidentally, so installing the device out of the driver’s way is recommended.
Minor Collision detection
Sometimes a collision occurs where an accelerometer reading is less than 2.5 g. For example, in a low speed collision where both vehicles continued driving afterwards or a slight rear end collision, a Collision Level Event might not be triggered.
However, in these circumstances the data reported by the GO device is still very important and helpful as accelerometer data is coming through at 100 Hz. The data is event-driven, so as there are more changes in direction or speed, there are more updates, resulting in a greater than normal number of logs.
In these circumstances an Exception Rule can be created to detect these instances and a notification can be set to notify a user when a Minor Collision is detected.
Possible Minor Collision rules
The Possible Minor Collision rule currently does not exist as a built-in rule but can be added as a custom rule in the database. The sensitivity of the Exception Rule is fully customizable and should be modified to meet user preference. Based on our past experience, we recommend setting the G-force thresholds as listed below.
Harsh events are defined as following in the Geotab system:
Passenger vehicle:
- Harsh Acceleration: > 3.88 m/s²
- Harsh Braking: < -6 m/s²
- Harsh Cornering: > 4.59 m/s2 or < -4.59 m/s²
Pickup truck/Cube van:
- Harsh Acceleration: > 3.35 m/s²
- Harsh Braking: < -5.3 m/s²
- Harsh Cornering: > 4.59 m/s2 or < -4.59 m/s²
Heavy-duty truck:
- Harsh Acceleration: > 2.82 m/s²
- Harsh Braking: < -4.59 m/s²
- Harsh Cornering: > 3.18 m/s² or < -3.18 m/s²
Rules adjustment
Adjust Harsh Event rules (Up to 1 G= 9.81 m/s²) or create additional rules based on the following:
Passenger vehicles
The following rules for Passenger vehicles should improve the detection of all possible collision events:
- Harsh Acceleration Rule for Passenger vehicles
- Status Data Diagnostic "Acceleration forward or braking" > 3.88 m/s² and Status Data Diagnostic "Acceleration forward or braking" < 9.81 m/s²
- Harsh Braking Rule for Passenger vehicles
- Status Data Diagnostic "Acceleration forward or braking" < -6 m/s² and Status Data Diagnostic "Acceleration forward or braking" > -9.81 m/s²
- Harsh Cornering Rule for Passenger vehicles
- Status Data Diagnostic "Acceleration side to side" > 4.59 m/s² and Status Data Diagnostic "Acceleration side to side" < -4.59 m/s² and Status Data Diagnostic "Acceleration side to side" > -9.81 m/s² and Status Data Diagnostic "Acceleration side to side" < 9.81 m/s²
Pickup truck/Cube van vehicles
The following rules for Pickup Truck/Cube Van vehicles should improve the detection of all possible collision events:
- Harsh Acceleration Rule for Pickup Truck/ Cube Van vehicles
- Status Data Diagnostic "Acceleration forward or braking" > 3.35 m/s² and Status Data Diagnostic "Acceleration forward or braking" < 9.81 m/s²
- Harsh Braking Rule for Pickup Truck/ Cube Van vehicles
- Status Data Diagnostic "Acceleration forward or braking" < -5.3 m/s² and Status Data Diagnostic "Acceleration forward or braking" > -9.81 m/s²
- Harsh Cornering Rule for Pickup Truck/ Cube Van vehicles
- Status Data Diagnostic "Acceleration side to side" > 4.59 m/s² and Status Data Diagnostic "Acceleration side to side" < -4.59 m/s² and Status Data Diagnostic "Acceleration side to side" > -9.81 m/s² and Status Data Diagnostic "Acceleration side to side" < 9.81 m/s²
Heavy-duty trucks
The following rules for Heavy Duty Truck vehicles should improve the detection of all possible collision events:
- Harsh Acceleration Rule for Heavy Duty Truck Van vehicles
- Status Data Diagnostic "Acceleration forward or braking" > 2.82 m/s² and Status Data Diagnostic "Acceleration forward or braking" < 9.81 m/s²
- Harsh Braking Rule for Heavy Duty Truck vehicles
- Status Data Diagnostic "Acceleration forward or braking" < -4.59 m/s² and Status Data Diagnostic "Acceleration forward or braking" > -9.81 m/s²
- Harsh Cornering Rule for Heavy Duty Truck vehicles
- Status Data Diagnostic "Acceleration side to side" > 3.18 m/s² and Status Data Diagnostic "Acceleration side to side" < -3.18 m/s² and Status Data Diagnostic "Acceleration side to side" > -9.81 m/s² and Status Data Diagnostic "Acceleration side to side" < 9.81 m/s²
Possible minor collision rule for all vehicles (Between 1 G and 2.5 G)
Status Data Diagnostic "Acceleration forward or braking" > 9.81 m/s² and Status Data Diagnostic "Acceleration forward or braking" < 24.5 m/s² and Status Data Diagnostic "Acceleration forward or braking" < -9.81 m/s² and Status Data Diagnostic "Acceleration forward or braking" > -24.5 m/s²
Note: These rules can cause a lot of false alarms as these instances of Possible Minor Collisions could be just harsh events. The sensitivity can and should be adjusted based on experience.
Possible reasons for not detecting a collision
There are several possible reasons that a vehicle collision might not be detected:
- The event did not meet the condition of the system level threshold that is set on the internal firmware of the GO device:
- A Collision Level Event is defined as an acceleration greater than 24.5 m/s² in the forward/reverse (longitudinal) or side to side (lateral) direction.
- Collisions are detected by the GO device upon any acceleration greater than or equal to 2.5 G where G is the gravitational constant of 9.81 m/s². The firmware will not use accelerometer Up/Down (also known as Z axis) in this calculation. The calculation uses the magnitude of the hypotenuse between X and Y (√(X2+Y2)) Where X is Forward/Braking (longitudinal) and Y is Side to Side (lateral.)
- Device losing power (usually the battery gets disconnected or the power to the device getting cut at any point of the circuit due to the impact or bad installation.)
- Cellular connectivity:
- The device continues to record data on the memory of the device if the device loses cellular connection. A device can store up to 79848 records without requiring to transmit them to the server.
- If the device involved in a collision is recoverable and in working condition, contact Geotab Support to have a custom parameter applied to the device which triggers the upload of the data that is stored on the collision buffer. After, the device can be installed in a vehicle or power can be supplied to the device so it can start communicating to Geotab’s servers to upload the data.
- If the device is not in working condition, contact Geotab Support to get an RMA to send the device to Geotab for a manual extraction of the data that is stored on the collision buffer.
Data accuracy
GPS coordinates are accurate to approximately 2.5 m in any direction. Speed is accurate to 0.52 m/s. The GO device processes and analyzes accelerometer data at 100Hz before the curve logic is applied and the resulting data is sent to MyGeotab. This allows for real-time detection of collision-level events.
There are many ways in which automatically generated reports can be in error. Some directly measured quantities in the report, such as acceleration, speed and GPS location, are subject to their usual uncertainties and measurement errors. Derived quantities, such as possible point of impact, are also subject to potential calculation errors.
Accuracy:
- GPS: Accurate to 2.5 m.
- Speed: Accurate to 0.52 m/s.
- Curve logic: Polls at a 300 Hz error rate and upon detection re-polls at a rate of 100 Hz.
Data validation
Sources of error for vehicle position, speed and acceleration are dependent on the specific model of device; verify these with Geotab for your specific device.
In cases where the Geotab GO device was not rigidly attached to the OBD II connector of a vehicle, the initial acceleration data from the device remains correct, but the reaction (or reverse) acceleration will be in error due to the flexing of the harness. Additionally, the actual acceleration measured by the device may not be identical to the acceleration of the center of gravity of the vehicle depending on the device’s location relative to the center of gravity of the vehicle.
Data for Geotab GO devices are stored in secure data centers only accessible by Geotab. Always state the VIN (Vehicle Identification Number) for the vehicle Engine Control Module (ECM) data collected by the Geotab GO device when reaching out to Geotab Support.
How to analyze and interpret collision data on MyGeotab
The blog post “Collision reconstruction with telematics data” explains collision reconstruction and setting possible collision rules in MyGeotab. This article provides an overview of the types of collision data available in MyGeotab, and how to interpret that data.
Relevant data to collision reconstruction
The following types of telematics data are useful in collision reconstruction for fleets:
- GPS data
- GPS location (GPS coordinates, map view, satellite view and street view)
- GPS speed
- GPS Speed Raw data points (can be found in MyGeotab under Collision and Log Data Report )
- Speed Profile
- Accelerometer data (if the device is at least on Pro Plan)
- Raw values and Graph
- Engine speed
- Raw values and Graph
- Exceptions
- Speeding, Seatbelt, Harsh events, Collision-related Custom Rules, etc.
Fleets can access this kind of information on their vehicles by using Geotab GO devices. Learn more about the GO device hardware and its features in this post.
Key reports for analyzing collision data
These MyGeotab reports provide details on vehicle trip dates, times, locations, exceptions and more.
- Advanced Detailed Trips Report
- Advanced Collision and Log Data Report
- Advanced Detailed Exceptions Report
- Advanced Engine Status Report
- Accelerometer Data — Engine measurements to include: Acceleration forward or braking and Acceleration side to side (Acceleration up down only if there was a rollover)
- Engine RPM — Engine measurements to include: Engine Speed
Note: For legal purposes, court cases or insurance purposes, a trained engineering or physics expert should be consulted.
First steps to take when a collision occurs
Step 1:
- Confirm the GO device serial number for the device installed in the involved vehicle.
- Confirm the exact date, time, and location of the collision (for example, via a police report).
- In MyGeotab, check if the telematics device was able to detect the collision.
- In MyGeotab, select:
- Engine and Maintenance
- Engine and Device
- Faults
- Using the Options field select Device, Date, and Time
- Apply changes
- In MyGeotab, select:
If the device was able to detect the collision you will see the fault “ALERT: Collision limit for acceleration exceeded” listed.
To read about possible reasons why a collision was not detected, please refer back to the section: Possible reasons for not detecting a collision
Step 2:
Collect the relevant data for the time of the collision-level event:
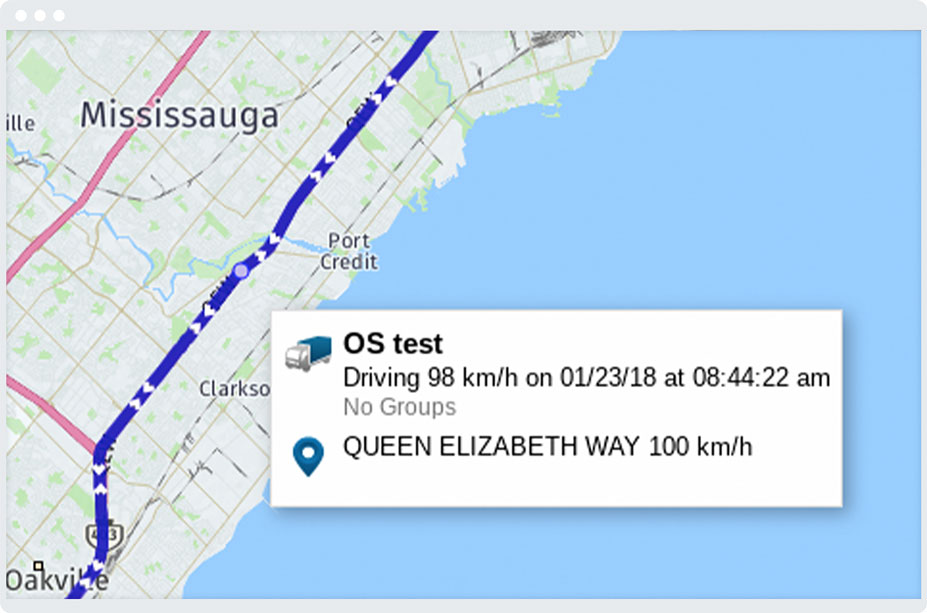
GPS data (Trips History, Map, and GPS Speed)
The Trips history and Map in MyGeotab provide the date, time and location of the trips recorded by the telematics device throughout the day. You can filter by the trip on which the collision occurred and get the details on date, time, and location of the event.
Trips history
To navigate to the Advanced Trips History report:
- From the MyGeotab main menu, select Map and click on the Trips history button.
- Select the vehicle.
- Click on the Options dropdown menu and select the Date Period. Click Apply changes.
- Select View > Advanced.
- You can download the report as a PDF or Excel file.
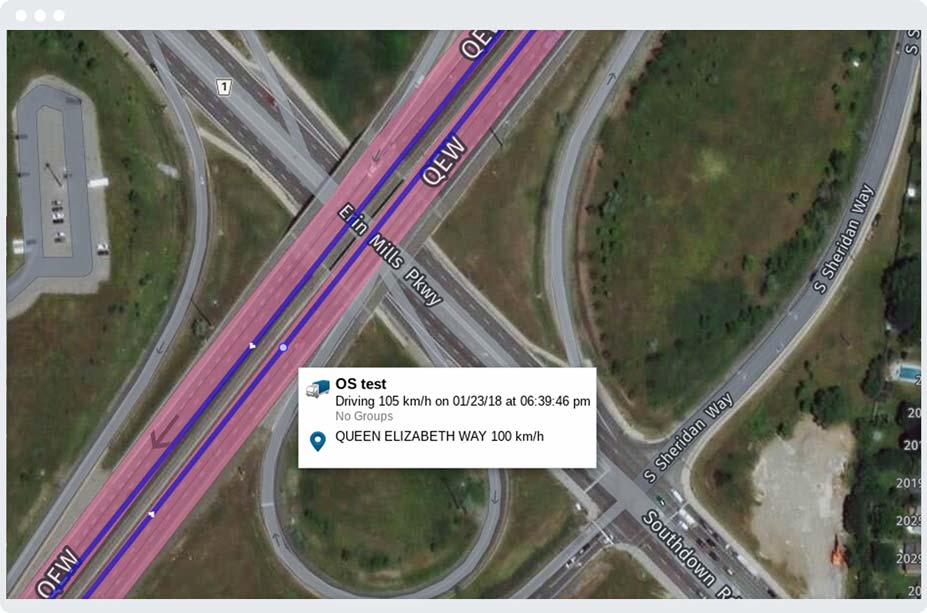
Map
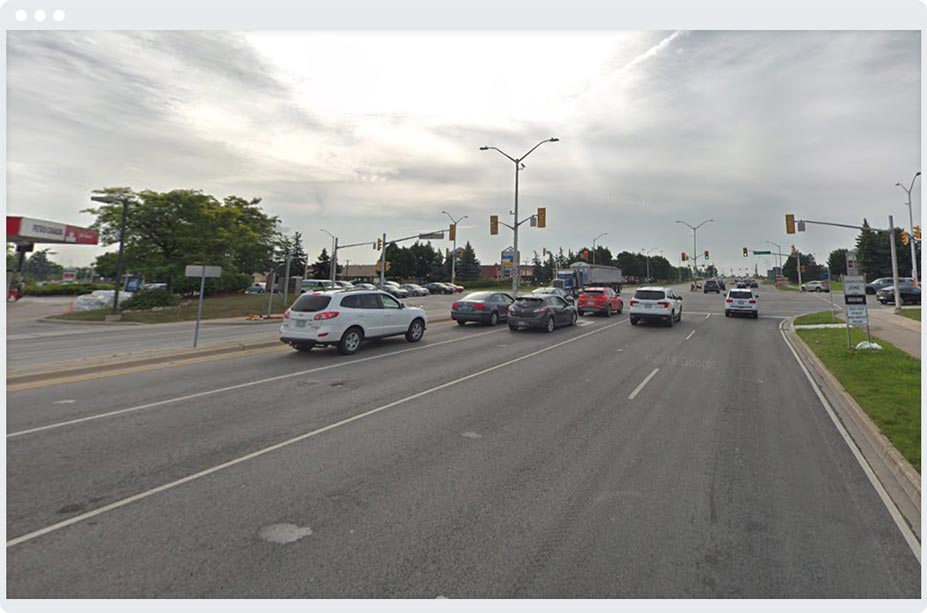
Include a screenshot of the location of the collision in your report. We recommend a Map, Satellite, and Street view.
1. In MyGeotab, select Map > Trips history
2. Select the vehicle.
3. Using Options, select Date and Vehicle.
4. Select Date.
5. Select the trip on which the collision occurred.
6. Zoom in to the collision location.
7. Take a screenshot of the map view.
8. Next, switch to Satellite view and take a screenshot.
9. Right click on the location of the collision.
10. Select street view and take a screenshot.
The trips are based on the GPS coordinates recorded by the telematics device. Please refer to Collision & Log Data report to get the exact timestamps of the recorded GPS coordinates.
GPS speed
Use the Speed Profile to see a real-time graph of the speed of the vehicle.
From the MyGeotab main menu, select Activity > Speed Profile.
What the line colours mean:
- Blue lines indicate the speed recorded by the telematics device.
- Red lines indicate a confirmed posted road speed.
- Yellow lines (not shown) indicate an estimated posted road speed.
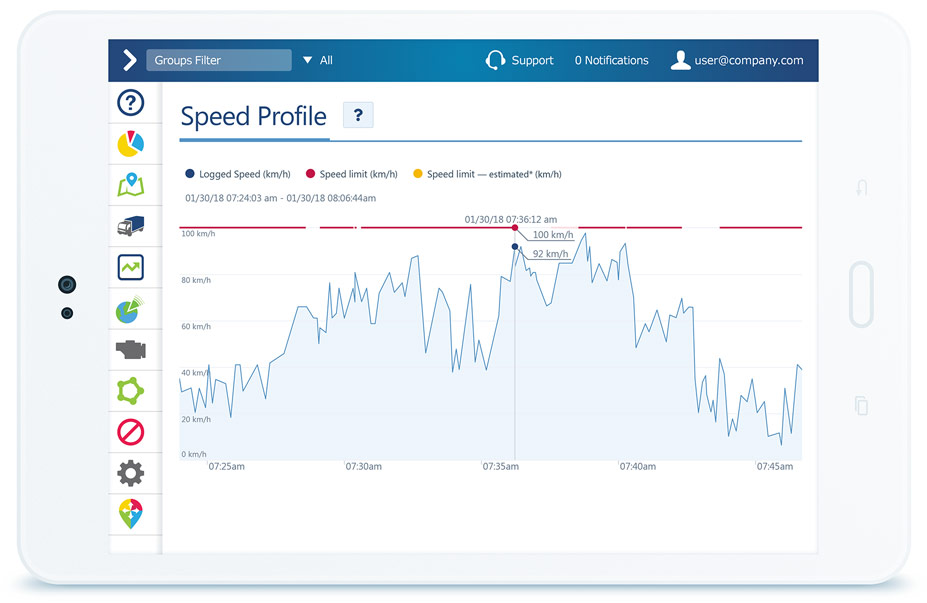
The Speed Profile is based on the GPS Speed data points recorded by the telematics device. Please refer to Collision & Log Data report to get the exact timestamps of the recorded GPS Speed.
Analyzing accelerometer data
Raw accelerometer data points
To look up the raw data points:
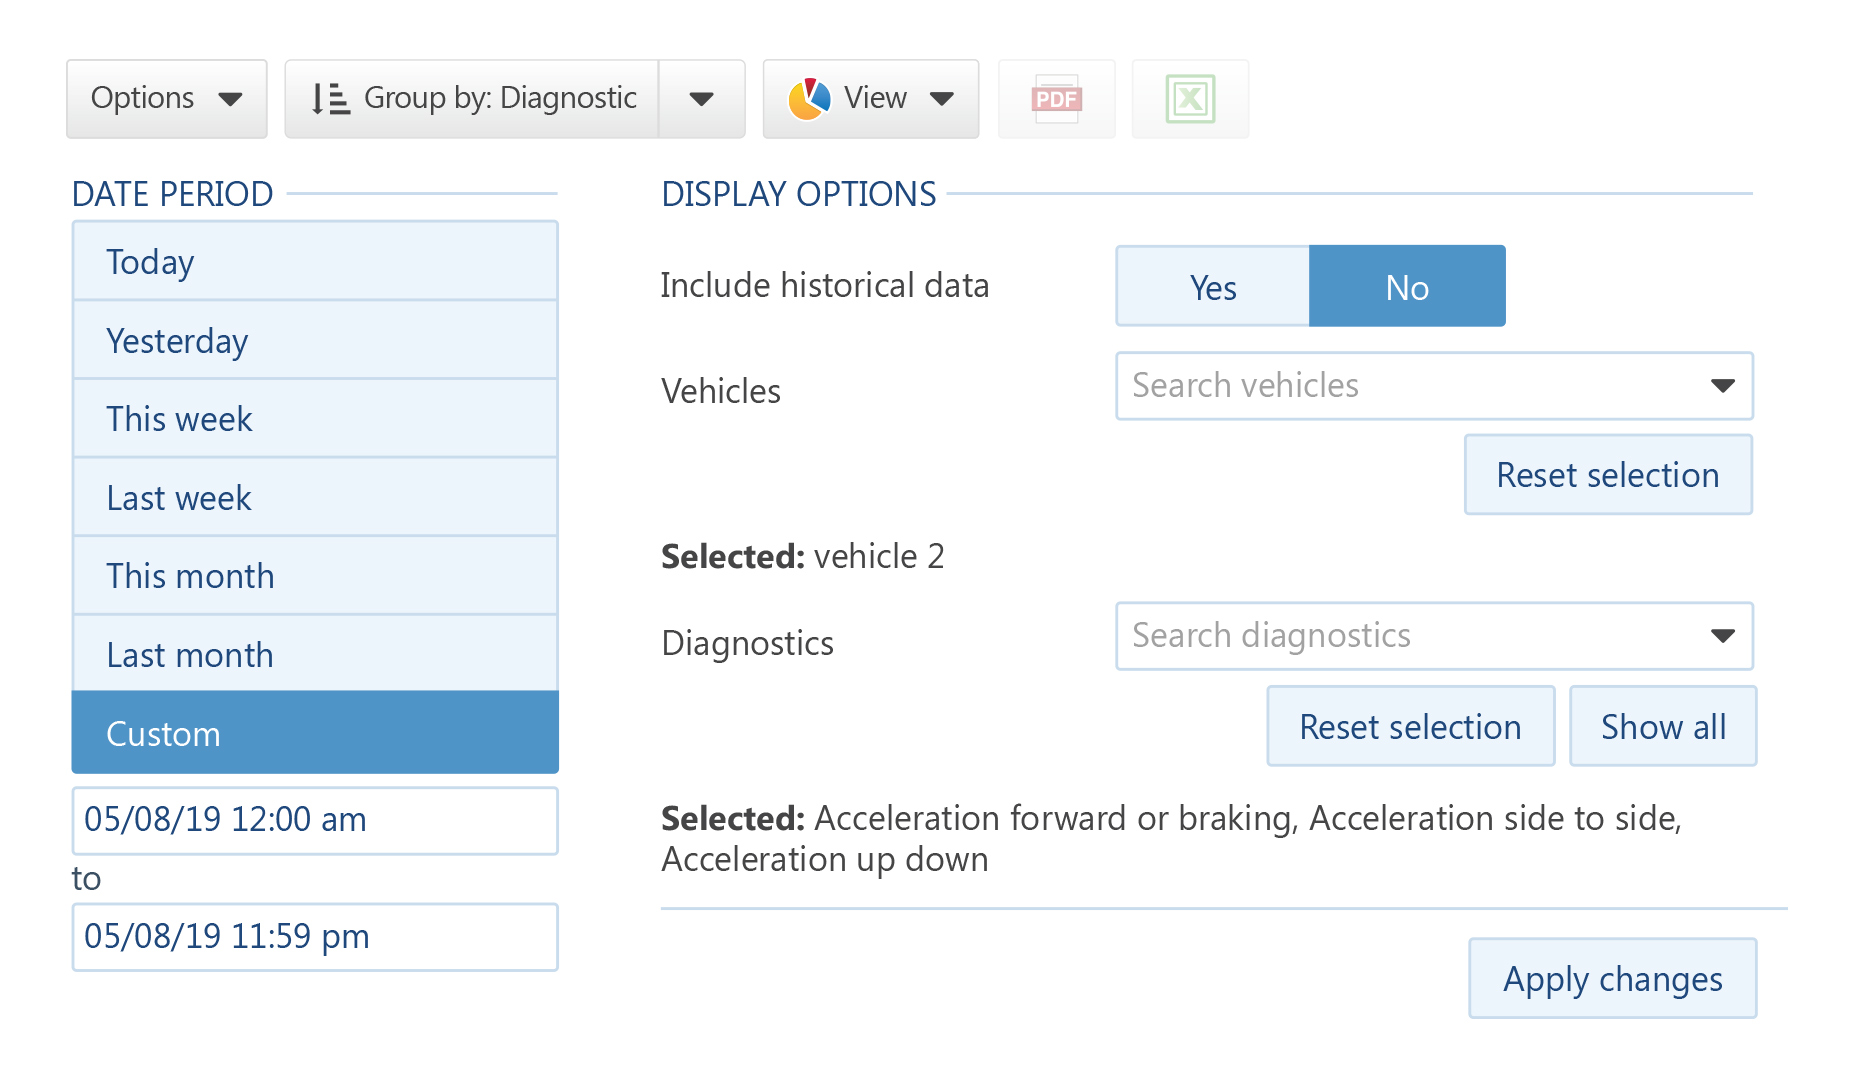
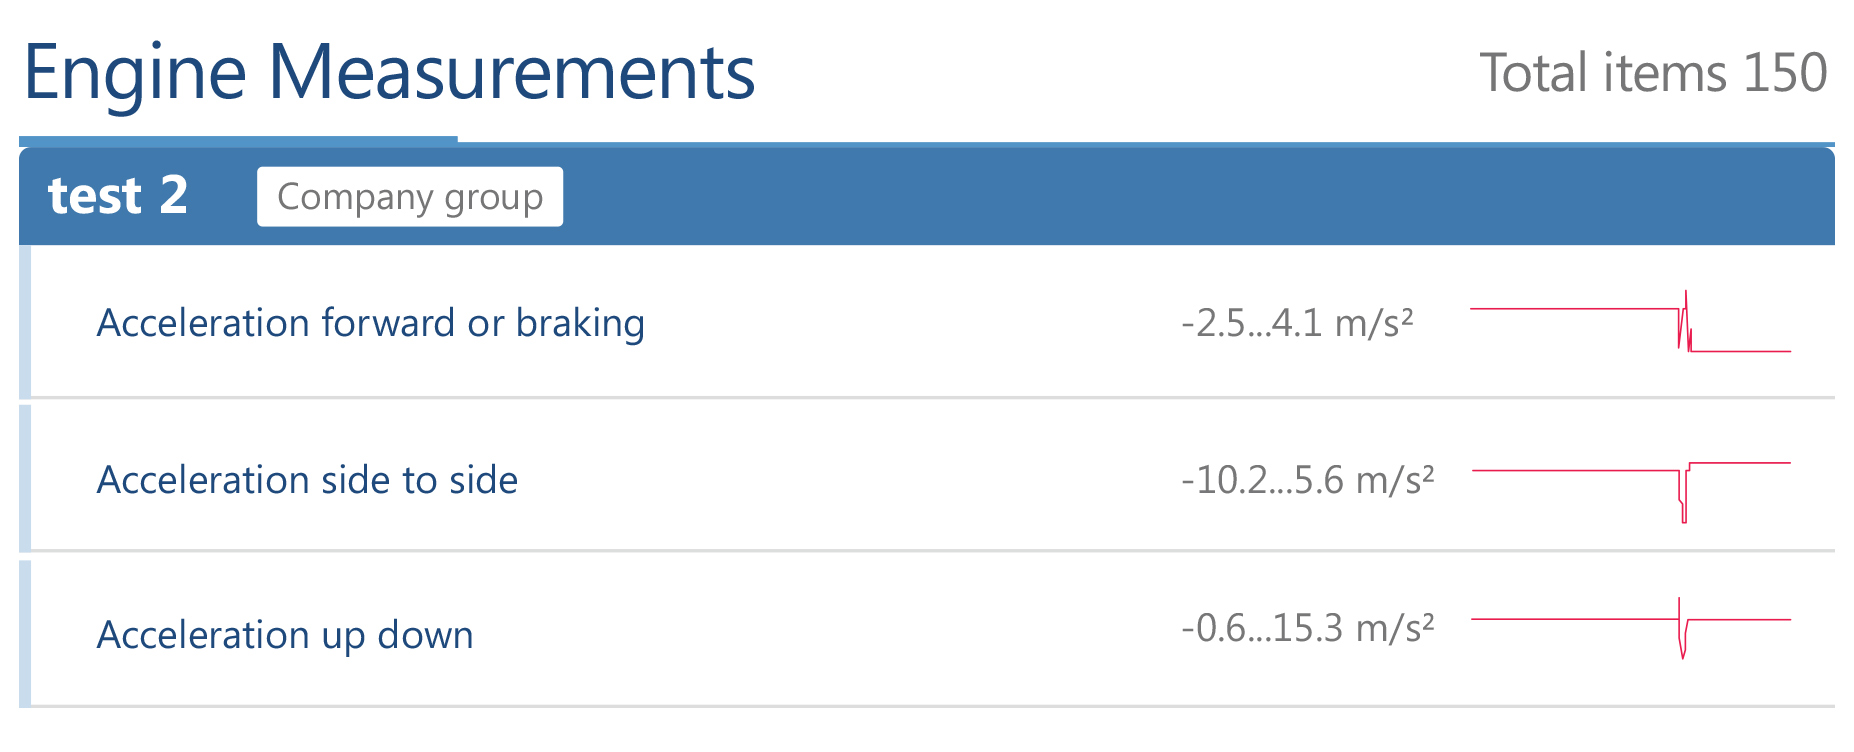
- In MyGeotab, select Engine and Maintenance > Engine and Device > Measurements.
- Using the Options dropdown menu, select the Date Period and Vehicle.
- At Diagnostics, use the dropdown menu to select Acceleration forward or braking and Acceleration side to side. Include Acceleration up down only if there was a rollover.
- Apply changes.
- You can download the report as a PDF or Excel file.
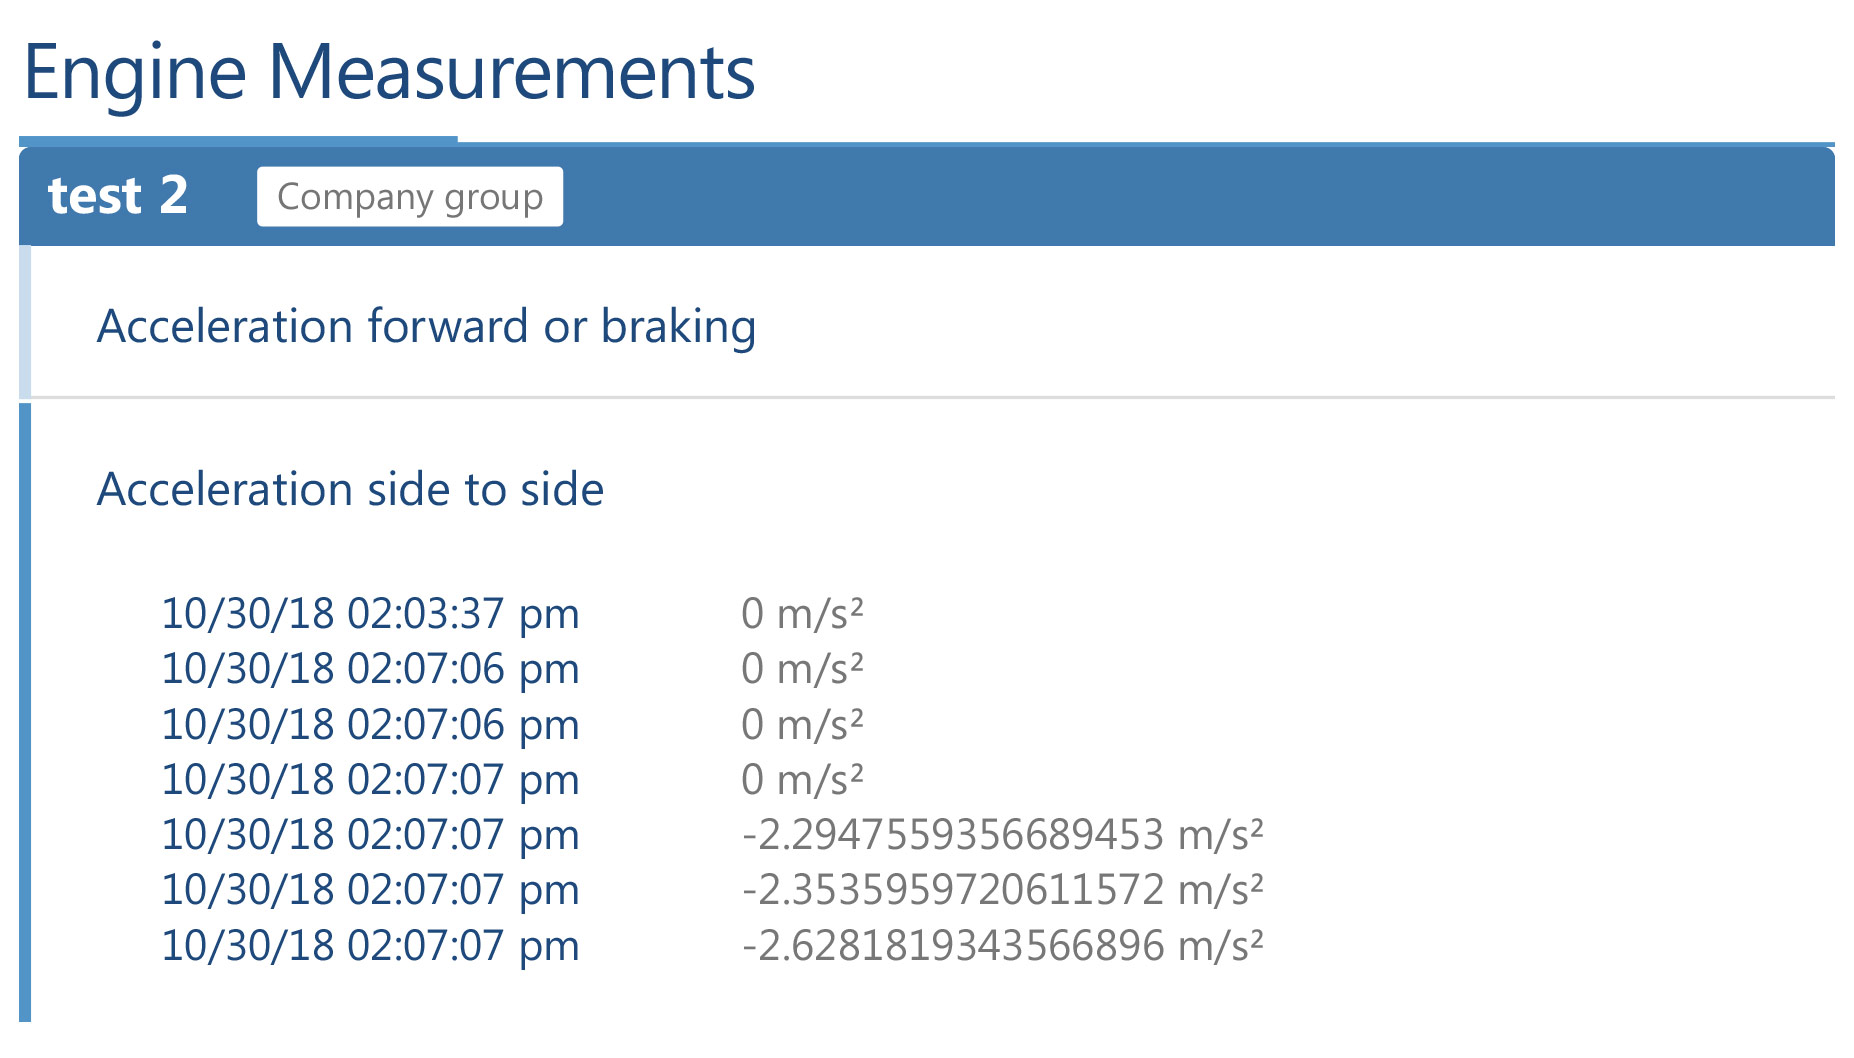
Use raw values as reference for your analysis. Geotab GO7, GO8 and GO9 devices report accelerometer data with a precision of approximately +/-1 mG*, processed ~100 times a second, subject to a 16 sample smoothing function and standard curve logic. That means accelerometer data should only be reported on up to 3 decimal places.
Example:
-2.2947559356689453 m/s² = -2.294 m/s²
Graph
1. In MyGeotab, select Engine and Maintenance > Engine and Device > Measurements.
2. Using the Options field select Device, Date.
3. For Diagnostics, select: Acceleration forward or braking and Acceleration side to side. Include Acceleration up down only if there was a rollover.
4. Select any of the graphs from the corner.
5. Using Options, reselect the Diagnostics and include Acceleration forward or braking and Acceleration side to side (as well as Acceleration up down for rollover incidents).
6. Apply changes.
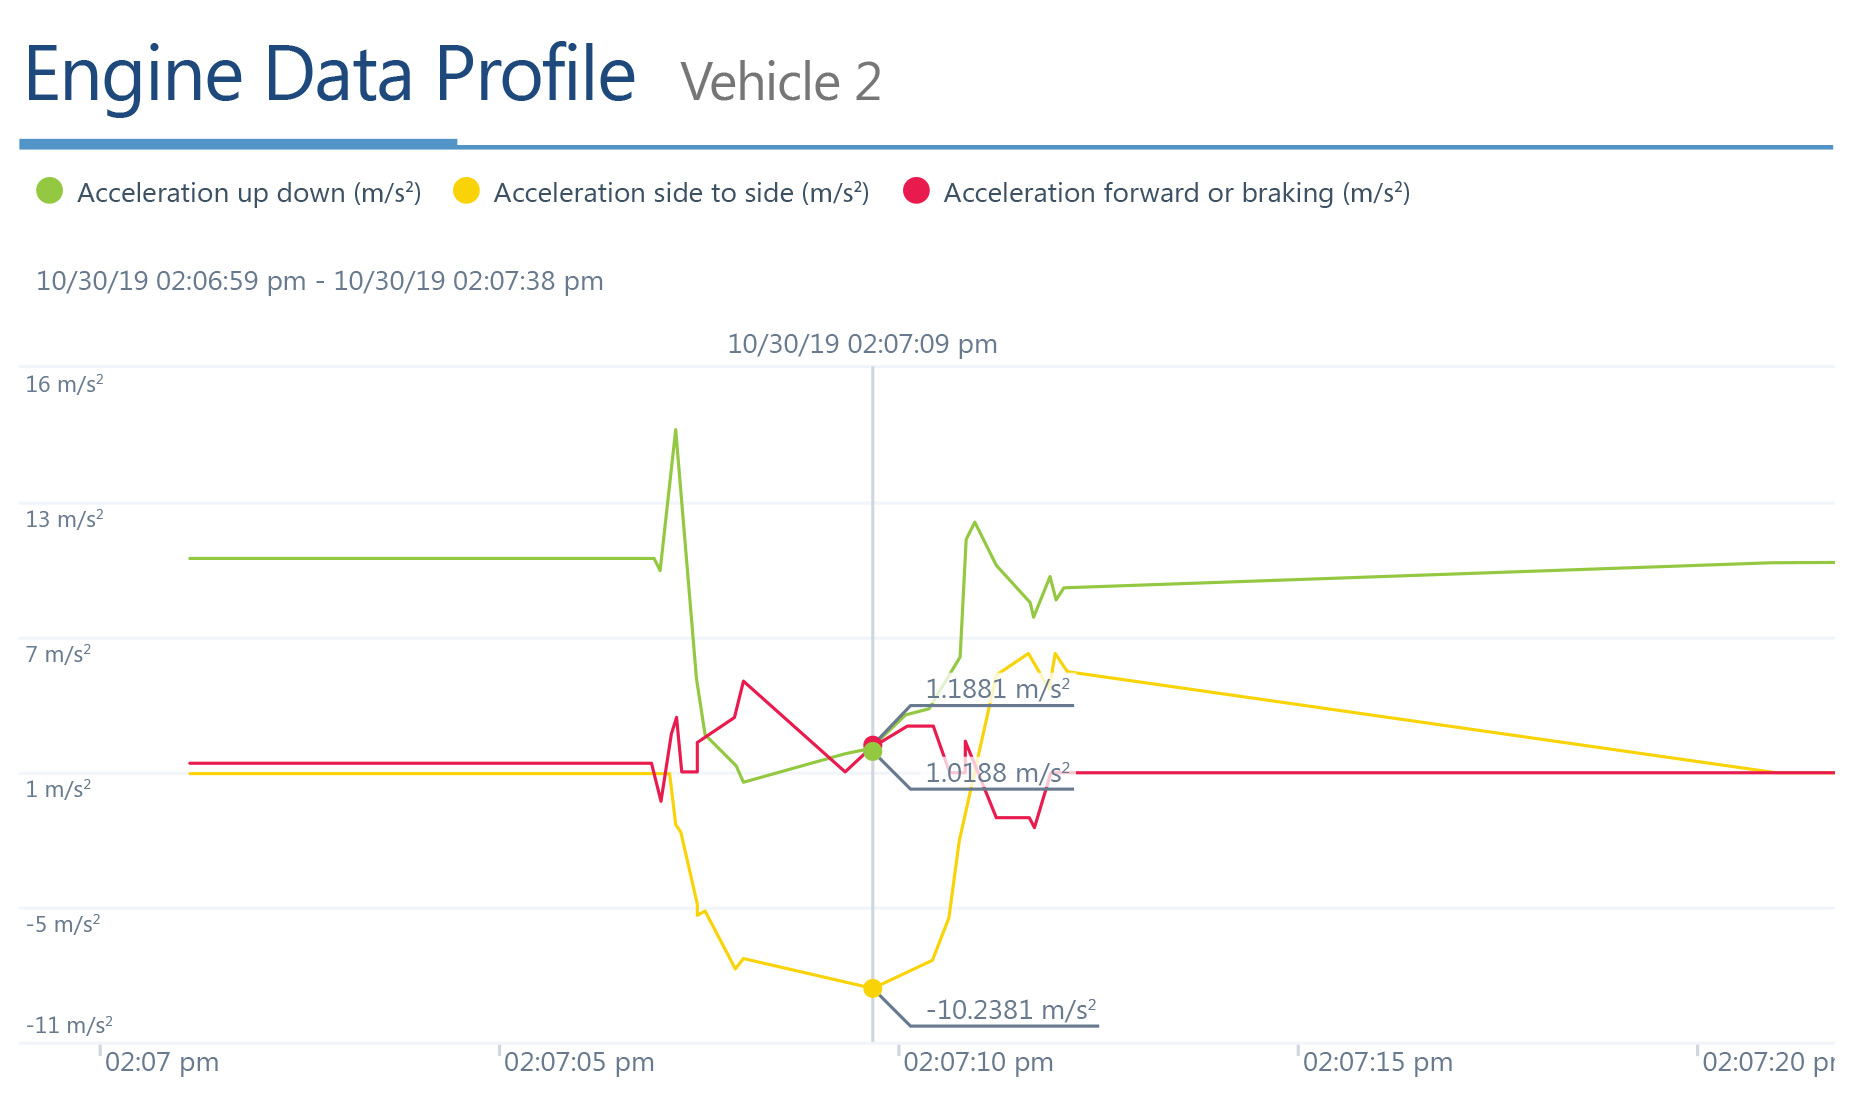
The graph provides a useful representation of the acceleration recorded by the telematics device. This helps to determine the acceleration experienced by the telematics device in all directions (longitudinal, lateral and vertical directions) at one point in time.
Accelerometer movement description:
- Acceleration Forward or Braking
- Acceleration in the forward direction is always a positive value.
- Deceleration or braking is always a negative value.
- Acceleration Side to Side
- Acceleration to the left is always a positive value.
- Acceleration to the right is always a negative value.
- Acceleration Up Down (Vertical) Acceleration up down measures acceleration applied on the vehicle in the vertical plane, such as speed bumps and potholes
- Positive is up acceleration.
- Negative is down acceleration.
It is recommended to reference the peak acceleration values experienced by the telematics device at the time of the Collision Level Event (use raw data points). The graph is a plot based on the raw data points recorded by the telematics device and interpolates between recorded data points. Please refer to Collision & Log Data report to get the exact timestamps of the recorded raw accelerometer data points.
What if no accelerometer data reported by a device?
Here are some reasons why this could happen:
- Accelerometer calibration
- In some instances, the accelerometer in the GO device may not have been calibrated at the time of a Collision Level Event. In these instances, three-axis accelerometer data and graphs are not available.
- Despite not being calibrated, a GO device’s accelerometer may still be used to detect Collision Level Events if a sufficiently large movement is measured between data points. The accelerometer is functioning and measuring acceleration, but the directions of measurement have not been aligned with the axes of the vehicle.
- Device plan
- If the GO device is on any plan lower than the Pro plan, three-axis accelerometer data and graphs are not available.
- Nevertheless, the accelerometer may still be used to detect Collision Level Events if a sufficiently large movement is measured between data points.
- Accelerometer has been disabled due to excessive logging (usually caused by a loose installation).
Engine Speed (Raw data points and Graph)
Raw engine speed data points
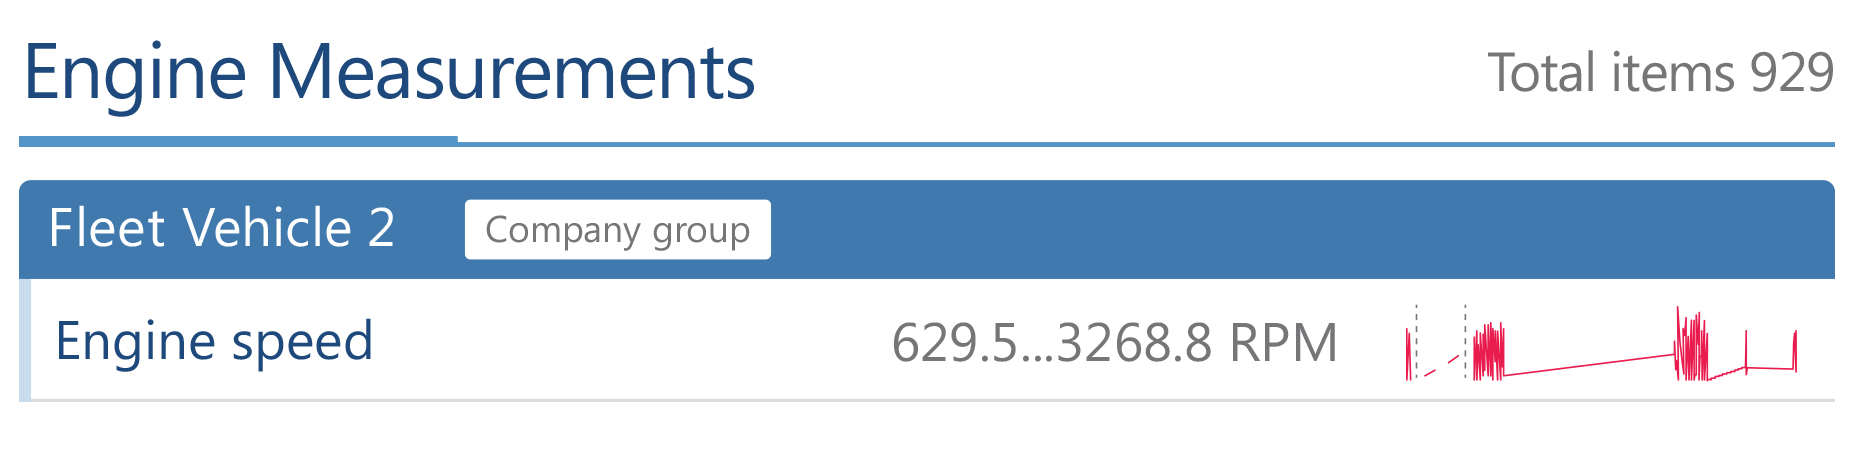
- From the MyGeotab main menu, select Engine and Maintenance > Engine and Device > Measurements.
- Using the Options, select the Date Period and Vehicle.
- At Diagnostics, select Engine Speed.
- Click Apply changes.
- You can download the report as a PDF or Excel file
Engine Speed (RPM) Graph
- From the MyGeotab main menu, select Engine and Maintenance > Engine and Device > Measurements.
- Using the Options field select Device, Date
- At Diagnostics, select Engine Speed.
- Click Apply changes.
- Select Graph on the top right corner.
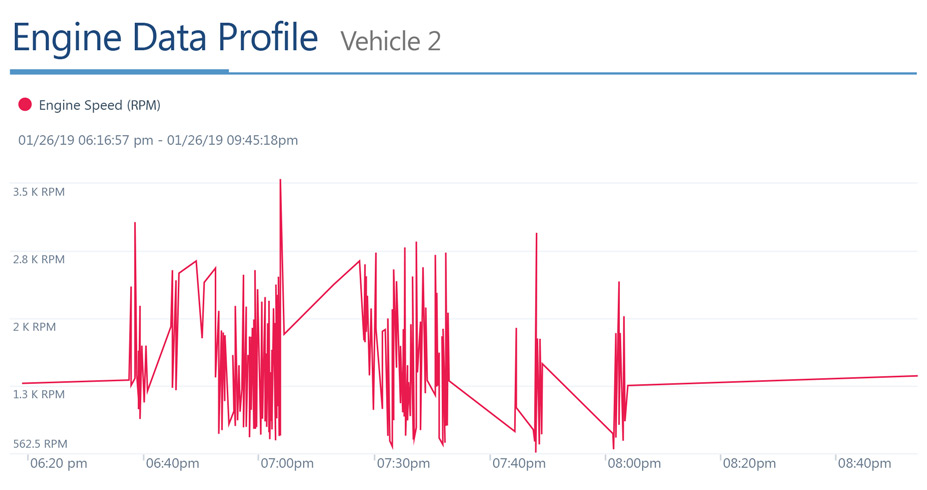
The graph is a plot based on the raw data points recorded by the telematics device and interpolates between those data points. Please refer to the Collision & Log Data report to get the exact timestamps of the recorded raw engine speed data points.
Advanced collision and log data report
This report provides the raw data including GPS, Accelerometer and Engine data that was recorded by the telematics device.
- In MyGeotab, select Activity > Log Data and Collisions > Options.
- Using the Options, select Date Period and Vehicle.
- Click Apply changes.
- You can download the report as a PDF or Excel file
Note: We recommend running the report for one vehicle at a time and to keep the date time range small as there will be a lot of data processed which can cause slow interface performance.
Geotab’s Collision Reconstruction is a free software Add-In from the Geotab Marketplace. Learn more about this solution at marketplace.geotab.com.
Contributer: Omed Sherzad, Engineering Support Specialist, Geotab Inc.
Post Tags
About Geotab
Geotab is a global leader in connected operations, video telematics and AI-powered insights. Trusted by more than 100,000 customers — from small and mid-size fleets to Fortune 500 enterprises and public-sector organizations, including the U.S. federal government — Geotab connects approximately 6 million vehicles and assets and processes 100 billion data points daily. With ISO/IEC 27001:2022, SOC2, FIPS 140-3 and FedRAMP authorizations, Geotab's open platform and partner ecosystem unify safety, compliance and operations in a unified system. Our mission: a safer, more efficient and more sustainable world in motion. Learn more at www.geotab.com and follow us on LinkedIn or visit Geotab News and Views.
GEOTAB and GEOTAB MARKETPLACE are registered trademarks of Geotab Inc. in Canada, the United States and/or other countries.
© 2026 Geotab Inc.All Rights Reserved.
This white paper is intended to provide information and encourage discussion on topics of interest to the telematics community. Geotab is not providing technical, professional or legal advice through this white paper. While every effort has been made to ensure that the information in this white paper is timely and accurate, errors and omissions may occur, and the information presented here may become out-of-date with the passage of time.
Recent News
-Thumbnail@1x.jpg)
Mining value from connected vehicle data: How OEMs can lead the next-gen of data-enabled services
November 11, 2021
Geotab smart intersection insights: Data-driven traffic signals in Las Vegas
March 16, 2020

Data-driven smart city insights: intelligent datasets and urban analytics for digital cities
September 1, 2017
Preserving privacy and security in the connected vehicle: The OBD port on the road ahead
December 3, 2015