47 road rage statistics for 2025
More than 1 in 4 Americans frequently witness road rage, showing that this dangerous behavior is fairly common and requires preventive measures to keep drivers safe.
By Geotab Team
May 30, 2025

Key Insights
- Around 96% of people have reported witnessing road rage recently.
- Nearly 50% of drivers who have experienced aggressive behavior on the road have admitted to responding with aggressive behavior of their own.
- Over 40% have witnessed other drivers honking out of anger, and more drivers admit to honking compared to other aggressive behaviors.
- Over 30% of adults between 19 and 24 years old reported driving aggressively — significantly more than any other age group.
- Rhode Island, Wyoming and Washington, D.C. had the highest percentage of speeding-related fatalities out of total reported traffic fatalities.
With 3.54 million drivers employed in the U.S. trucking industry, road rage disproportionately poses a risk to this demographic as both potential instigators and victims. Understanding the prevalence and patterns of road rage with vehicle telematics and enforceable safety standards is crucial for fleet managers looking to ensure the safety and well-being of their drivers.
Diving deeper into aggressive driving and road rage statistics can help drivers and managers recognize how widespread these issues are. This reflection can inform more proactive strategies to prevent and correct aggressive behavior within your fleet.
What is road rage?
Road rage refers to a feeling of intense anger, irritation or frustration that leads to aggressive or reckless driving. In many cases of road rage, drivers will use their vehicles to intimidate, punish or harass other drivers.
Incidents involving road rage may result in aggressive drivers being charged with assault and battery or vehicular manslaughter.
Road rage vs. aggressive driving
There is plenty of overlap between aggressive driving and road rage, but the former is a broader category of dangerous behaviors while driving.
Aggressive driving may be motivated by factors beyond frustration with traffic, road conditions and other drivers, but it can still endanger others. Road rage, on the other hand, is typically an aggressive display of anger directed towards other drivers, resulting in behaviors that target or affect surrounding vehicles.
Legally, aggressive driving is classified as a traffic violation, whereas road rage is a feeling that motivates aggressive behaviors. Behaviors associated with road rage may be considered criminal offenses.
Aggressive driving | Road rage | |
|---|---|---|
| Definition | Violating traffic regulations in a way that could endanger people or property | Frustration or anger while driving that results in reckless or aggressive driving behaviors |
| Example behaviors | Speeding, moving between lanes without signaling, driving through red lights | Honking or displaying rude gestures, tailgating to punish or cut off other drivers |
Common behaviors associated with road rage
Acting out of anger or frustration while driving is fairly common, but that doesn’t make it any less dangerous. Knowing what to look for to spot road rage can help fleet managers make better use of driver behavior monitoring. This technology allows you to track and correct aggressive actions, such as:
- Swearing, shouting or expressing other profanity
- Displaying rude gestures
- Flashing headlights to intimidate other drivers
- Slamming on the brakes unnecessarily
- Hitting, bumping, clipping or ramming into another vehicle
- Steering another vehicle onto the shoulder or off the road
General road rage and aggressive driving statistics
Aggressive driving and road rage are fairly common, and that makes them all the more dangerous, especially for members of your fleet. Experiencing or demonstrating aggressive behavior while operating a heavier vehicle or carrying cargo can increase the likelihood of a costly and potentially fatal accident.
1. More than 1 in 4 Americans frequently witness road rage.
2. Another study found that 96% of people have reported witnessing road rage.
3. Most drivers perceive running through red lights, switching lanes rapidly and tailgating as very or extremely dangerous driving behaviors.
4. Nearly 95% of American drivers believe that driving through a red light or driving aggressively would be met with partial or total disapproval by the people who are important to them, reflecting some of the highest rates of perceived social disapproval among distracted and aggressive driving behaviors.
5. Around 50% of drivers who have experienced aggressive behavior, such as rude gestures or horn honking, on the road have admitted to responding with aggressive behavior in kind.
6. Over 40% have witnessed other drivers honking out of anger, and more drivers admit to honking compared to other aggressive behaviors.
7. In 2024, nearly 50% of Americans reported that they felt people in their communities were driving less safely compared to five years previously.
8. In 2023, 48 percent of American drivers reported driving 15 MPH or more over the speed limit on a freeway within the previous month.
9. Over 50% of drivers are against using cameras to automatically issue tickets to drivers who exceed the speed limit in residential areas by 10 MPH or more.
Historical road rage statistics
Aggressive driving behavior has been a major factor for driver safety since cars were invented, though the term is much more recent. With more vehicles on the road, road rage-related incidents have increased in recent decades, posing an added threat to drivers’ safety.
10. The term “road rage” became popularized in the 1980s after a series of freeway shootings in Los Angeles, California.
11. Between 1990 and 1996, road rage caused more than 200 fatalities and 12,600 injuries.
12. At least 58 individuals were shot and killed during road rage incidents in 2018. By 2023, the number of road rage shooting fatalities increased to 118.
13. In 2018, there were 160 reports of individuals wounded during a road rage incident with a firearm; this number grew to 365 in 2023.
Road rage statistics by age
Drivers of any age can display aggressive behaviors or exhibit road rage, though younger drivers may do so more frequently, likely due in part to less experience on the road.
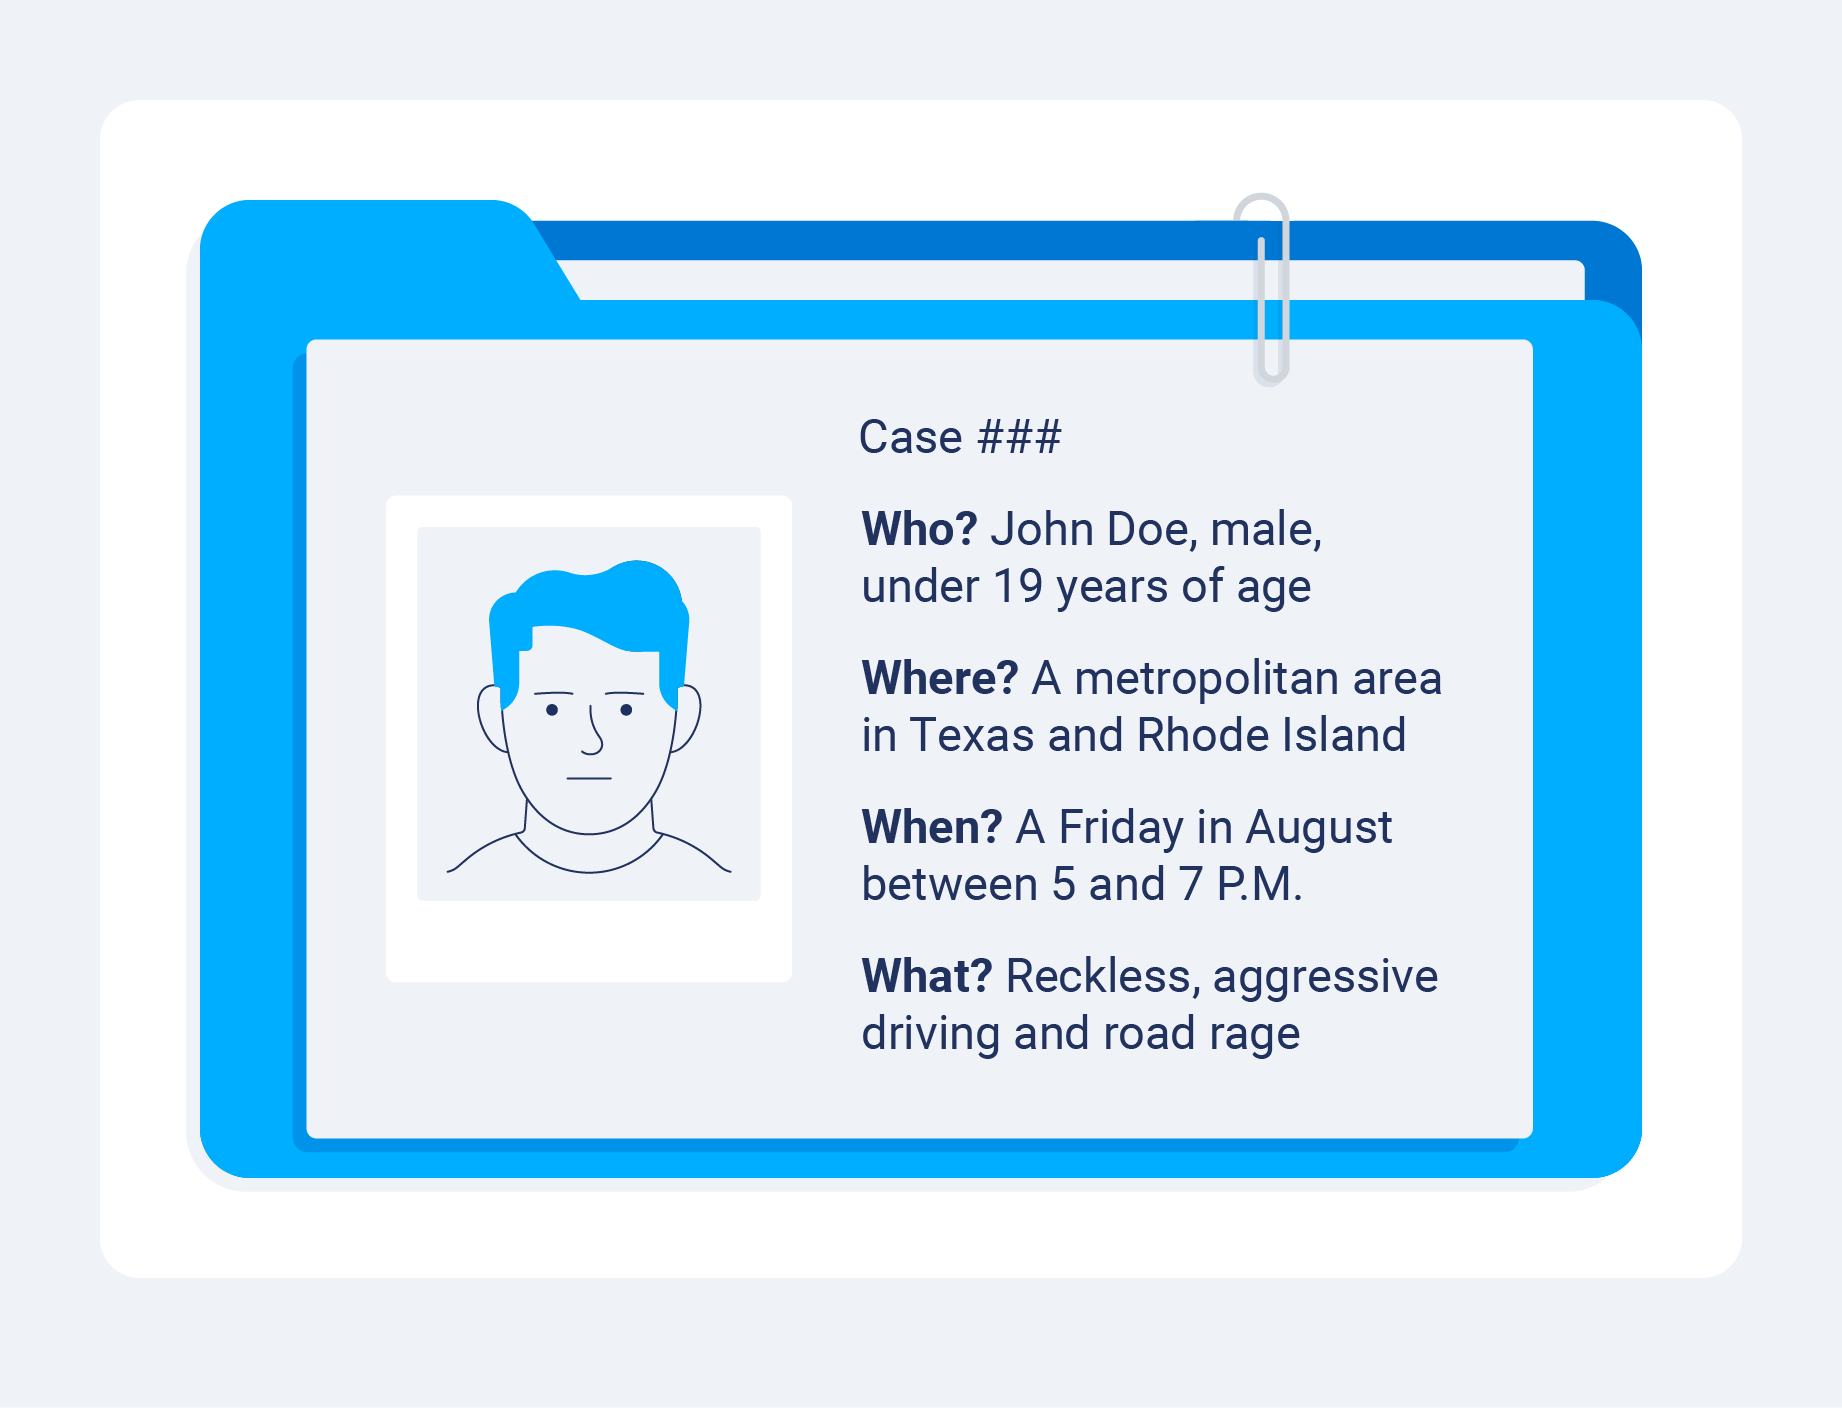
14. Men under the age of 19 are more likely to demonstrate aggressive driving behaviors and road rage.
15. Over 30% of adults between 19 and 24 years old reported driving aggressively — significantly more than any other age group.
16. More than 50% of adults between age 19 and 39 admit to speeding on freeways.
17. Nearly 49% of drivers aged 16 to 18 admitted to driving 10 MPH over the speed limit on residential roads compared to the 36.3% of all drivers.
18.More distracted and aggressive drivers were working adults between the ages of 25 and 39 who had never married and lived with children under age 18, compared to the larger driver population.
Road rage statistics by gender
Data suggests that men experience road rage more often, but gender does not significantly impact who displays aggressive driving behavior. However, socialization may affect how drivers express their frustration on the road.
Just because men may demonstrate aggressive driving more frequently, you should coach drivers of all genders to operate their vehicles safely.
19. Regardless of gender, roughly 80% of Americans have acted aggressively while driving.
20. A 2019 survey found that men are more likely to engage in aggressive driving behaviors than women.
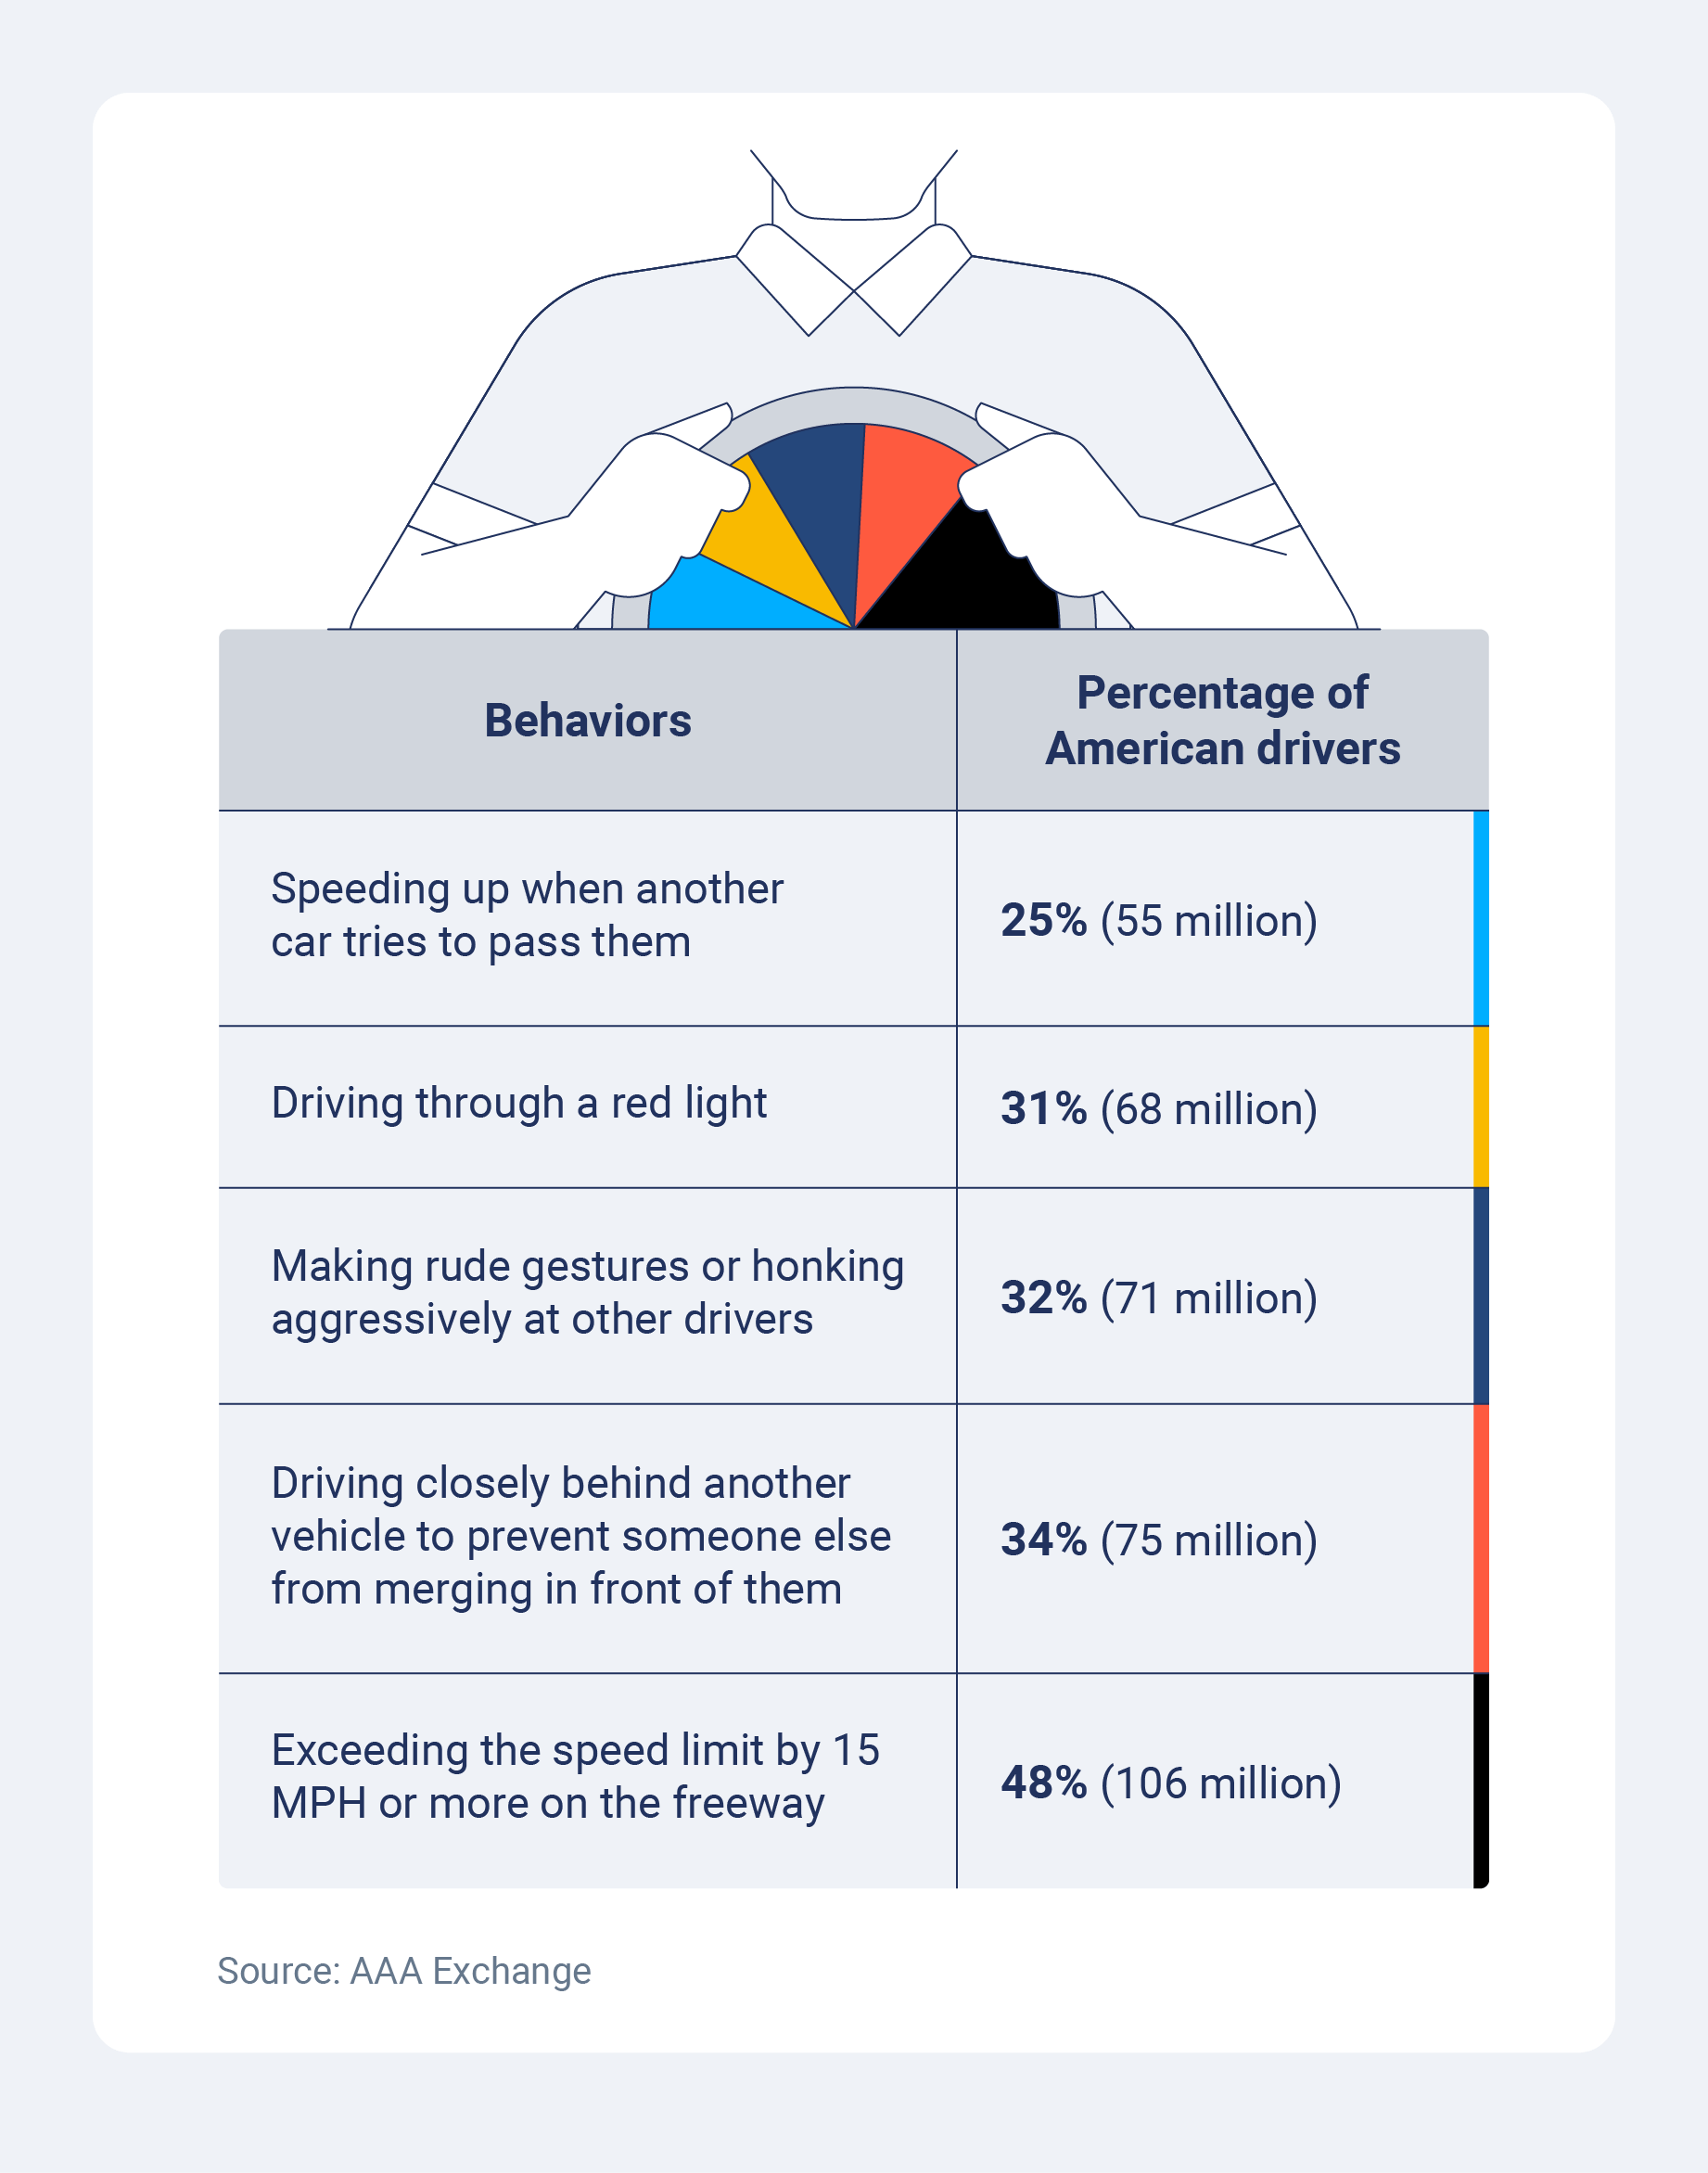
21. Men are much more likely to merge into traffic even when another vehicle attempts to prevent them from doing so, with 32% of men admitting to this behavior compared to 25% of women.
22.More than 50% of men admitted to exceeding the speed limit by at least 15 MPH on a freeway compared to nearly 45% of women, making this the most common display of aggressive driving regardless of gender.
23. Just over 1 in 5 men and women report passing in front of another vehicle when there wasn’t a full car length of space available, making this the least common example of aggressive behavior for drivers of the nine described.
Aggressive driving statistics by state
Road rage incidents can vary, depending on the region. Higher amounts of traffic, denser populations and firearm legislation can all contribute to variable incident rates across the country.
Drivers in urban areas who have to navigate congested traffic may be more likely to witness or experience aggressive driving, making it especially important to emphasize safe driving habits in those regions.
24. Over 91% of drivers classified as distracted and aggressive reside in metropolitan areas, suggesting a higher percentage of distracted and aggressive driving in urban developments.
25. Those who live in urban areas are more likely to see signs of aggressive driving; around 33% of people who live in a city see road rage often, compared to around a quarter each of those in suburban or rural areas.
26. Texas, California and North Carolina had the highest number of speeding-related fatalities in 2022.
27. But Rhode Island, Wyoming and the District of Columbia had the highest percentage of speeding-related fatalities out of the total reported traffic fatalities.
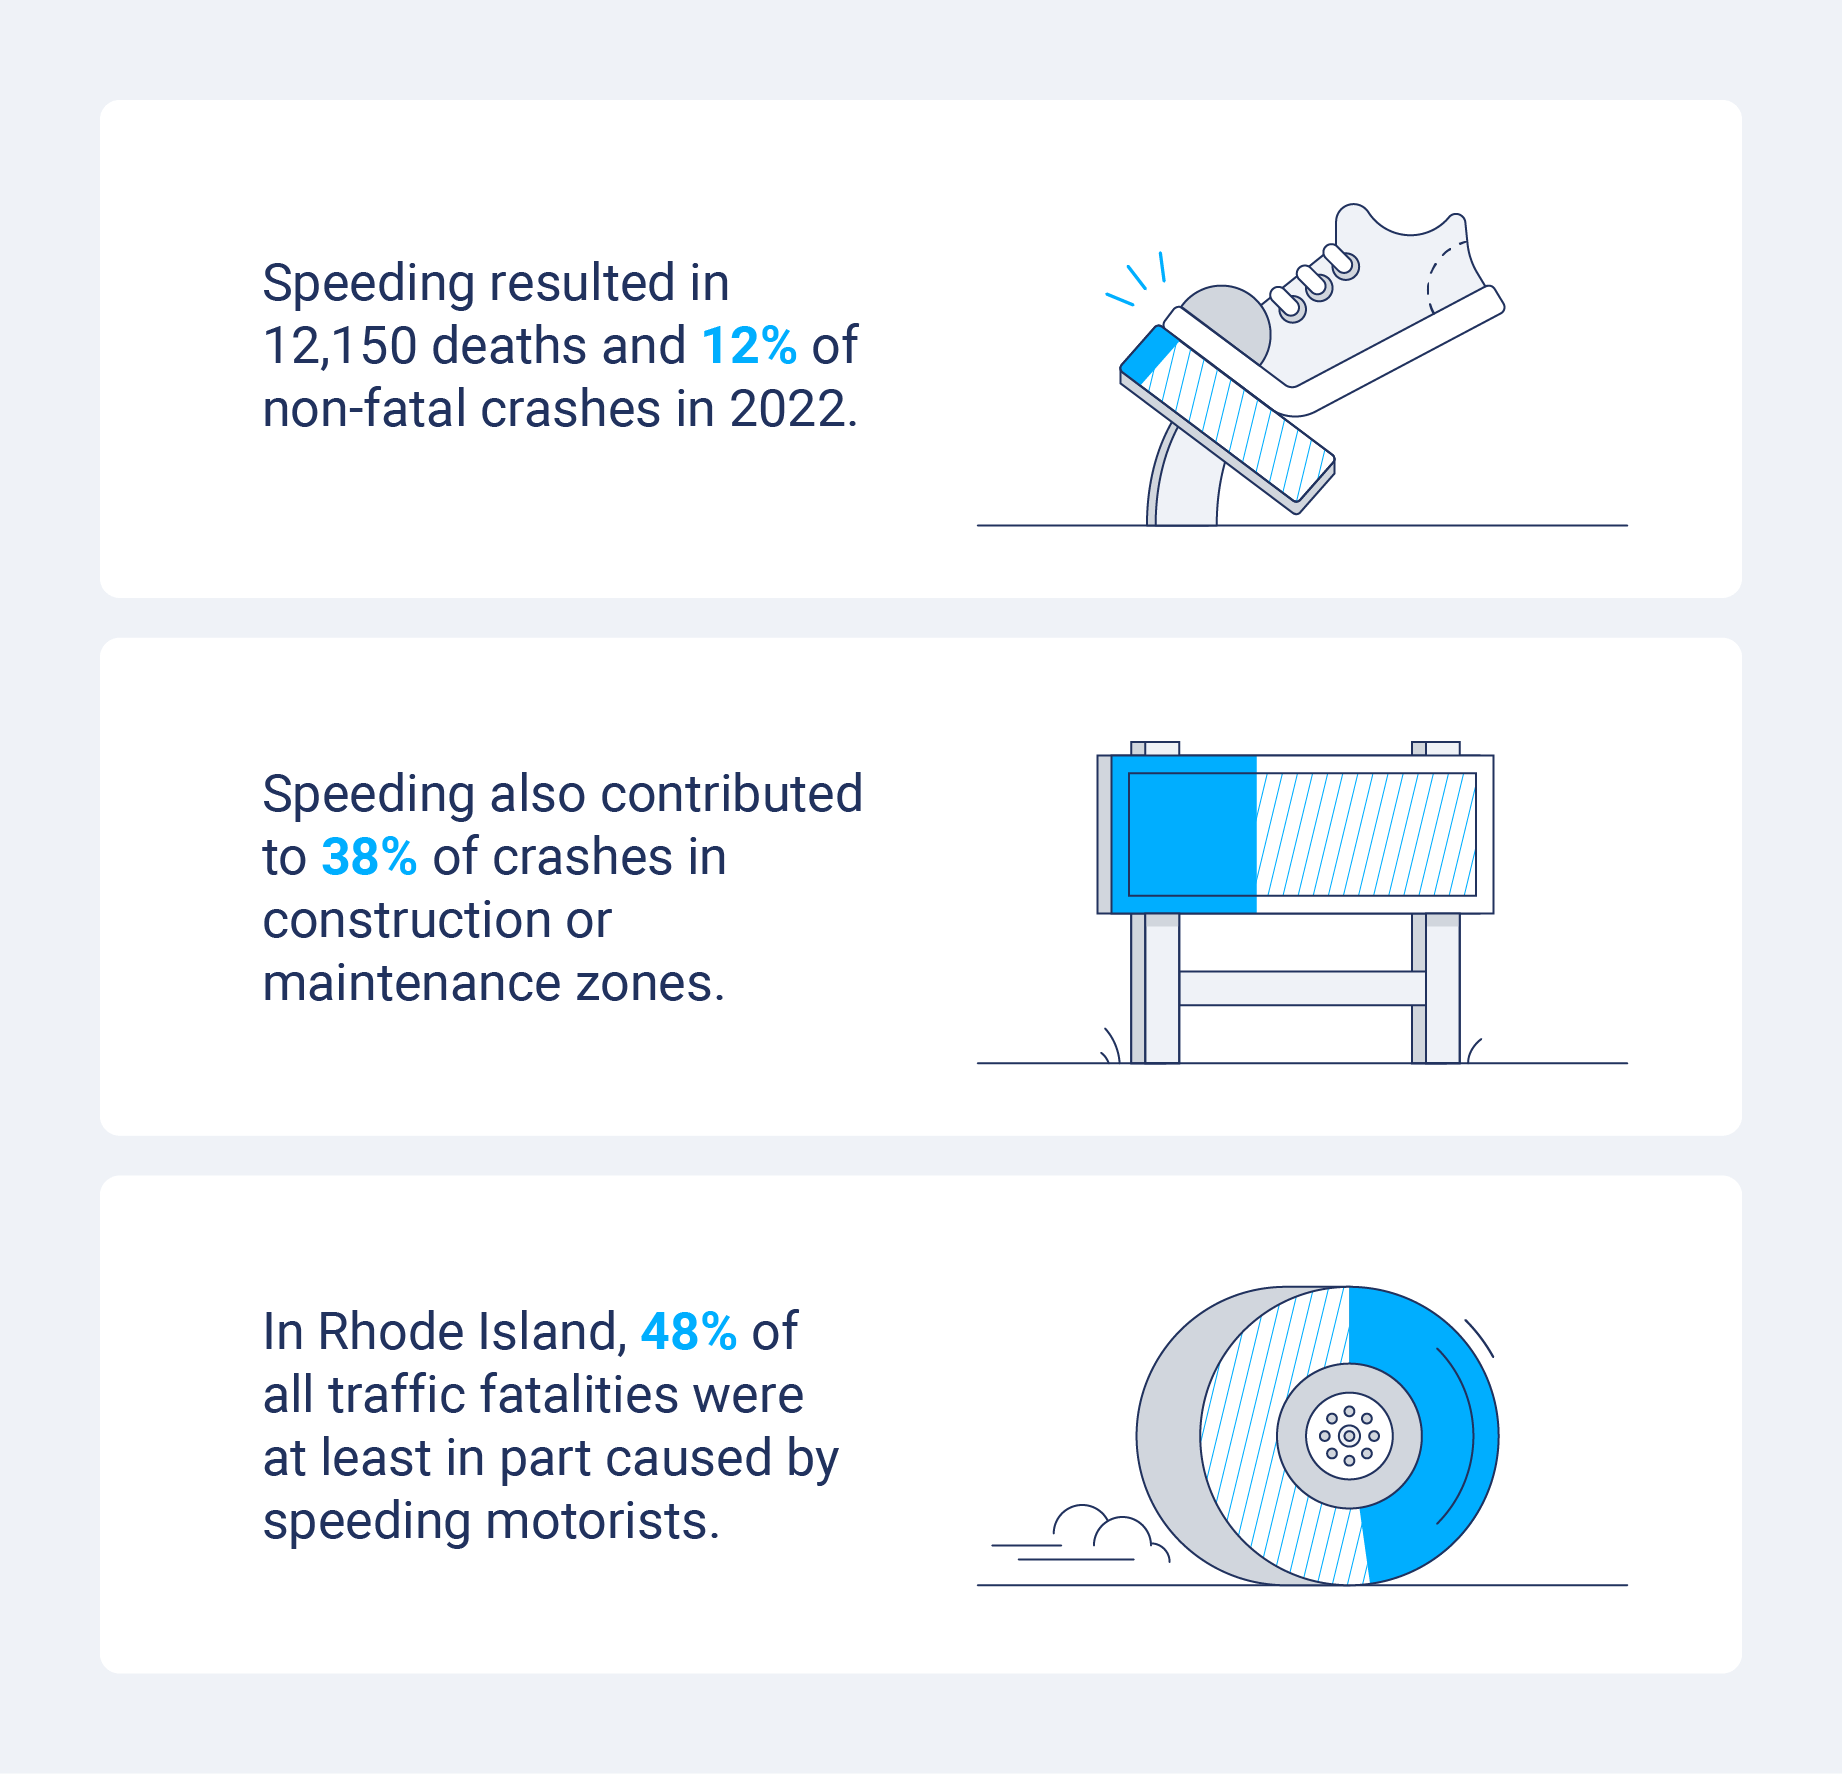
28. In Rhode Island, 48% of traffic fatalities were at least in part caused by speeding motorists.
29. Between 2014 and 2024, the states with the most gun-related road rage incidents include: Texas (808), Florida (511), California (346), Tennessee (278) and Georgia (214).
30. In the same 10-year period, the states with the highest gun-related road rage incident rate include: New Mexico, Tennessee, Wisconsin, Texas and Arizona.
Aggressive driving and road rage are often dangerous and can be fatal. Using telematics to collect and analyze accident data can help fleet managers implement and enforce safety protocols to reduce aggressive driving incidents and encourage drivers to obey the speed limit.
31. Between 1993 and 2017, traffic fatalities increased by 8.5% along with a 5 MPH speed limit increase, suggesting that higher speeds contribute to higher death tolls.
32. Speeding resulted in over 12,150 deaths in 2022 — amounting to 28% of all fatal crashes that year.
33. In 2022, speeding also contributed to 12% of non-fatal crashes resulting in injury.
34. 35% of motorcyclists involved in fatal crashes had been speeding, a higher percentage than any other group of motorists.
35. Speeding contributed to 38% of the fatal crashes in construction or active maintenance zones.
Reckless driving statistics
There is significant overlap between aggressive driving and reckless driving, though reckless driving is not necessarily motivated by anger, stress or frustration. Reckless driving encompasses a range of behaviors that ultimately demonstrate disregard for the safety of other motorists, pedestrians and property.
Driving recklessly can include driving while distracted or drowsy, operating a vehicle under the influence of drugs or alcohol, and failing to yield — all of which can pose increased risk to the driver and those around them.
36. Drowsy driving killed at least 693 people in 2022.
37. Drivers involved in a fatal crash are more likely to be charged with reckless driving than with any other traffic violation.
38. In 2022, nearly 4% of motorists involved in fatal crashes were charged with operating a vehicle in an erratic, reckless or negligent manner.
39. 93% of drivers believe using a hand-held cell phone to text or email is very or extremely dangerous.
40. Fewer drivers (78%) believe that taking a call on a handheld phone is very or extremely dangerous.
41. Just 16% said that using hands-free technology is very or extremely dangerous, and nearly 59% of drivers admitted to using this technology at least once in the 30 days before taking the survey.
42. More people believe that it is more dangerous to type on a mobile device (69%) than read a text or email (66%) while driving.
43. More than half of drivers in the U.S. believe that they would be pulled over and ticketed for driving 15 MPH over the speed limit. At the same time, nearly half of the drivers surveyed admitted to speeding within the preceding month.
For fleets, monitoring driver behavior for distracted, aggressive or otherwise reckless actions can keep your drivers, vehicles and other motorists safe.
Improve fleet safety with driver safety reports
Road rage and safety
Road rage endangers everyone, including drivers, passengers and other motorists. Fleet organizations and their drivers should take precautions to adequately prepare for stressful situations on the road.
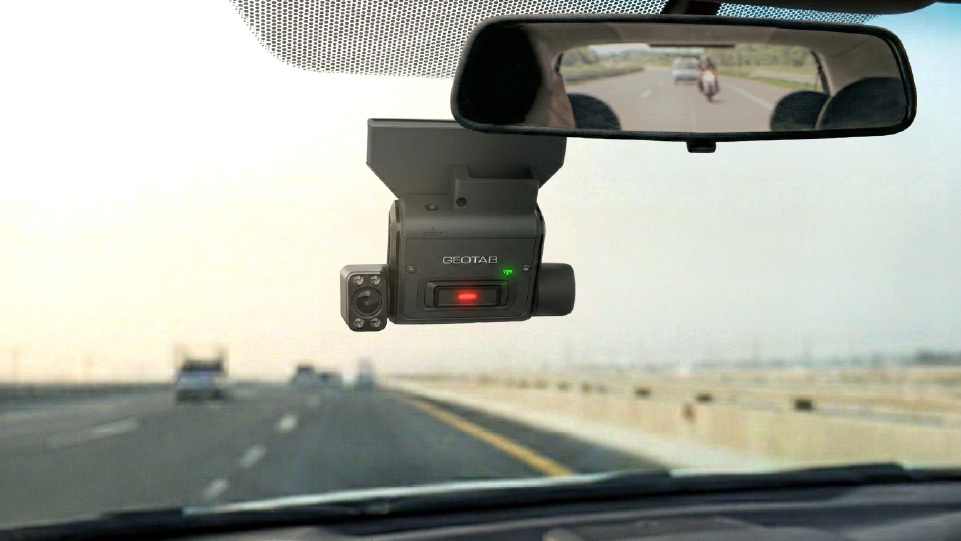
Dash cams, safe driving policies and regular defensive driving training can help keep your drivers safe and reduce aggressive driving behavior, road rage and traffic incidents. Implementing a fleet driver safety program can also encourage safe driving behaviors and prevent incidents on the road.
44. One study suggests that aggressive driving is not solely caused by anger but may also be influenced by elevated driving stress or anxiety, resulting in hostile behavior.
45. According to a 2024 survey of over 5,000 Americans, 63% believe that people who drive too fast or aggressively are a major concern in their local communities.
46. Nearly 18% of distracted and aggressive drivers were involved in one or more reported crashes — the highest of any classification and higher than the 11% of total drivers involved in reported incidents.
47. A 2021 study suggests that anger management and emotional regulation strategies could help reduce aggressive driving and road rage incidents.
Keep your drivers safe and accountable with Geotab’s fleet dash cams
Road rage risk factors
Driving can be an inherently stressful activity, which increases the risk of heightened emotions and aggressive behavior. A combination of personal and environmental elements can increase the likelihood of someone experiencing and acting on feelings of road rage.
Anyone can experience or demonstrate road rage, but what causes aggressive driving? These behaviors tend to be caused by several factors, including:
- Amount of traffic or traffic density
- Time spent driving that day
- Displaced anger or aggression
- A tendency to blame others
- Substance use disorders
According to the AAA Foundation, the following characteristics are more common among distracted and aggressive drivers:
- Age: 16 to 18
- Gender: Male
- Relationship status: Never married
- Car age: 0-4 years
- Driving days per week: 6-7 days
This profile suggests that inexperienced drivers who spend a lot of time on the road are more likely to demonstrate aggressive driving behavior or road rage. Acknowledging demographics who are more likely to drive aggressively can help fleets implement proactive strategies and policies.
The following report reflects some of the most common factors that may contribute to a road rage-related incident.
According to Auto Insurance Center’s social media study of Instagram posts, other factors contribute to an increase in aggressive driving, such as:
- Month: August
- Day of the week: Friday
- Time of day: 5 to 7 P.M.
Summer heat, vacation traveling, work week stress and rush hour traffic seem to be a recipe for irritation and aggression, resulting in higher rates of road rage.
Tips for preventing aggressive driving
Driving can be stressful and dangerous even without aggressive behavior behind the wheel. For fleet managers, ensuring your drivers operate your vehicles safely and professionally prevents them from injuring themselves and others.
The best ways to avoid aggressive driving and road rage among your drivers are by taking proactive steps to keep them informed about potential hazards and equip them with the tools and skills they need. Using driver scorecards can keep drivers accountable and identify any areas of concern.
- Clearly communicate potential consequences: Understanding and conveying how aggressive driving can endanger your employees and other drivers can help your fleet recognize the risks and costs, such as bodily harm and fines.
- Implement safe driving policies: Clearly define expectations for drivers with a zero-tolerance approach to violations, and reward compliance with a driver incentive program that promotes safety.
- Offer preventative and remedial training: Provide employees with tips for driving defensively, responding to aggressive drivers and using telematics.
- Utilize telematics: Track vehicle speed, braking and acceleration patterns, and location in real-time to assess and respond to aggressive or distracted driving on a case-by-case basis.
- Monitor driver behavior: Routine driver and vehicle audits can help ensure compliance, safety, and accountability and enforce your policies.
Encourage safe driving with Geotab’s driver coaching solutions. With real-time monitoring and immediate automated feedback, you can motivate your drivers to reduce aggressive driving habits through gamification and driver scorecard reports.
Educate your drivers and promote good driving habits
Maintain driver fleet safety in the face of road rage
Road rage isn’t the only threat to driver safety, but it is a major cause of traffic incidents, injuries and fatalities. Considering the road rage statistics above suggests that aggressive driving behavior is a common issue that can jeopardize driver safety.
Taking necessary steps to reduce road rage among your drivers should be a critical part of your fleet safety solutions. By analyzing real-time data, monitoring driver behavior and enforcing safe driving practices with safety scorecards, you can encourage and incentivize your drivers to operate their vehicles professionally and safely.
Aggressive driving behavior — the kind behind these statistics — is exactly what Geotab Vitality's scoring targets. By rewarding drivers for consistent, calm driving behavior over time, Geotab Vitality builds the habits that reduce aggressive driving at the fleet level.
Subscribe to get industry tips and insights
Frequently Asked Questions
Yes, data suggests that aggressive driving behavior and road rage incidents are increasing. For example, gun-related traffic injuries and fatalities in the U.S. increased between 2018 and 2023, indicating a growing problem.
Aggressive driving is commonly associated with frustration and stress, as well as time spent in traffic and a disregard for other drivers.
Speeding, tailgating, driving through red lights and honking at other drivers are some of the most common examples of aggressive driving.
Around two-thirds of traffic fatalities are the result of road rage incidents, but it is unknown how many accidents overall are caused by this kind of aggression.
If you are involved in a car accident or other incident due to your road rage, there is a strong chance that your insurance premium may increase anywhere from a few hundred to over one thousand dollars. In extreme cases, road rage and other aggressive driving behaviors may result in the termination of your coverage due to an increased risk of collision.
The Geotab Team write about company news.
Table of Contents
- What is road rage?
- Common behaviors associated with road rage
- General road rage and aggressive driving statistics
- Historical road rage statistics
- Road rage statistics by age
- Road rage statistics by gender
- Aggressive driving statistics by state
- Reckless driving statistics
- Road rage and safety
- Road rage risk factors
- Tips for preventing aggressive driving
- Maintain driver fleet safety in the face of road rage
Subscribe to get industry tips and insights
Related posts
Fleet Safety Results: Richfords Cuts Speeding and Harsh Driving with Geotab Vitality
May 11, 2026
3 minute read
Geotab dash cams: Compare AI-powered GO Focus, Plus, and Pro models
April 8, 2026
6 minute read

Building a coaching culture: How to end the ‘gotcha’ game in your fleet
March 4, 2026
4 minute read


The Simple Truth: Why Rewarding Safe Driving is Your Fleet’s Smartest Business Decision
February 25, 2026
4 minute read