How the AirQuality project is creating cleaner air in German communities
Learn more about the creation of hyperlocal air quality maps in real time using mobile measurements.
Jul 1, 2025

The effect of pollutants on air quality is a relevant issue for many cities. Across Germany, formal monitoring of air pollutants is carried out using approximately 400 stationary, local measuring stations associated with the German Federal Environment Agency. While these stations provide very high accuracy, the acquisition costs are high and their small number means that measurements can only be taken at individual, fragmented measuring points within a city.
Low-cost sensors, on the other hand, can also be distributed in larger quantities throughout the city to obtain a more accurate picture of citywide air quality.
Building transparency in air quality
Creating transparency regarding the air quality of the entire urban area requires a tightly meshed network of air quality sensors, which can identify local problem areas in relation to the time of day, however this is lacking. The AirQuality project (a collaboration between Geotab GmbH and the Service Performance Center of FIR e.V. at RWTH Aachen University) aims to develop a method for collecting air quality data with a previously unavailable level of granularity.
Fleets traveling within an urban area, such as local public transport vehicles, are being equipped with sensors developed in-house to measure air quality. The data collected from these sensors is analyzed and then visualized in a "heat map" superimposed on the city map.
This air quality map displays the air quality accurately for each street and time of day. This makes it possible to identify hotspots, objectively evaluate measures to reduce emissions or to create innovative solutions such as smart traffic lights or optimized routing for members of the public based on current air quality values. This is now known as the AirQuality project.
What is the AirQuality project?
To implement the AirQuality project, vehicles in Aachen are being equipped with the necessary sensor technology. For this purpose, low-cost sensors available on the market for measuring particulate matter (PM) 10, PM 2.5, humidity and temperature are assembled in a small sensor stack in a modular format. This stack is then installed on previously selected vehicles, such as service vehicles and buses in Aachen.
On daily journeys, data is collected and transmitted to a gateway server architecture using the GO device (including IOX Bluetooth) located in the OBD2 port of the vehicles. This data is then transmitted from the gateway server architecture to a database (see Figure 1).
Measured sensor values are then superimposed with the corresponding GPS coordinates. The data is loaded into the MyGeotab platform, analyzed, and further processed to create the heat maps. The developed system uses the existing mobile network and can be used worldwide due to the embedded SIM card.
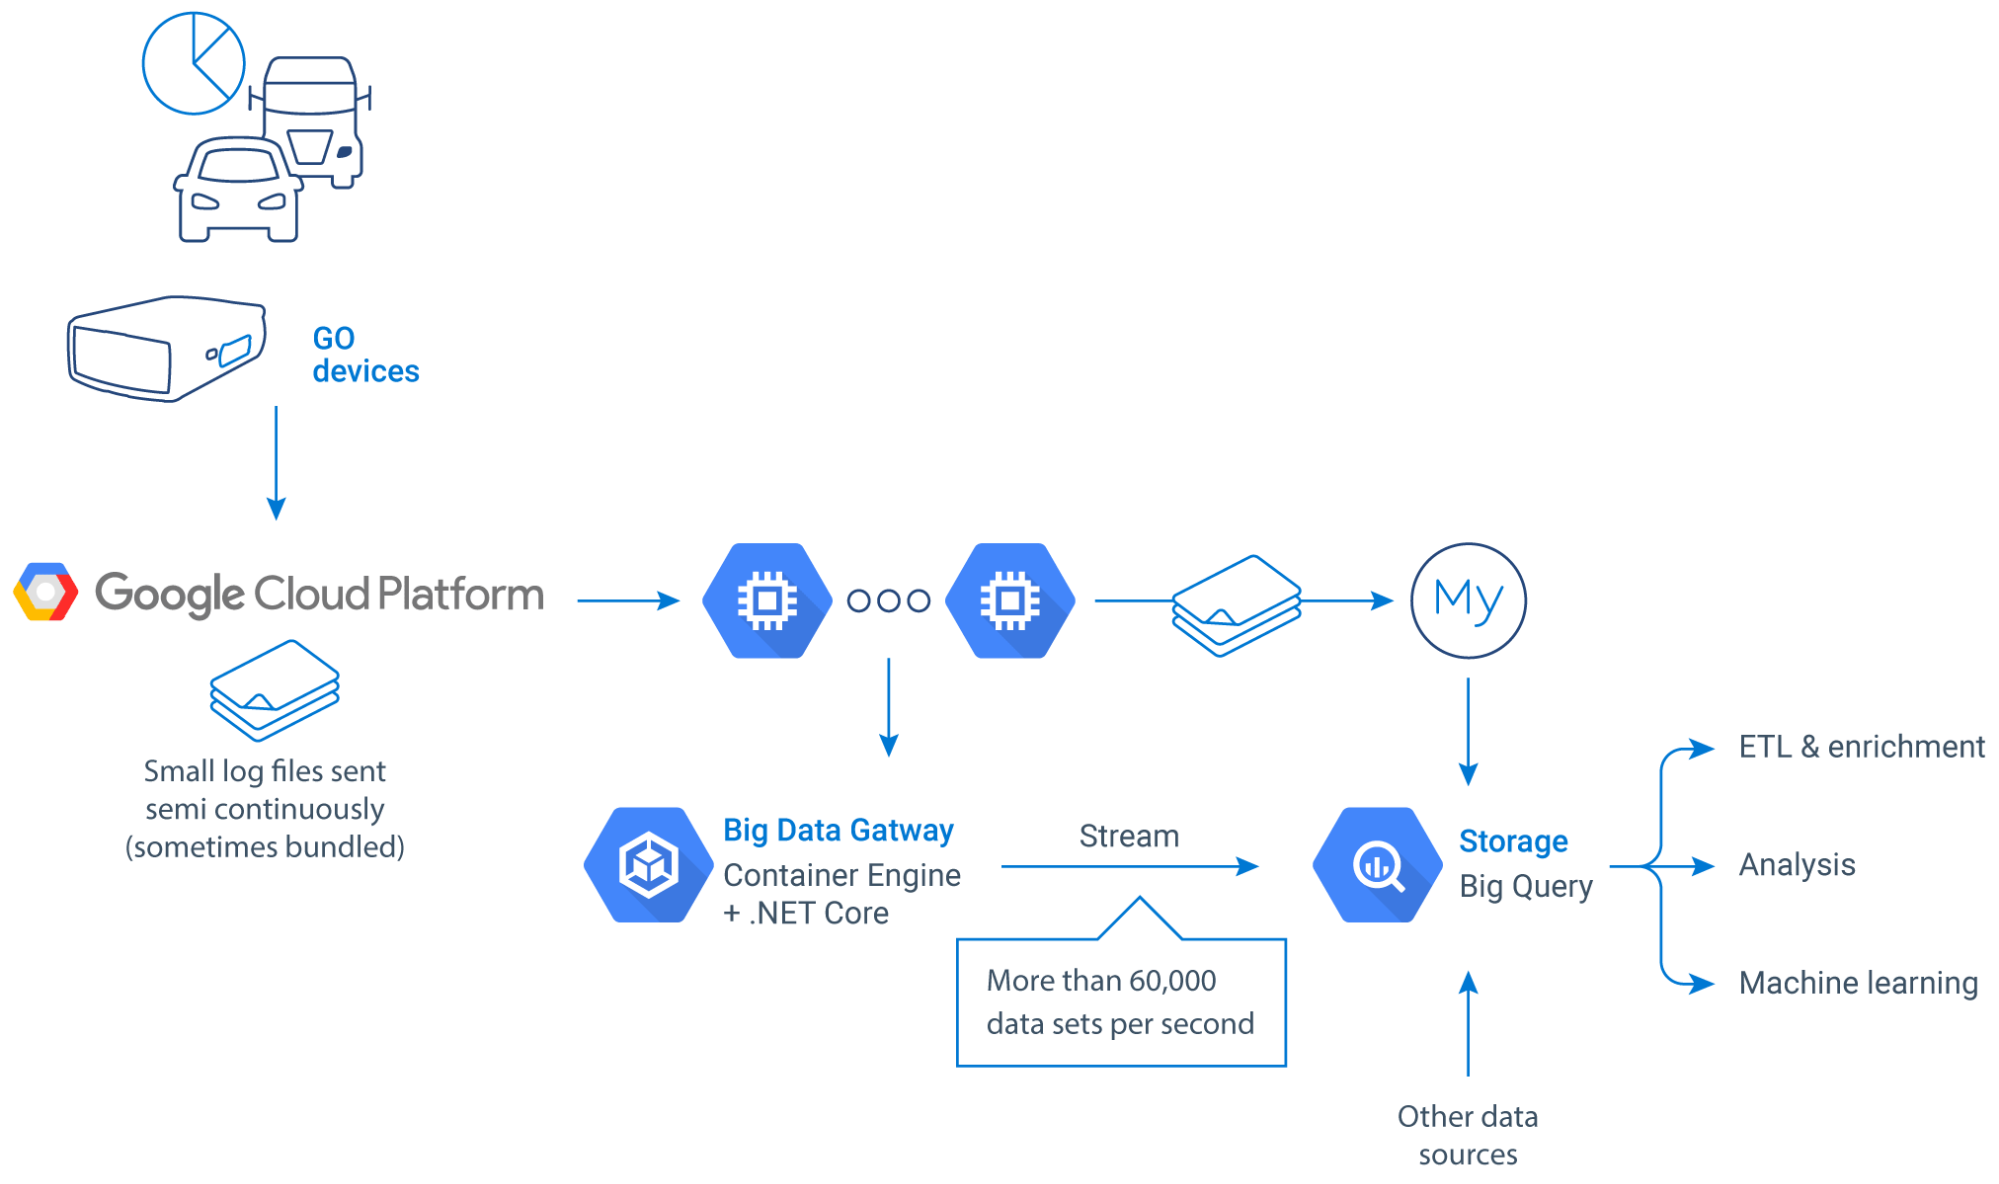
Figure 1: Simplified representation of the data flow for mobile data collection in the AirQuality project.
Understanding project challenges
When selecting the sensor technology suitable for the project, there was one major challenge: Finding low-cost air quality sensors for economic scalability that do not reduce data quality. Despite this, initial results show that this has not had a detrimental effect on the aim of the project: citywide transparency regarding air quality.
To verify the quality of the data, two of the PM 10 sensors selected for the AirQuality project were placed on one of the official measuring stations of the State Agency for Nature, Environment and Consumer Protection in North Rhine-Westphalia (LANUV) in Aachen. The pieces of data collected from the three sensors were plotted against each other (see Figure 2).
The evaluation clearly shows that although the values of the low-cost sensors do not match the values of the official LANUV measuring station exactly, the data trends are the same. The resulting correlation should be above 60% and it is planned to compensate for deviations using an automatic reference calibration.
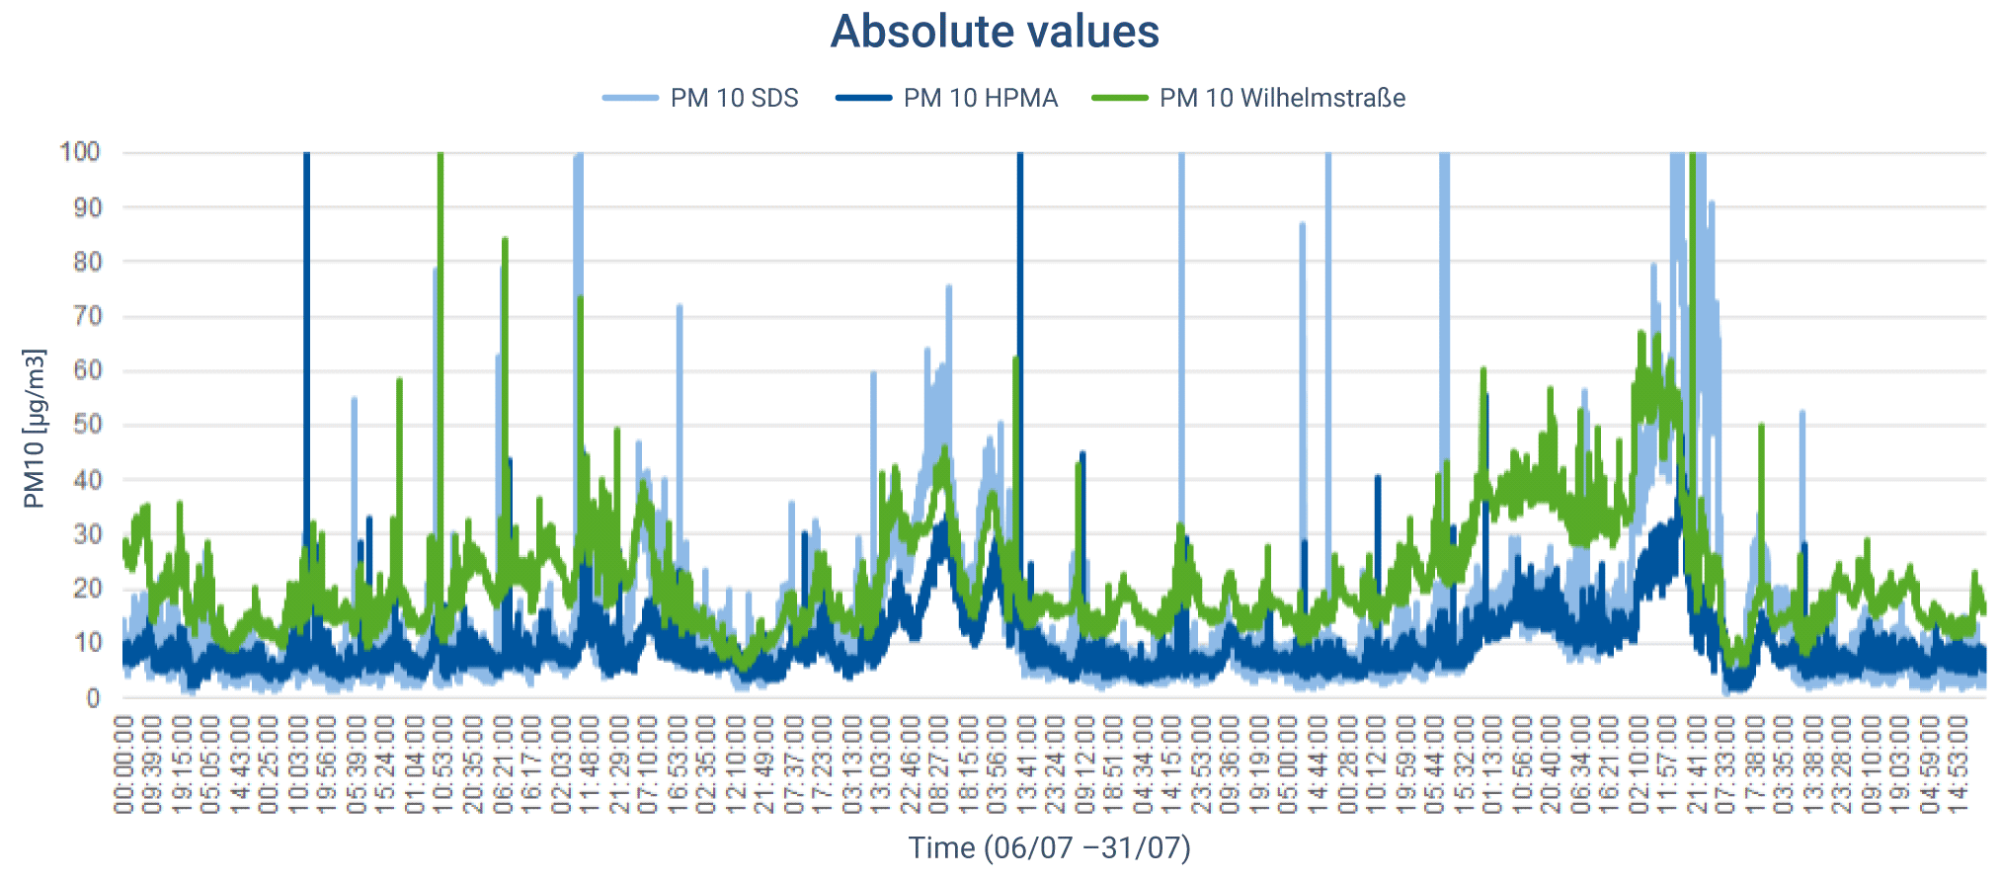
Figure 2: Qualitative and quantitative comparison between values of a professional measuring station of the LANUV (green) and two possible "low-cost" sensors for mobile purposes.
The developed sensor stack has a modular structure so that it can be extended or adapted later (a new NO2 sensor is currently being analyzed, since previous models could not achieve satisfactory results).
How vehicles were selected
The fleets of vehicles for the project must be selected in such a way that the urban area is covered as widely and regularly as possible. It is obvious that local public transport vehicles are the most suitable for highly granular measurement of air quality. In this respect, it depends on the individual city structure.
While in some cities the local public transport network consists of only buses, other cities also have trolleys. Initial tests show that in the case of the city of Aachen, as few as 13 buses are sufficient to cover 70% of the areas open to traffic within a single day.
At the same time, the disadvantages of using the local public transport system for mobile data collection were also evident.
On the one hand, vehicles are used on different routes, sometimes leaving the urban area. On the other hand, covering side streets and public spaces (e.g. marketplaces, pedestrian zones) proves to be problematic.
Consequently, suitable fleets must be carefully selected, and this selection is often already determined by the city structure and the local public transport network.
Breaking down the data
The mobile air quality data collected is visualized in a heat map, as shown in Figure 3. This heat map makes it possible to track the air quality of the entire urban area in relation to the day and time. In this way, hotspots can be identified and the effectiveness of measures to improve air quality can be objectively evaluated.
The information obtained from the maps can be used by city planners to implement pollution-reducing measures. Air pollutants in the immediate vicinity of schools, pre-schools, retirement and nursing homes and hospitals can be measured and analyzed. Residents can be notified of increased emissions from furnaces or resulting from large fires. In addition, real-time data opens up opportunities for new digital solutions. Traffic lights can respond to increased traffic volumes and the associated increased emissions to intelligently direct traffic.
For example, less traffic can be sent through areas with highly sensitive populations (hospitals, pre-schools, schools, retirement homes, etc.).
Real-time air quality data can provide the basis for route optimization to suggest low-pollution routes for pedestrians, athletes, high-risk groups, and environmentally conscious members of the public.
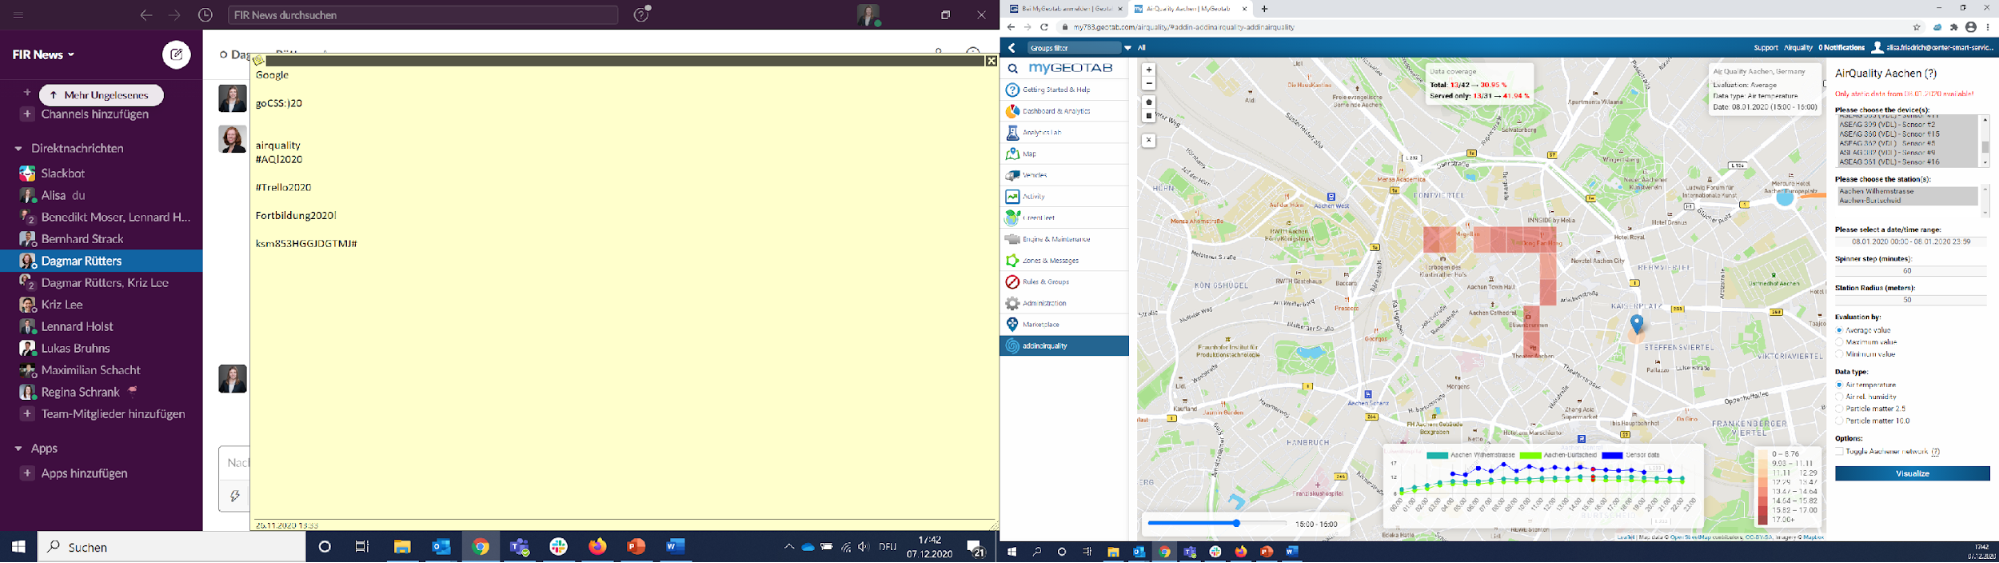
Figure 3: Visualization of the heat map using mobile air quality data collected in the city of Aachen.
Conclusion
Poor air quality affects us all. That is why we consider it important to successfully drive the AirQuality project forward and continuously develop it further. We are open to new ideas and innovations and look forward to exchanging ideas with various interested parties.
To learn more about Geotab’s connection to the AirQuality project, read the following blogs:
Subscribe to get industry tips and insights
The AirQuality Team monitors the quality of air in Aachen, Germany.
Table of Contents
Subscribe to get industry tips and insights
Related posts

Charged up: 6 data-driven strategies to maximize EV range in summer
June 19, 2026
2 minute read
The EV Confidence Gap: How to maximize your electric fleet and reduce costs
April 23, 2026
2 minute read
.jpg)
Neil Cawse: Sustainability’s pragmatic path — Delivering value today
March 25, 2026
1 minute read
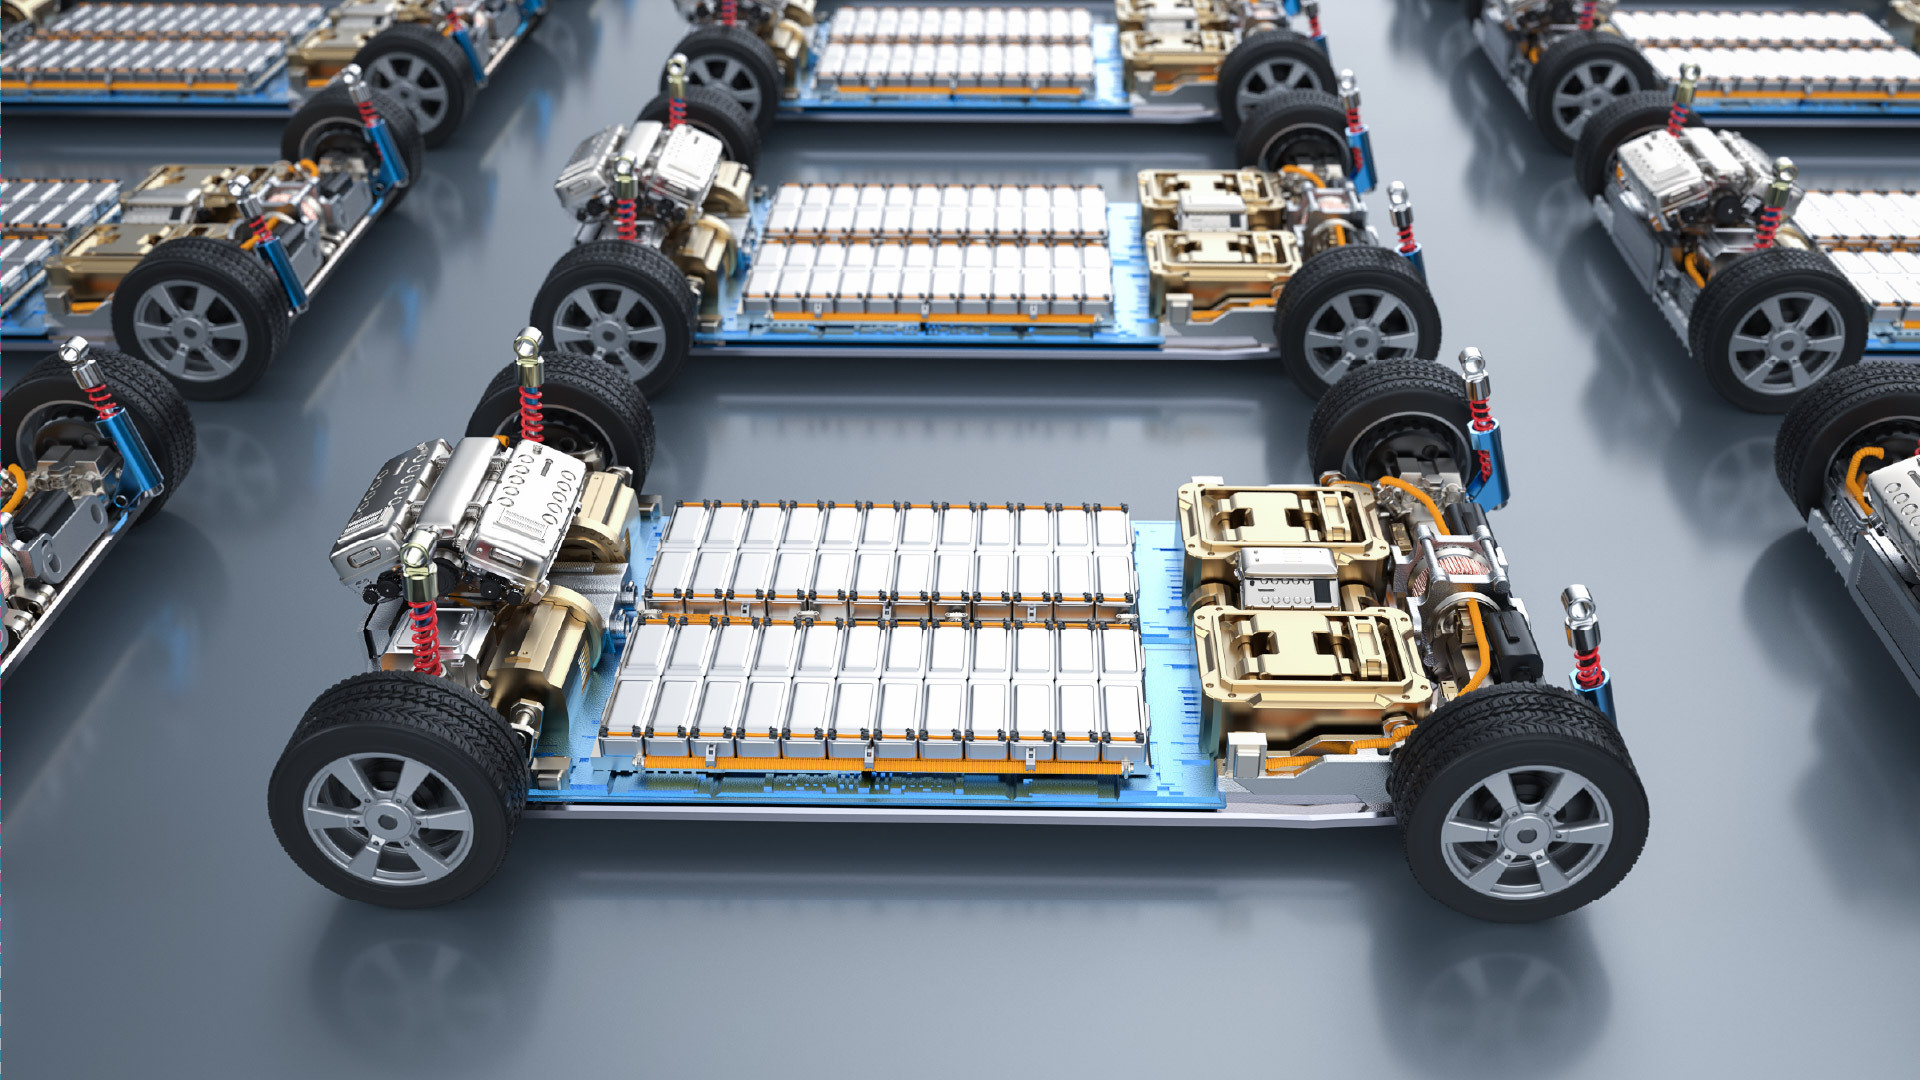
How long do electric car batteries last? The updated guide to real-world EV battery health
January 12, 2026
10 minute read
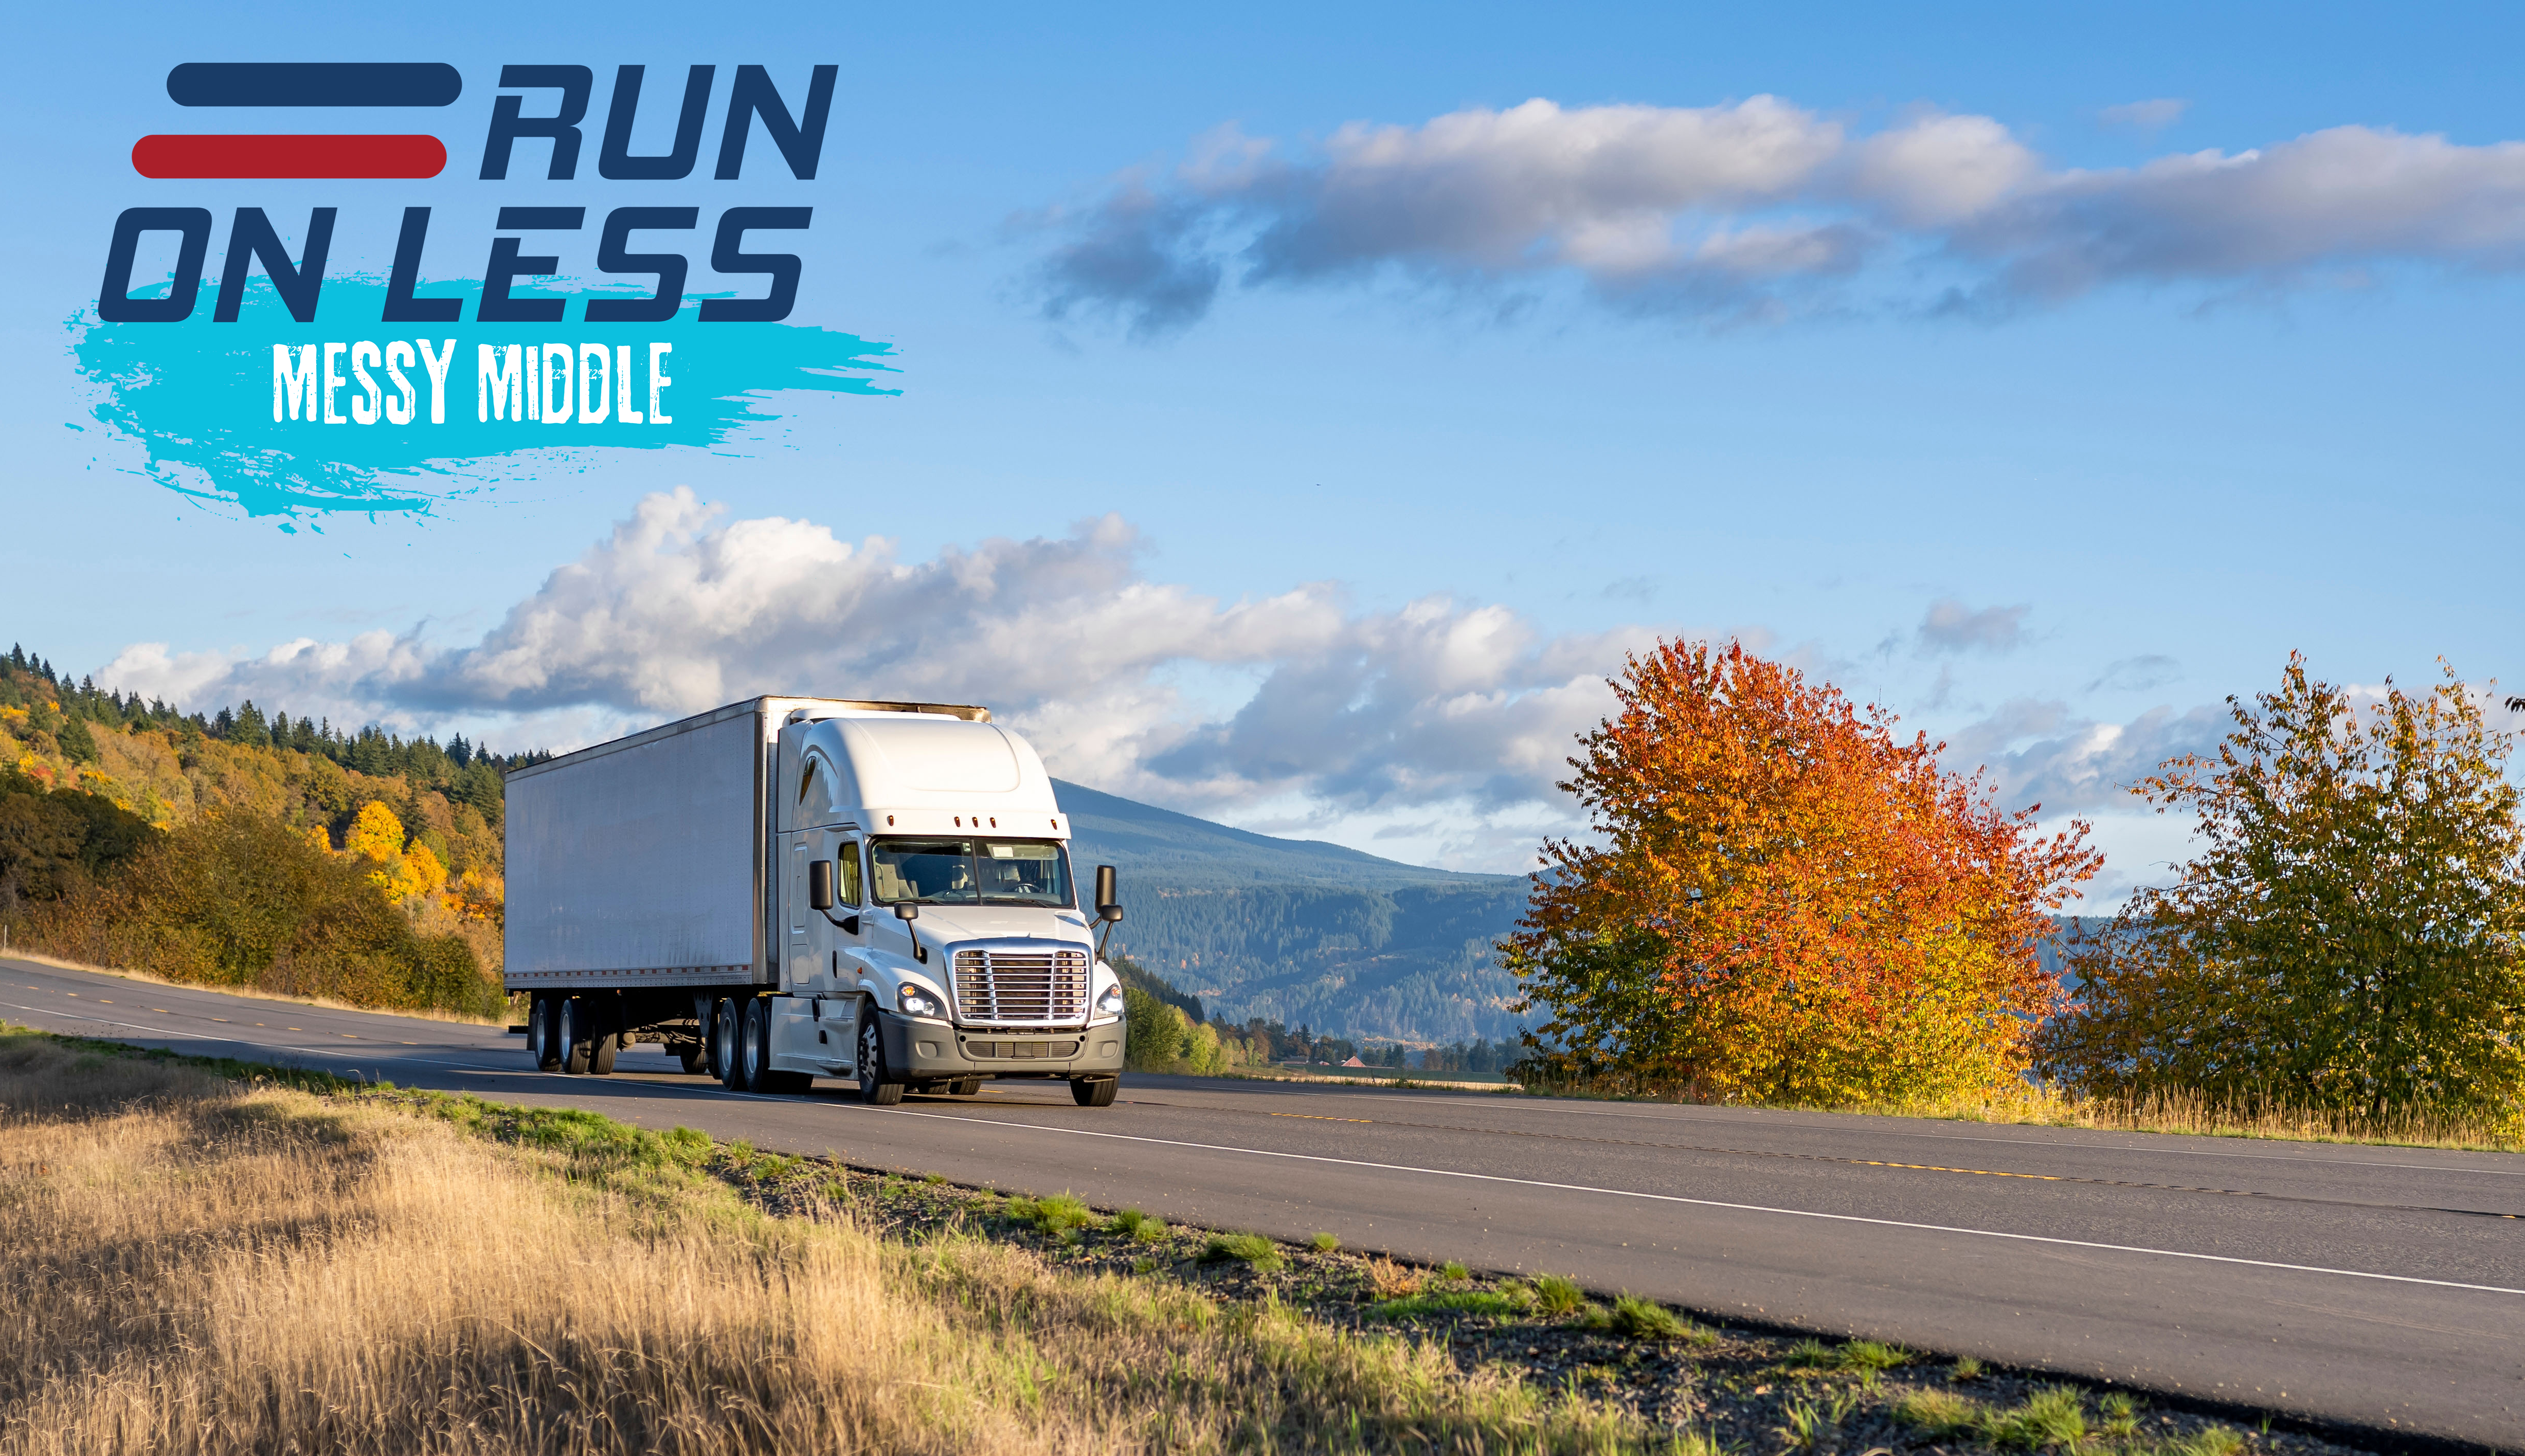
Run on Less data redefines electric truck viability
December 17, 2025
4 minute read