Excel tips for fleet management: Top formulas and functions
Even with new business tools available, Microsoft Excel remains a vital tool for daily operations. Accurately track and analyze your data with these Excel tips.

Mar 24, 2025
Whether you are handling a small, medium or large fleet, working with data along with your day-to-day operations can be daunting. This is where Excel can simplify your tasks. Here are just a few ways that you can use Excel if you are a part of the fleet industry:
- Track vehicles
- Track route data
- Use data to compare vehicle and driver performance
- Keep tabs on costs and fuel use
- Record preventive maintenance
- Monitor warranties
- Make a note of important dates
Why is Excel useful for managing fleet data?
For a lot of companies, spreadsheets are their go-to tool to organize and analyze fleet data. Excel can help you manage your fleet by providing a means of organizing data in a systematic way. With Excel spreadsheets, you can capture all the relevant data in one place, consolidating vehicle and driver information, cost analysis, budgets and more, for quick reviewing. Plus, the software’s formatting, charting and graphing capabilities make it easy to create insightful reports.
Common Excel terms and definitions
- Workbook: An Excel spreadsheet file is also known as a workbook.
- Worksheet: Also known as spreadsheets, worksheets are the documents with rows and columns that you find within the workbook.
- Cell: A cell is a rectangle or block within the worksheet where you can enter data.
- Columns and rows: Columns and rows are how the cells are aligned in a spreadsheet. Columns are aligned vertically while rows are aligned horizontally.
- Cell range: A cell range, also sometimes referred to as a dataset, is a collection of cells that have been identified as a group based on a variety of criteria.
- Operator: These are symbols or signs that indicate which calculation must be made in an expression.
- Formula: A sequence that can be used within a cell to produce a value.
- Formula bar: Located between the ribbon and workbook, the formula bar will display the contents in an active cell.
- Function: Functions are formulas that are pre-built into Excel. They are designed to help simplify potentially complex formulas in a worksheet.
Time-saving Excel tips and tricks
Once you understand the basic functions and formulas of Excel, inputting data to help you manage your fleet and create reports can be quick and stress-free. Let’s go over some time-saving Excel tips and tricks.
Keyboard shortcuts for Excel
| Ctrl + Down/Up Arrow | Moves to the top or bottom cell of the current column |
| Ctrl + Left/Right Arrow | Moves to the cell furthest left or right in the current row |
| Ctrl + Shift + Down/Up Arrow | Selects all the cells above or below the current cell |
| Shift + F11 | Creates a new blank worksheet within your workbook |
| F2 | Opens the cell for editing in the formula bar |
| Ctrl + Home | Navigates to cell A1 |
| Ctrl + End | Navigates to the last cell that contains data |
| Alt + = | Adds the value of the cells above the current cell |
| Ctrl + Shift + $ | Formats numbers within highlighted range into currency |
| Ctrl + Shift + % | Formats numbers within highlighted range into percentage |
| Ctrl + Shift + ; | Inserts current time |
| Ctrl + ; | Inserts current date |
The blind date conundrum: In Excel, dates are stored as numbers starting from “0” onwards. The “0” date was arbitrarily set as January 0, 1900. Every integer portion of a number added is a full day, while any decimal portion refers to the time.
Important symbols to know
The dollar sign ($): A simple but commonly forgotten tool in Excel is the dollar sign. When used within your formula, the dollar sign will make sure the row and/or column value will not change if you copy the formula.
=$A1 will keep A static.
=A$1 will keep 1 static.
=$A$1 will keep both A and 1 static.
The ampersand sign (&): The ampersand sign is the quickest way to concatenate strings (join two or more strings together into one) within Excel. It is the simpler alternative to the concatenate function.
=A1&A2
=”Hello “&A1
Functions and formulas: How do I manage data in Excel?
IF function
The IF function is one of the most fundamental and widely used building blocks for Excel. It is a logical formula that looks at a value in a sheet and provides one of two results, depending on whether or not the condition is met. For example, the function could produce a “YES” or “NO” result, or a “TRUE” or “FALSE.”
Formula for an IF statement:
=IF(“condition”, “action if true”, “action if false”)
=If(A1>1,”Yes”,”No”)
=If(A1>1,”Yes”,) — Using the quotation marks with nothing between them (“”) will make the cell have an EMPTY value, while you could also use quotation marks with a blank space between them (“ “) to leave the cell empty.

AND, OR, NOT, ISERROR functions
AND, OR, and NOT are a set of functions that are often used when more complex rules are required. For example, they are often used in the condition section of an IF statement.
- AND: Returns “TRUE” if all conditions within it are met.
- OR: Returns “TRUE” if at least one condition is met.
- NOT: Returns “TRUE” if the logical statement within it is false.
- ISERROR: Used as a fail-safe when the logical rules could return an error message. If an error is seen, then the formula will return “TRUE.”
And, Or, Not, IsError can all be used with IF statements:
- =IF(AND( X=1,Y=2), “Yes”, ”No”) — This code would check two separate cells to confirm they are the values you assigned. OR can replace AND here and it would check both cells and state Yes if only one of them is actually true.
LEFT, RIGHT, LEN
LEFT, RIGHT and LEN are three basic string manipulation formulas. If you have worked with MyGeotab fleet management reports, you have used or seen them used when working with the manipulation of groups.
- LEFT: Returns the X leftmost character from a string.
- RIGHT: Returns the X rightmost character from a string.
- LEN: Returns the length of a string.
Formula for LEFT, RIGHT, LEN:
=LEFT(“STRING”,X) =RIGHT(“STRING”,X) =LEN(“STRING”)
For example, if we used the formula =RIGHT(“Geotab”,3) the result would be “tab”.
Mathematical functions used in Excel math functions
In this section, learn about some of the basic mathematical functions available in Excel and how they apply directly to the MyGeotab environment.
Min, max and everything in between
These functions are the most common statistical functions in Excel. They are used to find outliers, averages and other values.
MAX: Returns the largest value in a dataset (cell range).
=MAX($A$1:$A$10)
MIN: Returns the smallest value in a dataset.
=MIN($A$1:$A$10)
MEDIAN: Returns the value that is right in the middle of the dataset. For example, from a list of numbers, like 1,5,8, the MEDIAN function would return the value 5.
=MEDIAN ($A$1:$A$10)
MODE: Returns the most common value within a dataset.
= MODE ($A$1:$A$10)
Almost max and almost min
Sometimes you don’t want the MAX or the MIN. Thankfully, there’s a formula for that. LARGE(RANGE, K) and SMALL(RANGE, K) will give you the Kth largest or smallest value within a dataset.
How to apply formulas in MyGeotab
To quickly see the most common firmware version, Geotab GO device type, or vehicle make:
Use the =MODE.SNGL() formula within the Watchdog Report.
To find the most efficient driver in your fleet:
Use the MIN formula within the Fuel Usage report to find the vehicle with the lowest fuel consumed. The inverse also holds true.
To find the least efficient driver:
Simply use the MAX formula.
What are the basic formulas in Excel?
Did you know you can use Excel as your calculator? You can add, subtract, multiply, and divide using the following formulas.
SUM
This addition formula within Excel allows you to add all the values within a range.
SUM= ($A$1:$A$10)
AVERAGE
Formula that returns the arithmetic mean of all the values within a range. If you want it to include text and conditionals within the mean, then you can use AVERAGEA().
AVERAGE = ($A$1:$A$10)
COUNT
As the name states, this formula will return the total number of cells that contain a number. If you would simply like to return the count of cells that contain any kind of text, then you would use COUNTA().
COUNT = ($A$1:$A$10)
MOD and INT functions
MOD will return the remainder after dividing the first number by the second. As an example, =MOD(10,3) would return 1.
MOD = (DIVIDEND, DIVISOR)
INT will return the integer portion of a number, as an example =INT(10.3) would return 10. This function is a great way to split numbers.
INT = (NUMBER)
How to use SUM, AVERAGE and COUNT in MyGeotab
You can use SUM, AVERAGE and COUNT to get a quick overview of values in a MyGeotab custom report without delving into PivotTables. Here are just a few scenarios when this may be useful:
- You want to know the total distance traveled from your Trip Report.
- You want to calculate the average number of infractions or exceptions recorded in your Risk Management Report.
- You want to show the total count of devices in your Vehicle Report.
When to use MOD and INT in MyGeotab
MOD and INT should be used when looking at dates, since Excel uses decimal numbers to store dates and times. Excel is programmed to make it easier to enter dates.
What does that have to do with MOD and INT? By using =INT(DATETIME), you can easily retrieve only the date from a DateTime value. This means that when you want to compare dates, you won’t run into issues of inconsistently formatted data since the time values are not pulled.
And by using =MOD(DATETIME,1), you are able to extract only the time portion of the DateTime. These two formulas prove to be very useful in several MyGeotab Reports.
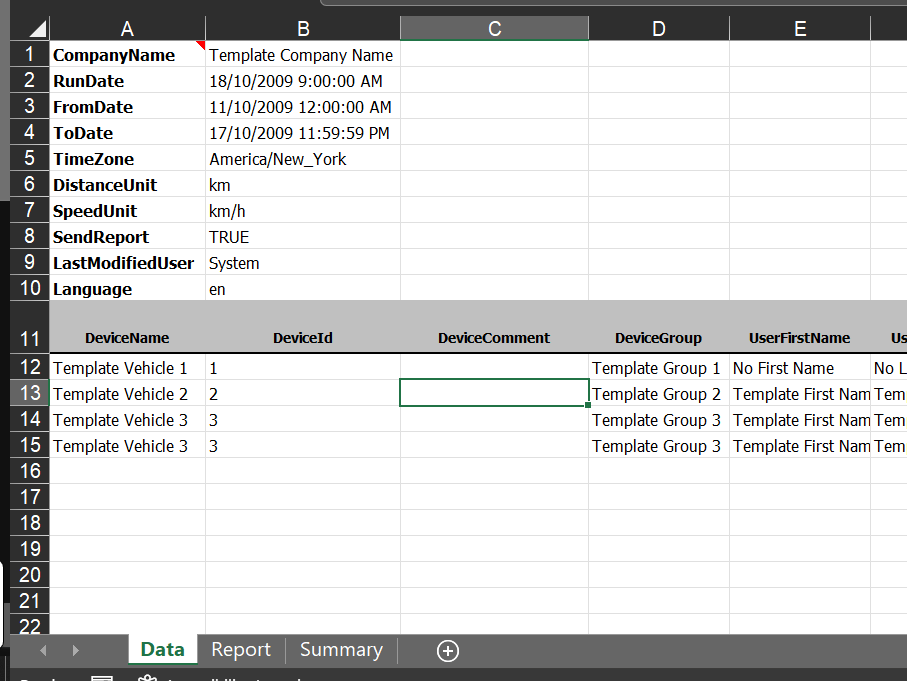
Where is data stored on MyGeotab Reports?
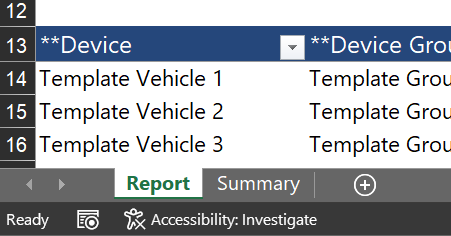
On all default MyGeotab Reports, there are three tabs in the Excel workbook — Report, Summary and a special hidden tab called Data. The Data tab is where Geotab servers fill in all the relevant data into the report, and then the Report and Summary tabs pull that data from those sheets to show you the relevant information.
Here is an example of a Detailed Trips Report and its two default tabs:
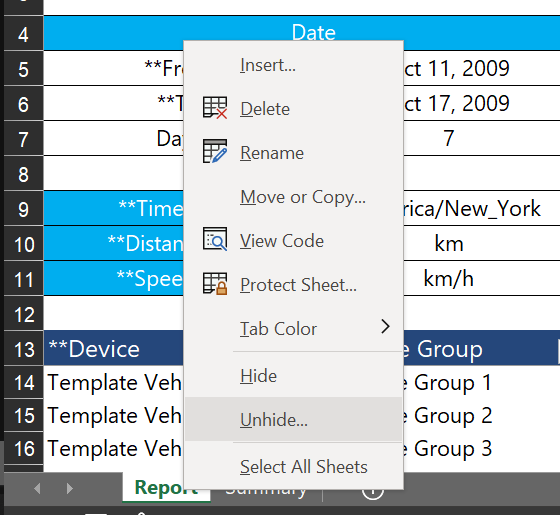
How to unhide the Data tab
1. Right-click any of the tabs below, and then click Unhide.
2. Once you click on Data, then click OK.
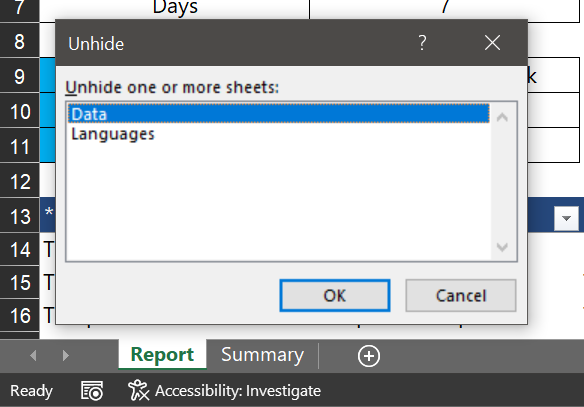
3. The Data tab will automatically appear in your Excel workbook:
How to pull data from the Data tab into the Report tab
If you are not seeing the data you need in your Report tab, you can correct this after unhiding the Data tab by following these steps:
- Go to the Report tab.
- Click on any cell under the first header row. You will see a code “=Data!....”
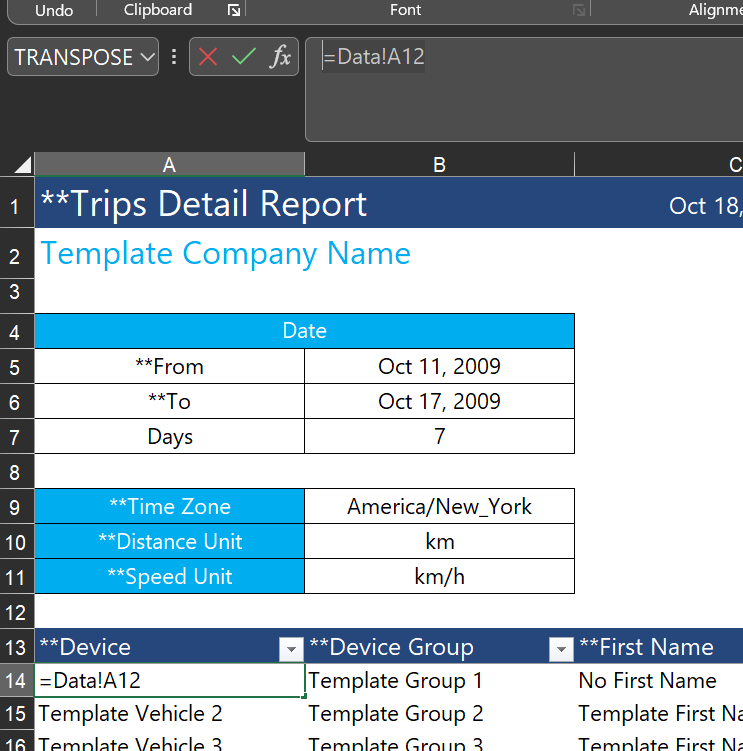
3. Enter the column and row values from where the data should be pulled.
The Code =Data! (in this case =Data!A12), tells Excel to look at the cell on the datasheet for the source of the data you need. Let’s say you want to bring data from the Report tab backward to the Data tab. The code would instead be =Report!A12, with the A12 being whatever cell you are referencing from the Report tab. This way, you can tell Excel to pull from any tab to the one you are on and reference it for calculations.
What are the formulas for conditional formatting in Excel?
Formulas can help you evaluate performance. Analyzing your fleet data analytics could help you answer questions such as:
- What is the total mileage driven by the fleet outside of work hours?
- How many times has a driver surpassed 80 miles per hour (mph)?
- What is the total driving duration during work hours for only a subset of your fleet?
Excel has all of that and more covered with conditional mathematical formulas.

SUMIF: The conditional value dilemma
The SUMIF is a formula that blends the IF statement mentioned earlier with the SUM function. It calculates the sum of a range, but only if certain criteria are met. For example, let’s assume you want to calculate the total miles driven for trips that were longer than 50 miles.
To do this, follow these steps:
- Select the range that has the distances.
- Add the minimum speed condition as the second argument. See the example below:
=SUMIF (E9:E11, “>” &50)
Whatif the criteria range and the sum range are not the same? Are you looking to calculate the total mileage driven by your fleet outside of work hours?
Excel allows you to add a third argument to the formula that would be used as the SUM range.
In the formula below, the range L9:L11 refers to the cells that specify whether or not the trip started during work hours while the E9:E11 range refers to the trip distances, much like the previous example.
= SUMIF (L:9:L11, FALSE, E9:E11)
The formula above basically says, “If it’s true that the trip was driven outside of work hours, then calculate the sum of miles.” The range L9:L11 refers to the cells that specify whether or not the trip started during work hours. The E9:E11 range refers to the trip distances, much like the previous example.
COUNTIF: The Selective Picking Formulation
The COUNTIF formula lets you count specific cells depending on established criteria. This is different from SUM. A COUNTIF allows you to gather the total number of incidents, whereas a SUM totals numbers.
For example, let’s say you wanted to know the number of times a driver went over 86.9 miles per hour. You could set up a formula like the following one, where F9:F11 refers to the speed for each row. The result would be the number of times the incident occurred.
=COUNTIF(F9:F11,”>”&140)
SUMIFS and COUNTIFS: The Multiple Criteria Paradigm
So far, the formulas discussed work when there is only one criterion to meet. What happens when you need to set multiple requirements? This is when SUMIFS and COUNTIFS come into play. These formulas are an extension of the basic SUMIFS and COUNTIFS. They allow for the specification of multiple criteria and only the rows that meet all the desired criteria will be taken into account.
The syntax for SUMIFS is:
=SUMIFS(sum_range, criteria_range1, criteria1, [criteria_range2,criteria2],...)
While the syntax for COUNTIFS is:
=COUNTIFS(criteria_range1, criteria1, [criteria_range2, criteria2], …)
In the above syntax examples, the fields with square brackets are optional. It is also important to note that you must at the very least have one criterion set but you can have any number of criteria.
To illustrate, let’s assume that we want to get the total driving duration for the vehicles that are part of the Trucks group in MyGeotab.
In the formula below, H9:H11 refers to the cells that contain each trip duration. This is what will be tallied when all the criteria are met. The cells C9:C11 refer to the vehicle’s groups, specifically for Trucks, and finally, the cells L9:L11 refer to the work hours.
=SUMIFS(H:9H11,C9:C11, “Trucks”, L9:L11, TRUE)
There are many other ways you can manipulate strings. Here are some good resources to help immerse yourself in all things Excel:
How to improve your fleet management spreadsheet
In fleet management especially, custom fleet management reporting is key to unlocking more value from your data. Getting to know your data better can help you achieve your fleet safety, fleet compliance, or productivity goals.
This post barely scratches the surface. Excel has so much more to offer with a plethora of functions that it has to offer. Especially when you have the ability to create your own custom formulas, Excel becomes a powerful management tool.
With Geotab's fleet productivity solutions, you can track your assets, improve fleet management, lower costs and understand your fleet data with drivers.
Visit the Geotab Community to ask questions and learn new tips and tricks.
For more tutorials on reporting, watch our video series on YouTube:
Subscribe to get industry tips and insights
Mauricio Muniz is an Associate Vice President, Engineering Support for Geotab.
Table of Contents
- Why is Excel useful for managing fleet data?
- Common Excel terms and definitions
- Time-saving Excel tips and tricks
- Functions and formulas: How do I manage data in Excel?
- Mathematical functions used in Excel math functions
- How to apply formulas in MyGeotab
- What are the basic formulas in Excel?
- How to use SUM, AVERAGE and COUNT in MyGeotab
- Where is data stored on MyGeotab Reports?
- What are the formulas for conditional formatting in Excel?
- How to improve your fleet management spreadsheet
Subscribe to get industry tips and insights
Related posts


The safest mile in field service is the one nobody drives
July 22, 2026
2 minute read

Best small fleet management software providers and how to choose one for your business
July 16, 2026
8 minute read


Why field service routing decisions are costing you more than fuel (and how to fix it)
May 14, 2026
4 minute read