Every fleet idles. Not all of it is waste.
Geotab analysis of 2.6 million commercial vehicles across the U.S. and Canada reveals $100+ million cost savings opportunity in fleet idling reduction.

Senior Manager, Sustainable Mobility at Geotab
Jul 28, 2026

Key Insights
- The average fleet vehicle idles 1 hour 25 minutes per day and burns 0.95 gallons (3.60 liters) of fuel.
- The worst 10% idle more than three hours per day and consume over 2 gallons (7.7 liters).
- Closing that gap represents a savings potential of 24.2 million gallons (91 million liters) – worth $105 million USD, or roughly $400 per vehicle each year.
- Light-duty vehicles spend 11% of their fuel budget on idling — nearly double the heavy-duty rate. In absolute terms it flips: HD trucks burn over three times more idle fuel per day.
- Not all idling is waste. The real question is knowing which of it can actually be reduced.
When fuel costs spike, fleet managers look hard at every line on the budget. Idling sits near the top of that list. It seems straightforward: engine running, wheels not moving equals money wasted. But not all idling deserves the same response.
How much do commercial vehicles idle?
At Geotab, we analyzed idling behavior across the Geotab-connected network of more than 2.6 million commercial vehicles in the United States and Canada over a 12-month period (June 2025 - May 2026). Three questions drove the analysis:
- How much idling is actually happening?
- How does idling vary across operations and vehicle types?
- Where should fleet managers focus to make the biggest impact on idling and related fuel costs?
To account for vehicles that aren't on the road every day, we measured all figures per driving day — any day on which a vehicle logged active mileage and fuel use.
Key findings from the idling study
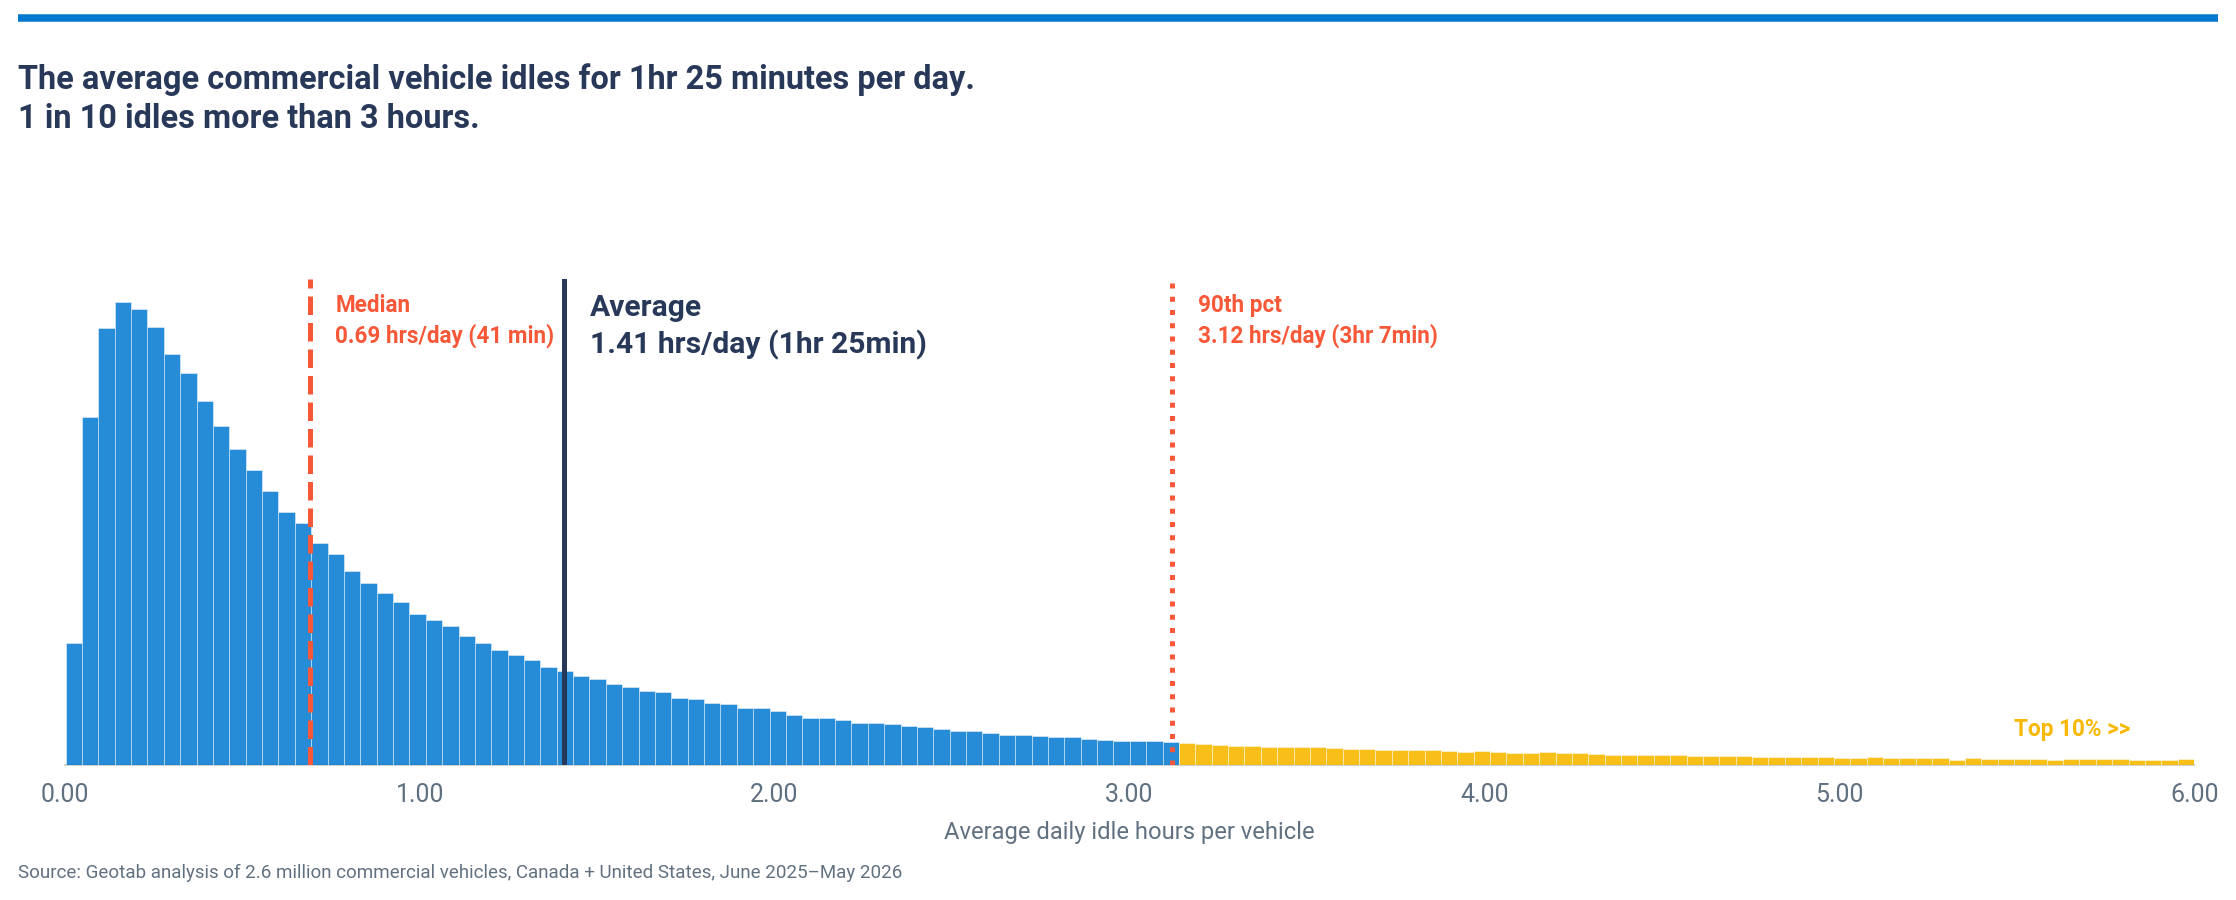
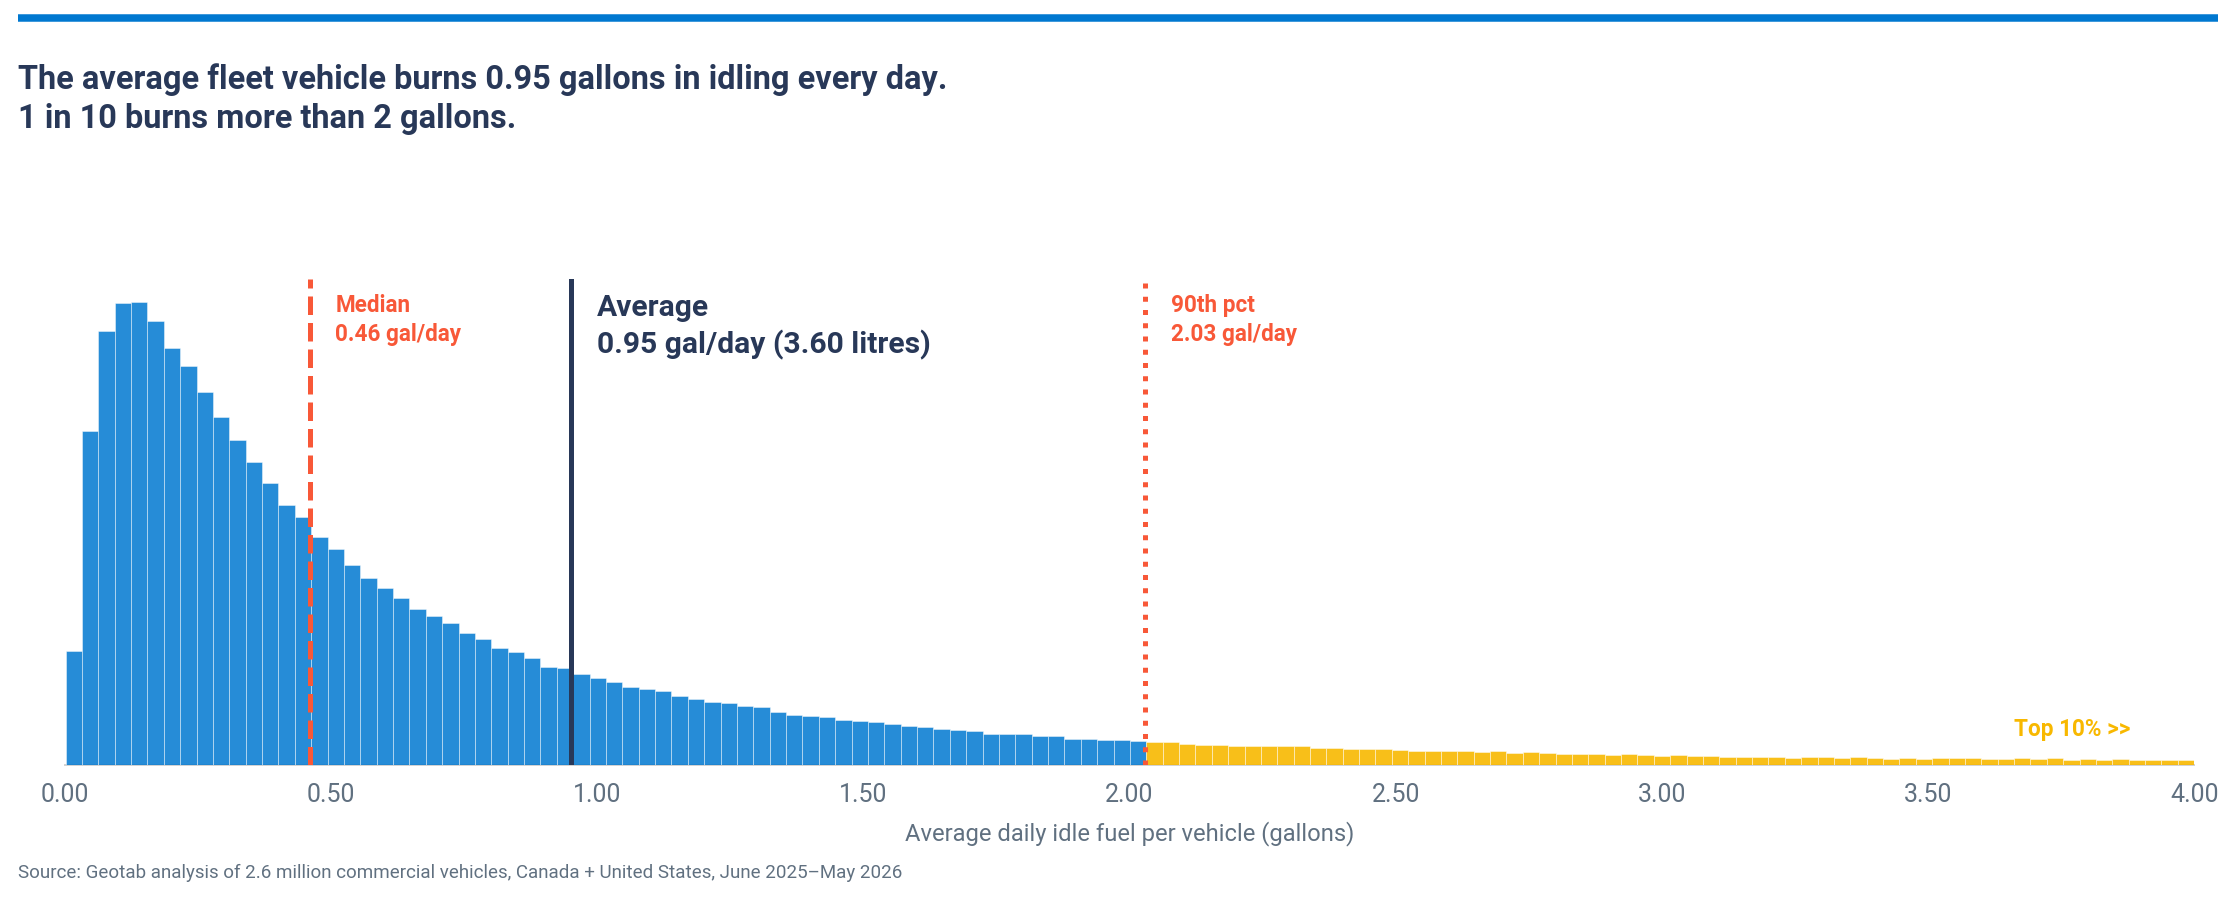
The average commercial vehicle across all classes (from cars to heavy-duty trucks) in our dataset idles for about 1 hour and 25 minutes per driving day and burns 0.95 gallons (3.60 liters) doing it. Half of all vehicles idle 41 minutes or less, but the average is more than double that, pulled up by a long tail of heavy idlers.
The worst 10% idle for more than three hours per driving day and consume over 2 gallons (7.7 liters) of fuel.
Average daily idle time per vehicle (hours)
Average daily idle fuel used per vehicle (gallons)
Heavy-duty vehicles burn three times the fuel in idling than light-duty
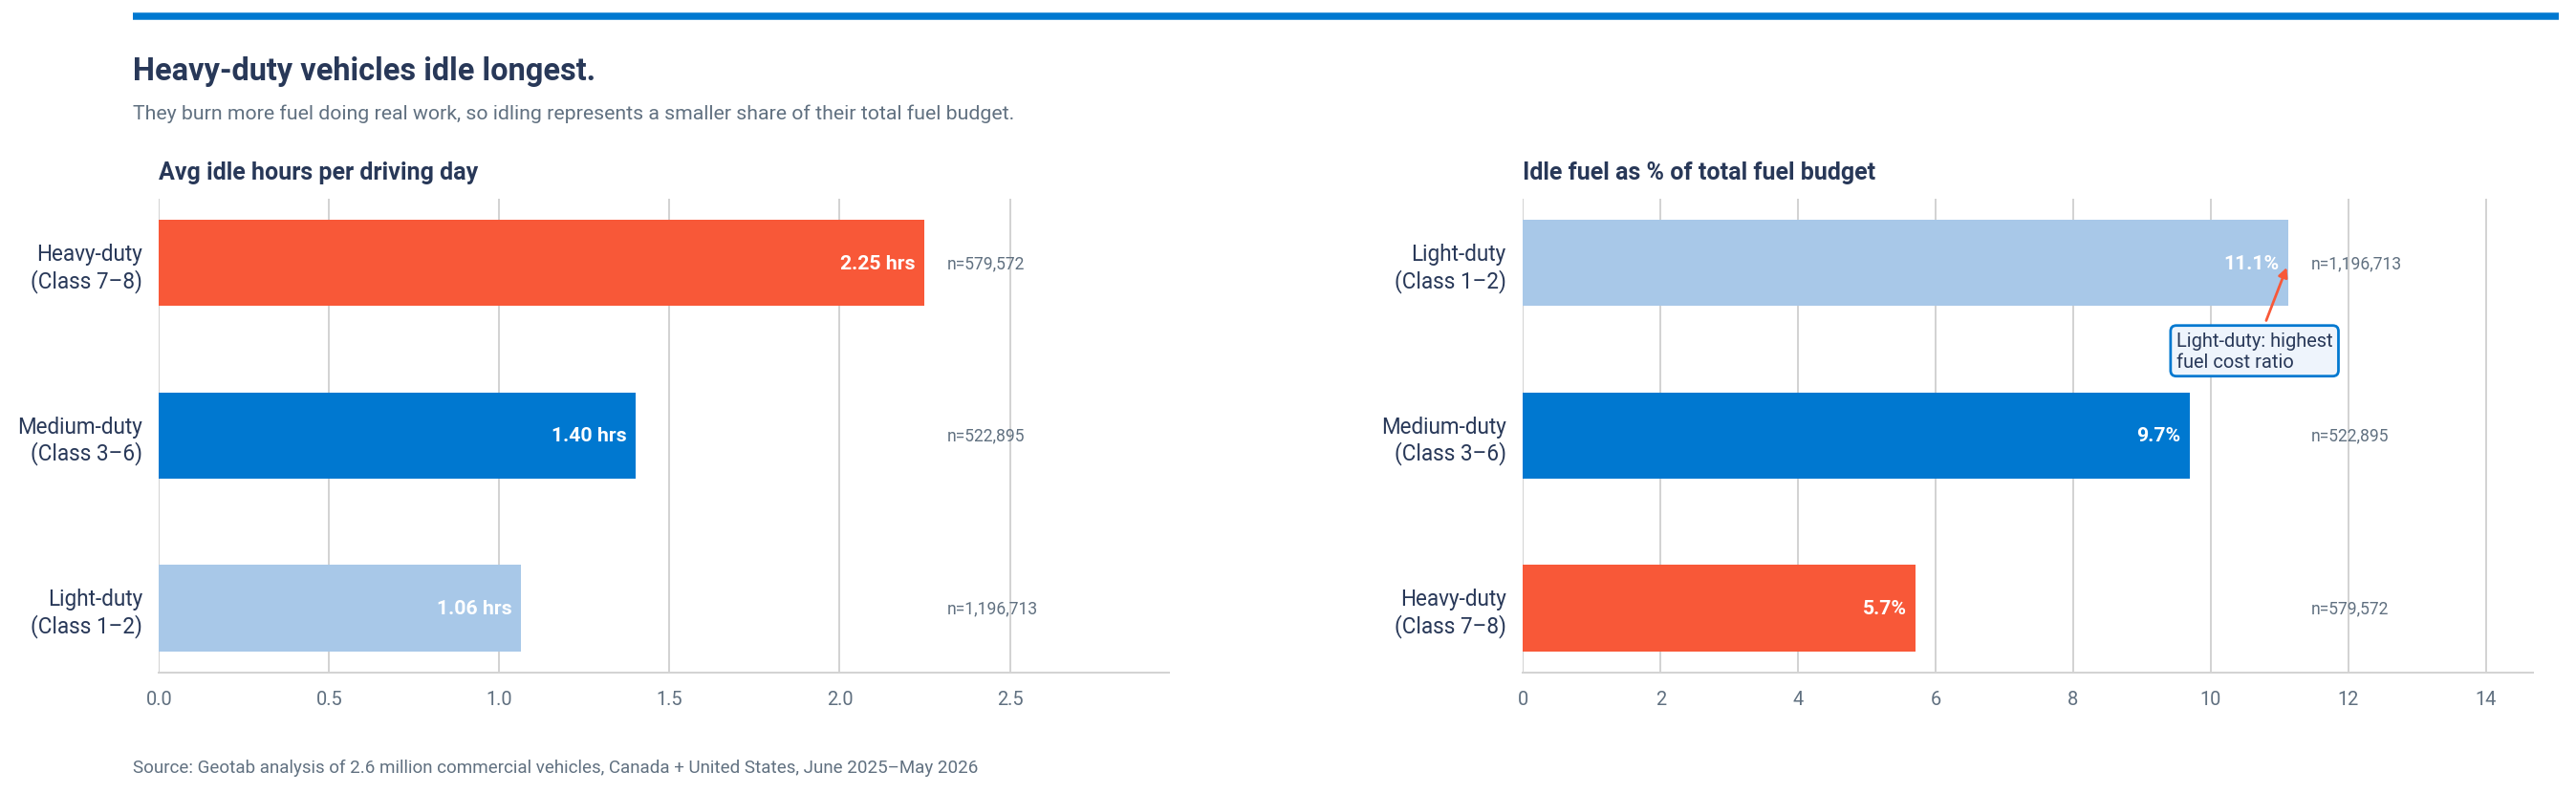
In absolute terms, heavy-duty (HD) trucks (Class 7-8) idle longest, with an average of 2.25 idle hours per driving day compared to just over one hour for light-duty vehicles (Class 1-2). The fuel gap is even wider: the typical HD truck burns 1.80 gallons (6.80 liters) of idle fuel per day, more than three times a light-duty vehicle’s 0.55 gallons (2.09 liters).
A larger share of light-duty fuel costs goes toward idling
But when you look at idling fuel as a share of total fuel consumed, the picture shifts. Light-duty vehicles spend 11.1% of their fuel budget on idling; HD trucks spend 5.7%. The reason: HD trucks burn a large amount of fuel doing actual work with load-bearing, highway miles and high-demand duty cycles. Idling is a smaller slice of a much bigger pie. For light-duty vehicles it’s the inverse: less total fuel overall, so idling registers as a proportionally large share of the budget.
Average idling by vehicle class
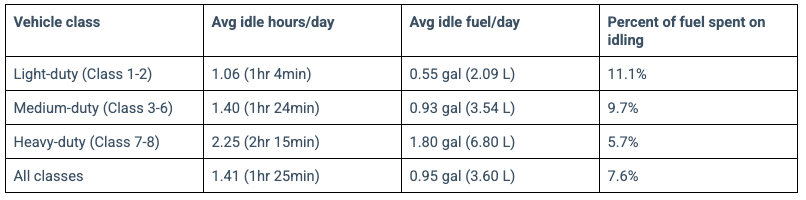
Average idle hours per driving day and idle fuel share, by vehicle class
Door-to-door spends the highest percent of fuel on idling
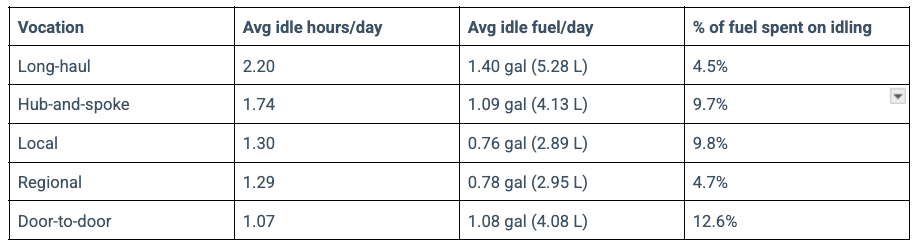
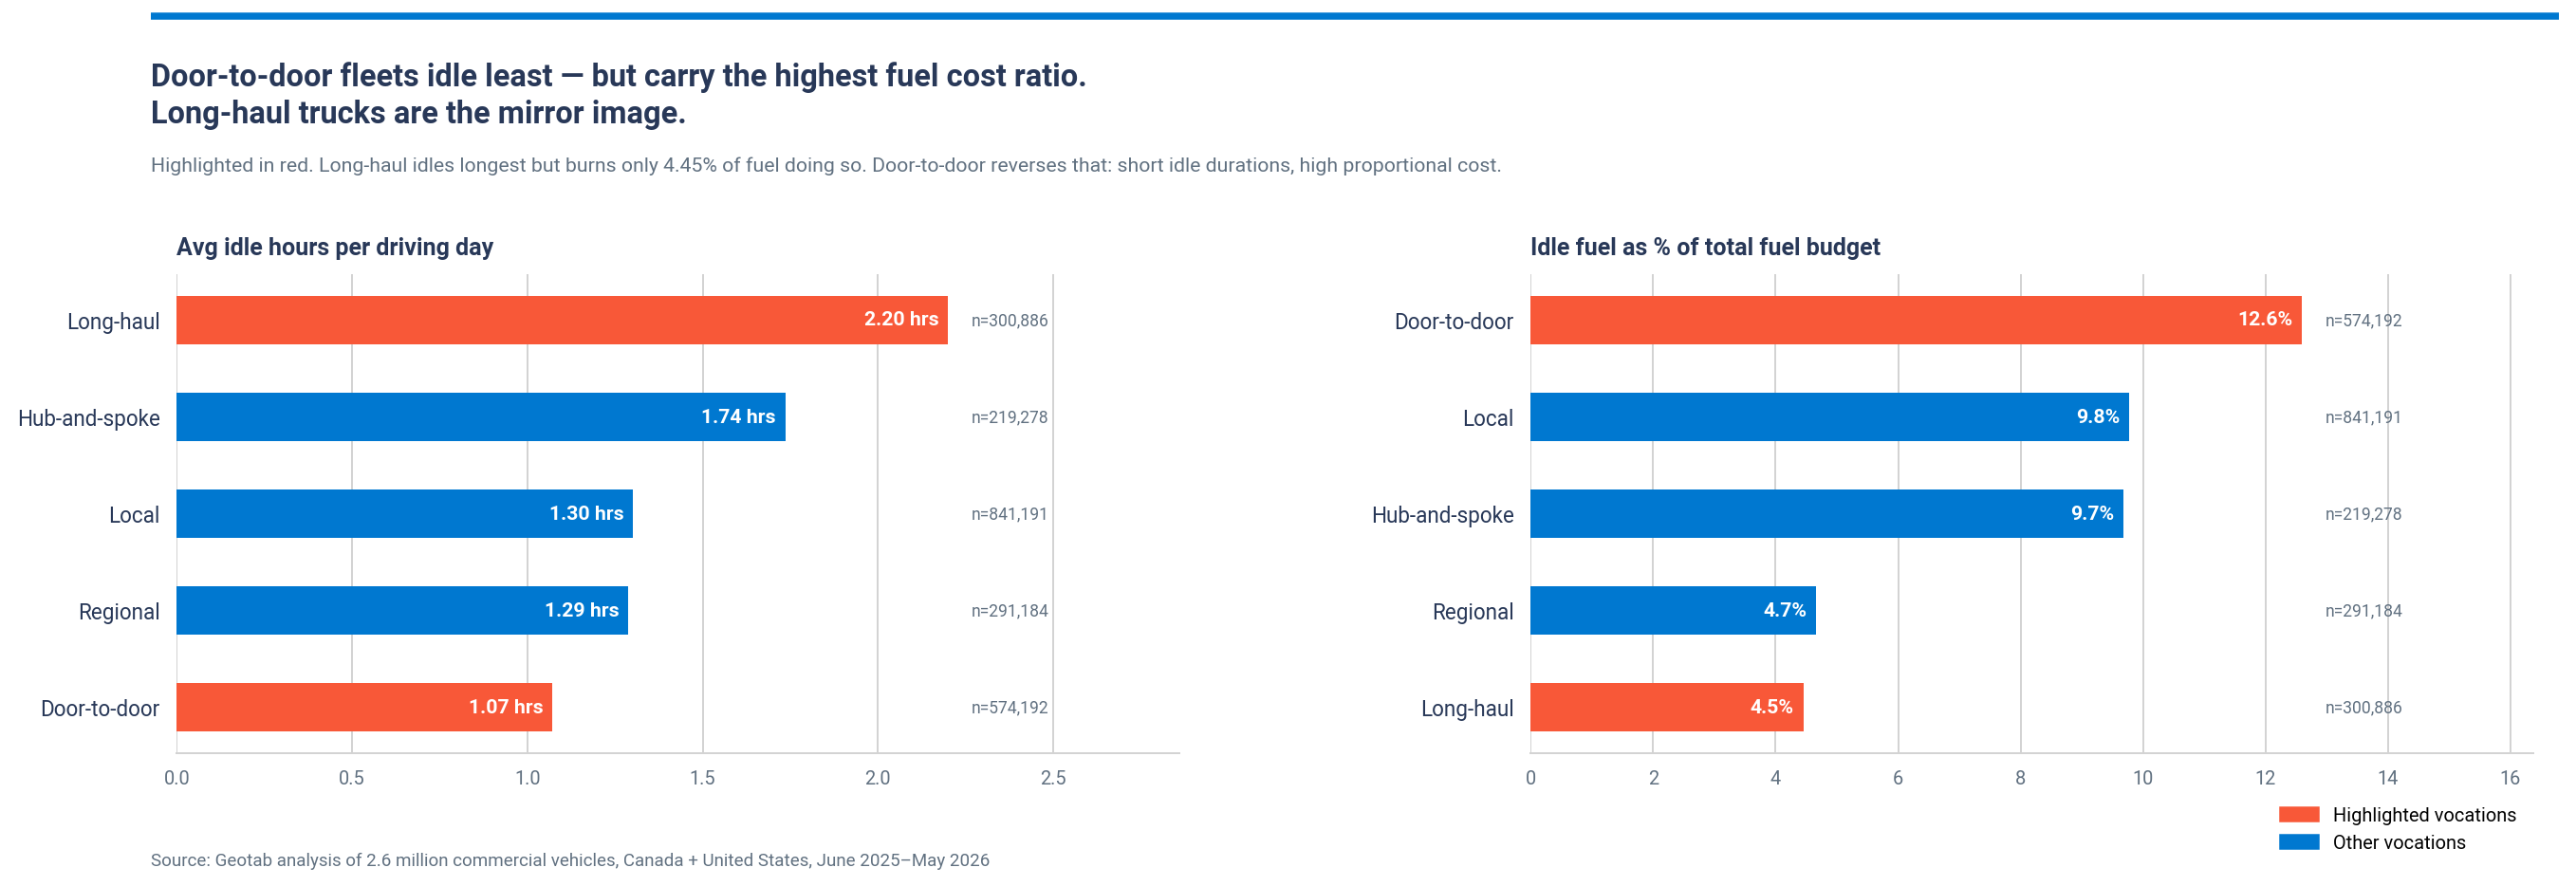
The same finding holds when you look at vocation (the vehicle’s driving pattern). How much a vehicle idles, and what that costs as a share of its fuel budget depends on the vehicle type, and how it's used. Long-haul trucks average 2.20 idle hours per day but only 4.45% of their fuel goes to idling; door-to-door is the inverse: 1.07 hours of idling, but 12.6% idle fuel share.
Taken together, idle hours, fuel consumed while idling, and idle fuel as a share of total fuel paint a fuller picture than one number alone. Even so, those numbers only mean something against the right benchmark. What looks like a lot of idling for one type of operation may be entirely normal for another, depending on the type of work the fleet does.
Average idling by vehicle vocation
Average idling by vehicle vocation
Operational idling vs. discretionary idling: how to tell the difference
A number that looks alarming on a fleet report may reflect exactly how that operation is supposed to run. Or it may not. Context is everything.
Telematics can tell you how much idling is occurring and where. What it might not tell you automatically is whether that idling matters. Start by asking: what is the engine actually doing when the vehicle isn't moving?
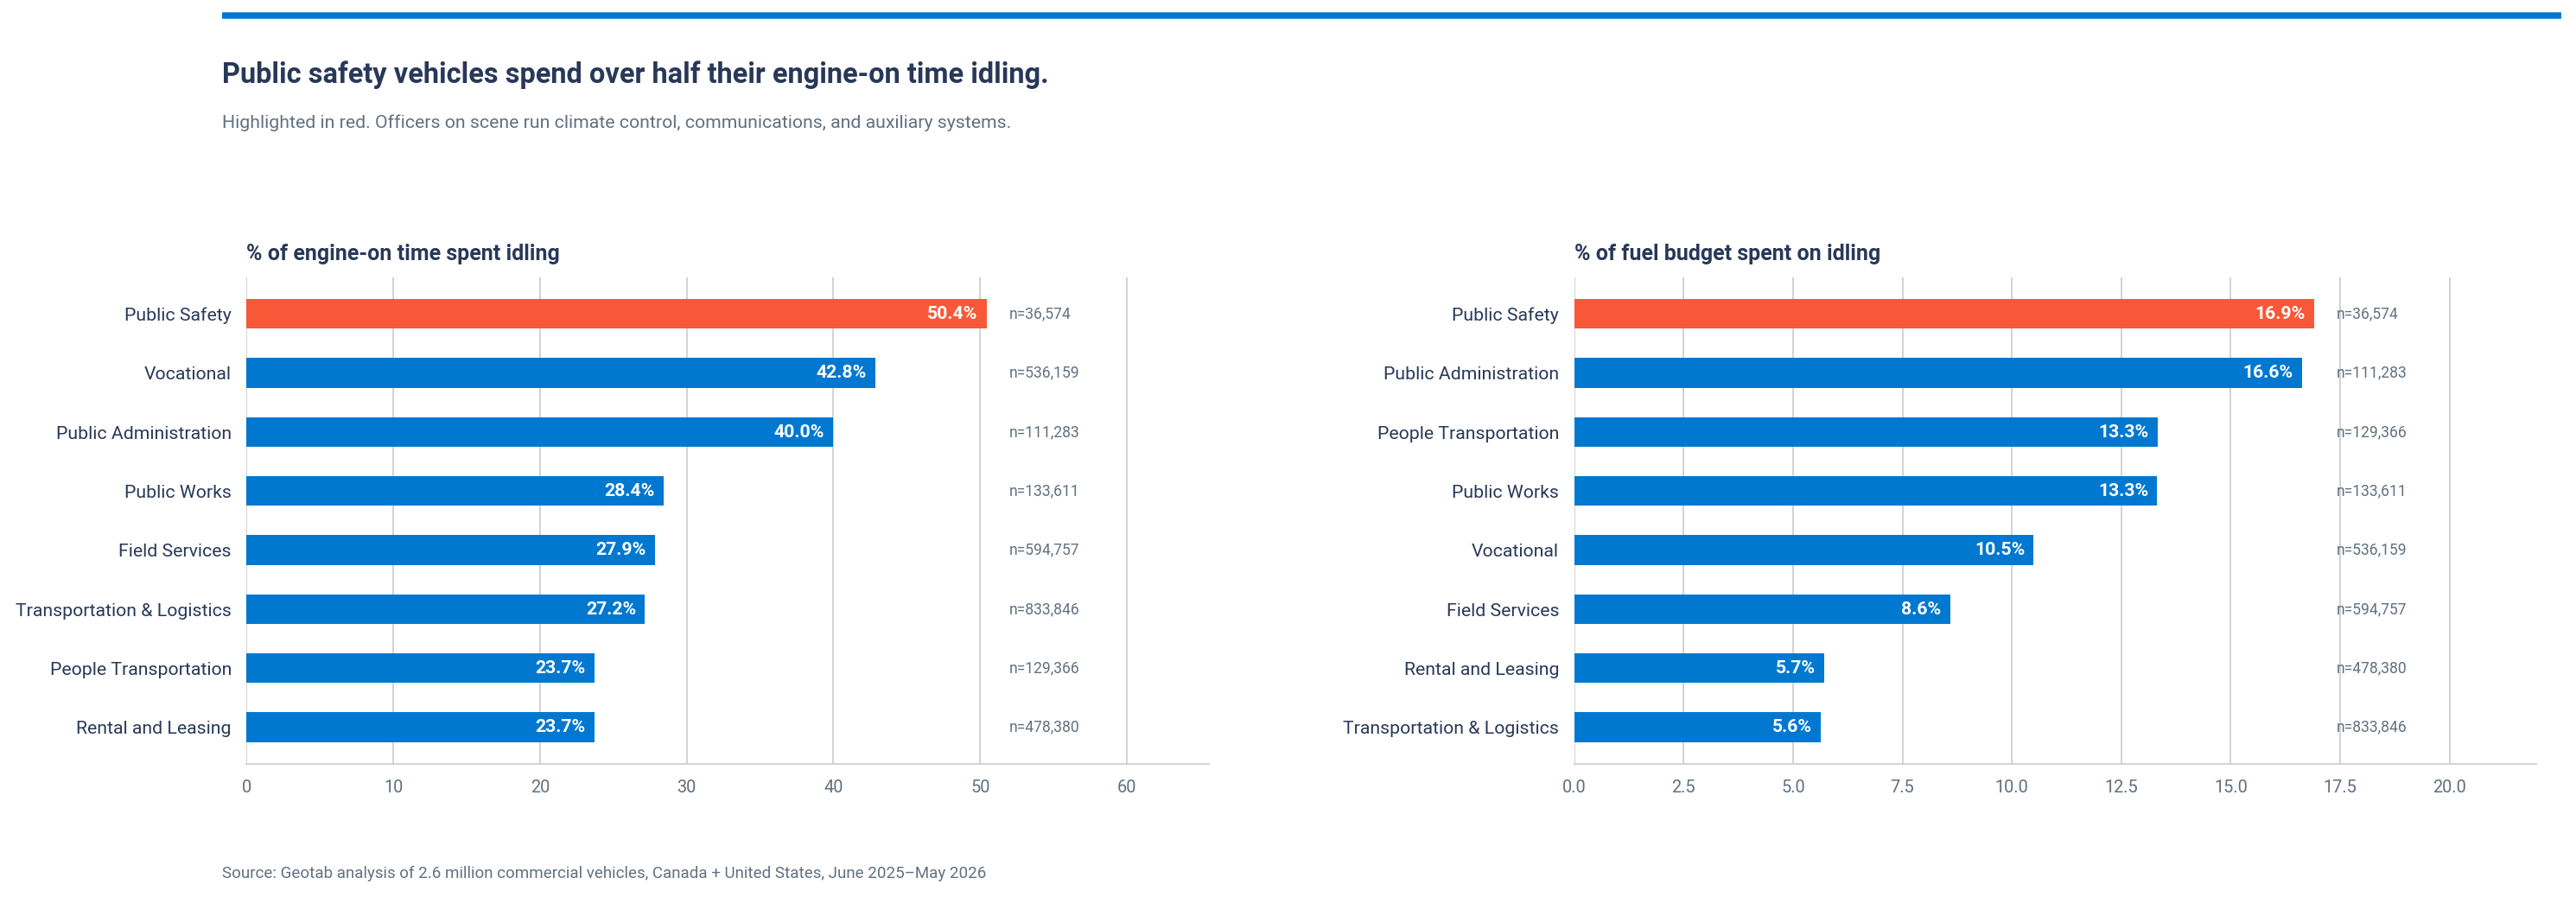
For some operations, the idling is the work. Public safety vehicles in our dataset spend over 50% of engine-on time idling, a figure that would look alarming on a standard fleet report but reflects exactly what you'd expect for vehicles running auxiliary systems, communications equipment and climate control while officers are on scene. The target isn't less idling, it's understanding what's driving it.
For others, the engine is doing real work, but it doesn't have to be the main engine doing it. Hub-and-spoke operations average 36% of engine-on time idling, driven by dwell time at docks and staging areas. A truck using its engine to activate a hydraulic lift may benefit from an electric power take-off (PTO) or auxiliary power unit to handle it instead. The question for these fleets is whether technology can take over that load.
For door-to-door operations, a larger share of idling is likely discretionary, with engines left running between stops rather than doing active work. But that depends on the operation: waste collection vehicles with compactor cycles look very different from parcel delivery on this metric. Checking your PTO activity data alongside idle time is the fastest way to know how much is genuinely avoidable. Driver behavior is usually the first lever for the discretionary portion, and the one with the fastest payback without capital investment.
Engine-on time spent idling and idle fuel share, by fleet segment
The biggest savings opportunity: targeting the worst performers
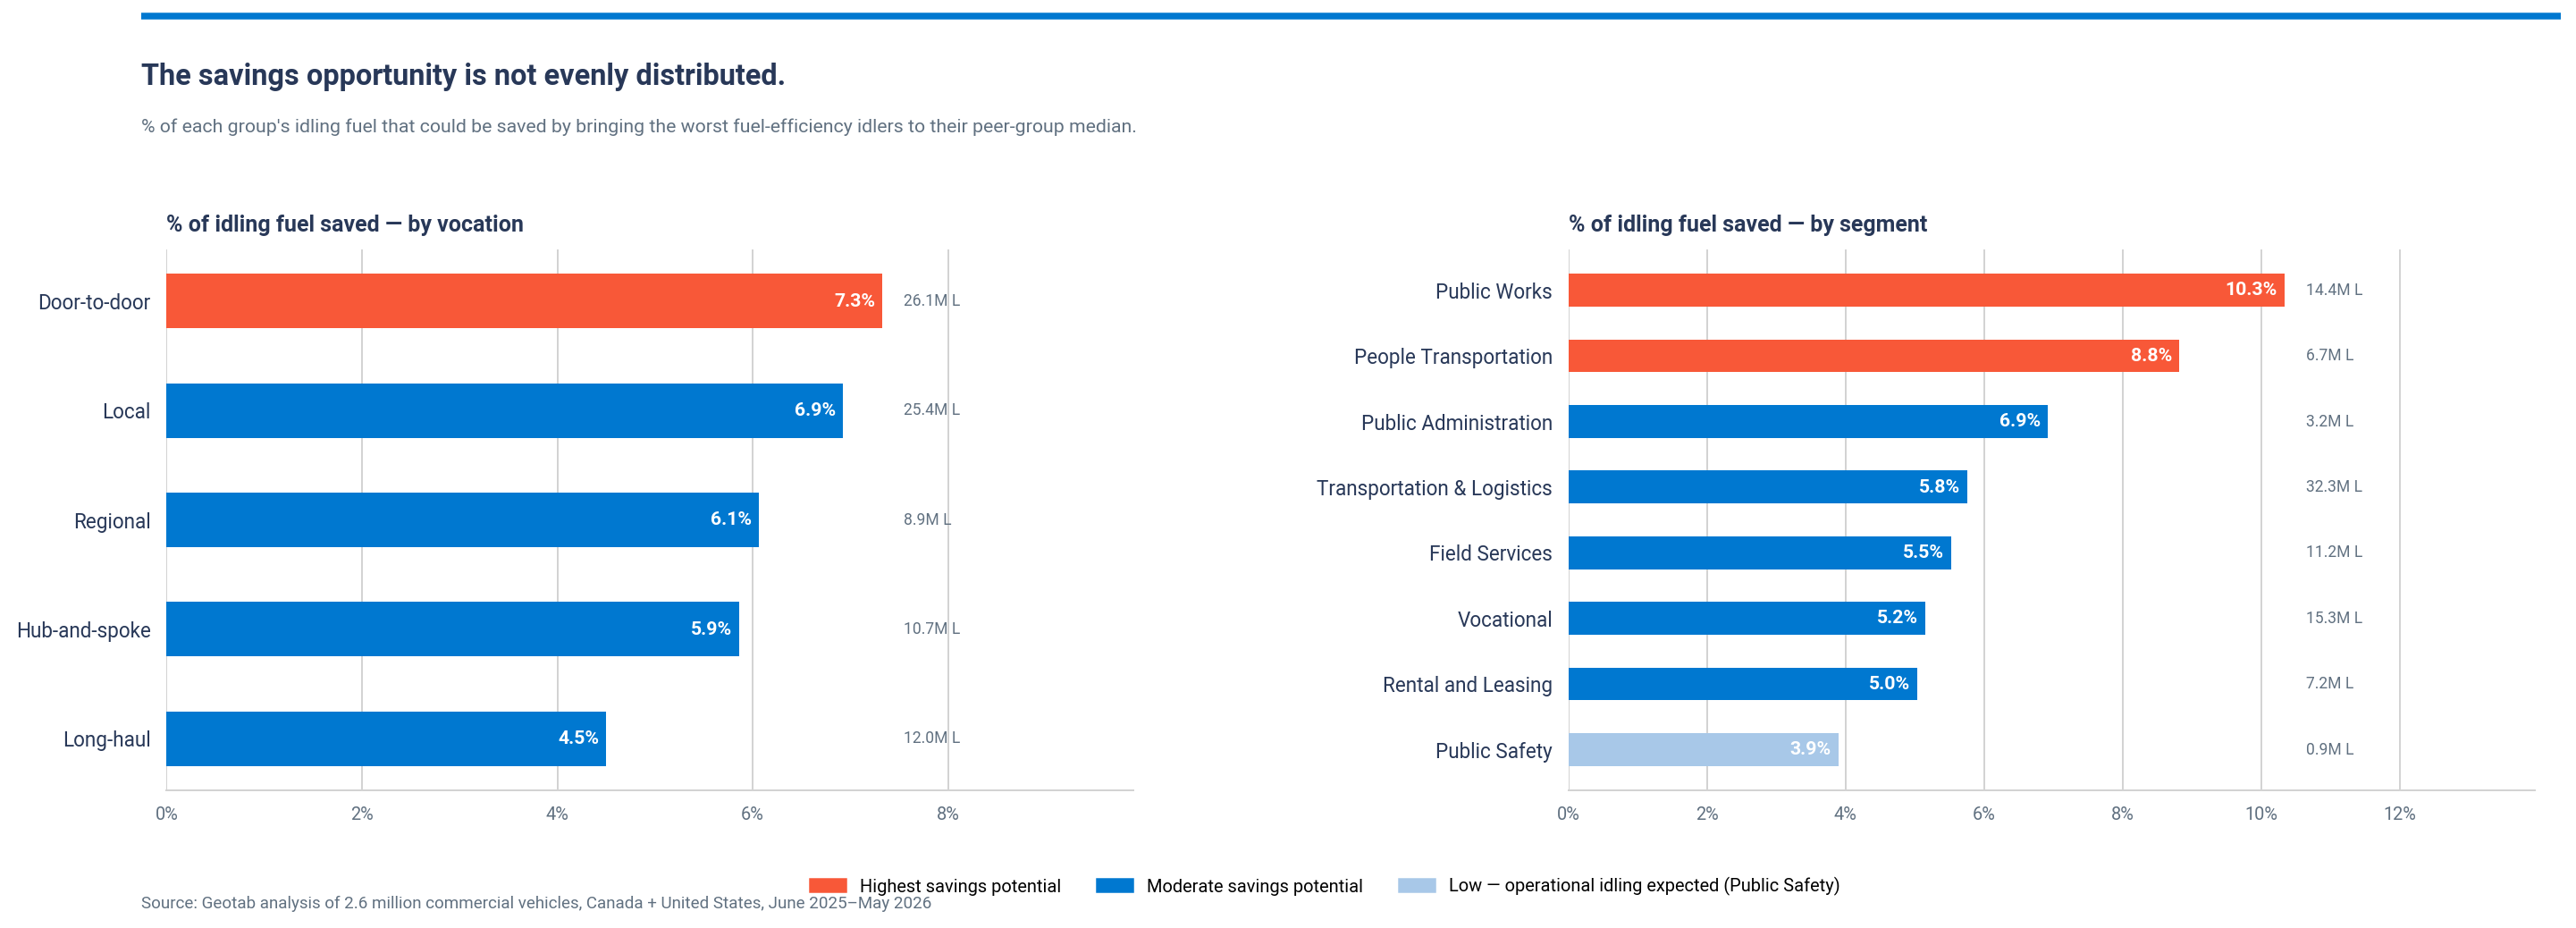
What's the potential savings? A fair answer requires a fair comparison. Benchmarking all vehicles against a single average ignores the reality that different operations idle differently by design. A fairer lens is benchmarking within peer groups (defined by vocation, vehicle type, and weight class) so the target reflects what's actually achievable for that type of operation, not an arbitrary reduction to zero. By that measure, the worst 10% of idlers represent the clearest opportunity. Bringing those 261,000 vehicles to their peer group median would save 24.2 million gallons (91 million liters) over the year, worth $105 million USD based on average gasoline and diesel prices in the first half of 2026, or roughly $400 per underperforming vehicle.
That savings potential isn’t evenly distributed. The charts below show where it’s most concentrated, by vocation and by fleet segment. Door-to-door carries the largest opportunity by vocation, and public works and people transportation lead by segment.
Biggest opportunities for fuel savings, by vocation and by segment
How to identify which idling is worth addressing
Addressing idling starts with your own data.
- Pull your idling data by vocation and vehicle class. Look at idle hours per driving day, idling as a share of total fuel consumed, and idle time relative to total engine-on time. This helps establish your baseline.
- Separate operational idling from avoidable idling before drawing conclusions. PTO activity is the obvious example: a boom lift or vacuum system means the engine is doing real work. But operational idling is broader than that. Drivers without access to a facility may use the cab for administrative work or rest, often running in-cab climate control. Understand how and why your drivers are actually idling before enforcing strict idle policies.
- For discretionary idling, start with driver behavior. Idle reduction coaching, telematics-triggered alerts and clear idle policies can reduce idle time without capital investment. Driver performance programs, including coaching and recognition of top performers tied to idle metrics, give drivers a reason to engage with the data rather than just be measured by it.
- For operational idling, ask whether the main engine actually needs to run. In a growing number of cases, it doesn't. Auxiliary power units, electric PTO and vehicle-mounted power systems can handle cab climate, communications equipment and work equipment without it. For high-idle vocations like public safety, utilities and construction, this is often where the strongest long-term ROI case is.
The right question to ask
The fleets that make real progress on idling aren't necessarily the ones with the strictest policies; they're the ones that understand what their data is actually telling them. That starts with asking a better question: not “How much are we idling?” but “Which idling is actually worth targeting?” That question is where the real work begins, and where the real savings are.
Subscribe to get industry tips and insights
Senior Manager, Sustainable Mobility at Geotab
Charlotte Argue is a sustainable transportation expert, conference speaker and industry board member with 15+ years experience in EVs.
Table of Contents
Subscribe to get industry tips and insights
Related posts
Top seven best fleet fuel cards: How to choose the right one for your business?
October 1, 2026
7 minute read

Why the OEM versus device-level telematics debate misses the point for mixed-fleet operators
September 25, 2026
2 minute read

EV fleet transition plan: Step-by-step guide for U.S. fleets 2026
September 17, 2026
6 minute read

EV fleet transition: How to plan a successful fleet electrification strategy
September 11, 2026
8 minute read