Fleet Industry Trends report now available in MyGeotab
MyGeotab users will have access to regularly updated fleet industry trends right from their Dashboard.
By Geotab
Apr 24, 2023

Fleet and vehicle trends are now at your fingertips with the new Fleet Industry Trends report from Geotab. Updated monthly, the report shows insights on all things fleet, based on intelligence data from data.geotab.com.
MyGeotab users can find the report easily by going to the menu and clicking Dashboard & Analytics > Fleet Industry Trends. The Fleet Industry Trends tab was added to MyGeotab in the 1901 update.
The report is visible to all users except those with “Driver App” and “Nothing” clearance levels. View data in imperial or metric units by switching the toggle at the top-right of the page.
What Fleet Industry Trends will I see?
Go to the Fleet Industry Trends report for current insights on driving activity, fleet composition, idling trends, fuel economy, and driver safety. Learn about developing trends in the fleet industry and gauge performance by comparing your fleet to others.
The report helps answer questions such as:
- What does the average commercial vehicle fleet look like?
- How are other fleets performing on idle time?
- What is the average fuel economy by light duty, medium duty and heavy duty trucks?
Take an in-depth look at:
- Fuel economy trends by engine size, truck class, and fleet make/model
- Idling percentage, by temperature, time of day, vehicle vocation and city size
- Hazardous driving incidents worldwide by type of event and vehicle vocation
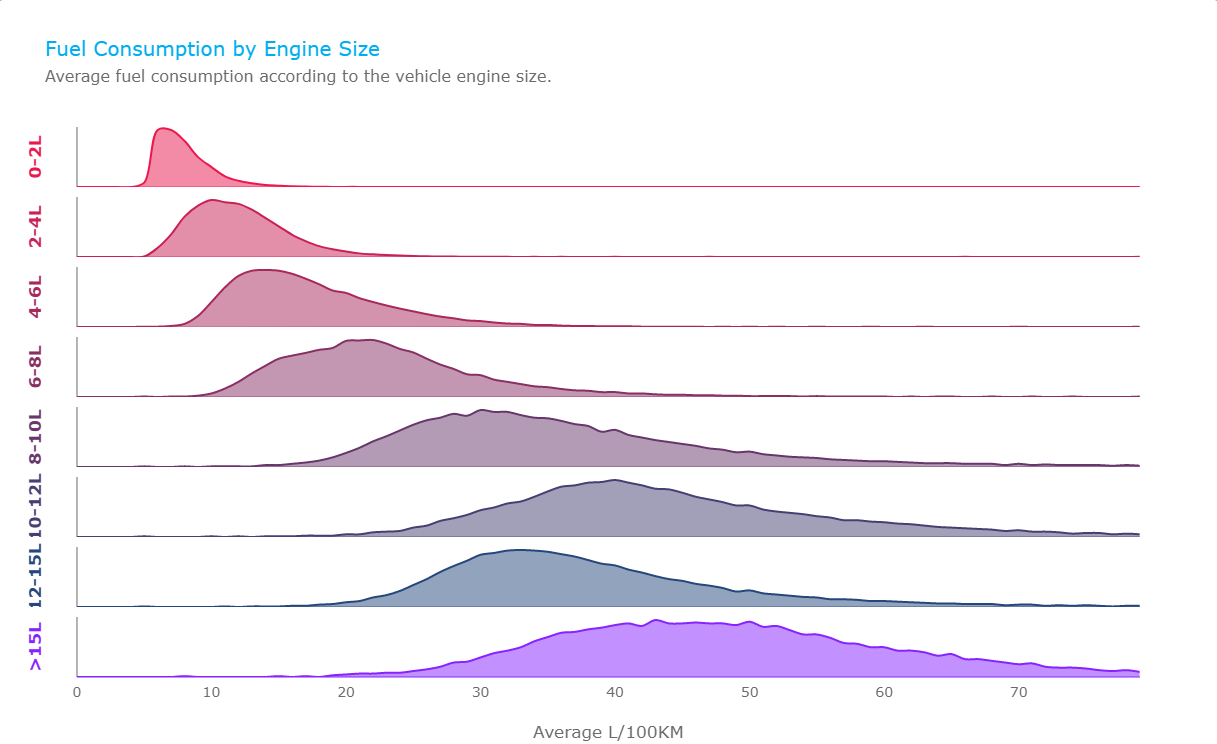
Fuel Consumption by Engine Size is just one of the charts in the Fleet Industry Trends report.
Geotab applies AI and machine learning algorithms to classify vehicles by vocation. This classification is based on identifying the driving patterns typical of vehicles such as a police patrol car, a school bus, a long haul truck, a construction vehicle, and so on. Patterns are calculated using information such as the length of a vehicle’s trip, number of stops and duration at each stop, geographic range, the amount of idling at each stop, and hours of activity. These vocations have been created by the Geotab Data Science team to provide a way to benchmark categories of vehicles based on their regular day-to-day movements.

Benchmark your fleet with MyGeotab
The Fleet Industry Trends page will be updated on the first day of each month. The first-day updates mean fleet managers can use this data to benchmark their own fleet’s performance for the coming month.
This is the first iteration of this product, and as we progress, Geotab will be collecting feedback from customers and producing deeper insight allowing you to compare your fleet with comparable fleets for specific purposes such as fuel economy, idling, utilization, and more.
Don’t miss an update! Subscribe to the Geotab newsletter to receive Geotab and fleet news direct to your inbox.
Related:
Don’t make these big data mistakes
Subscribe to get industry tips and insights
Geotab team
Subscribe to get industry tips and insights
Related posts


14 Fleet management key performance indicators you should track to boost efficiency
December 1, 2025
7 minute read

Your ultimate back to school bus fleet operations checklist
August 6, 2025
4 minute read

Autonomous trucking: The impact of self-driving trucks in the freight industry + guide
July 30, 2025
6 minute read