Fleet management dashboard best practices: Essential features for efficiency and compliance
A fleet management dashboard centralizes fleet data to support faster, more informed decisions. This article explains how to use dashboards effectively in day-to-day operations.
By Geotab Team
May 1, 2026
Key Insights
- A fleet management dashboard centralizes data so you can monitor fleet activity and act quickly.
- Dashboards support live oversight, while reports summarize historical data for reviews and compliance.
- Focus dashboards on high-impact metrics, like safety, utilization, maintenance and fuel use.
- Design dashboards by role so each team sees relevant data and clear priorities.
Small issues can turn into costly problems when fleet data lives across spreadsheets and disconnected systems. A fleet management dashboard lets you see what is happening across vehicles, drivers and operations in real time. This allows you to act faster and support compliance as your fleet grows.
Fleet managers often rely on dashboards and reports to track performance, but each tool plays a different role.
In this article, we draw on insights from an interview with Donald Tuggle, Digital Automation Specialist at Geotab, to explain fleet management dashboard best practices. He’ll cover which essential features matter most and how dashboards work alongside reports to support smarter day-to-day decisions and long-term fleet outcomes.
What a fleet management dashboard does (and why it matters)
A fleet management dashboard shows your fleet's current health and performance in a visual, easy-to-read format to support faster, more informed decisions.
They turn raw fleet data into clear signals that help growing fleets spot risks, control spending and allocate vehicles more efficiently.
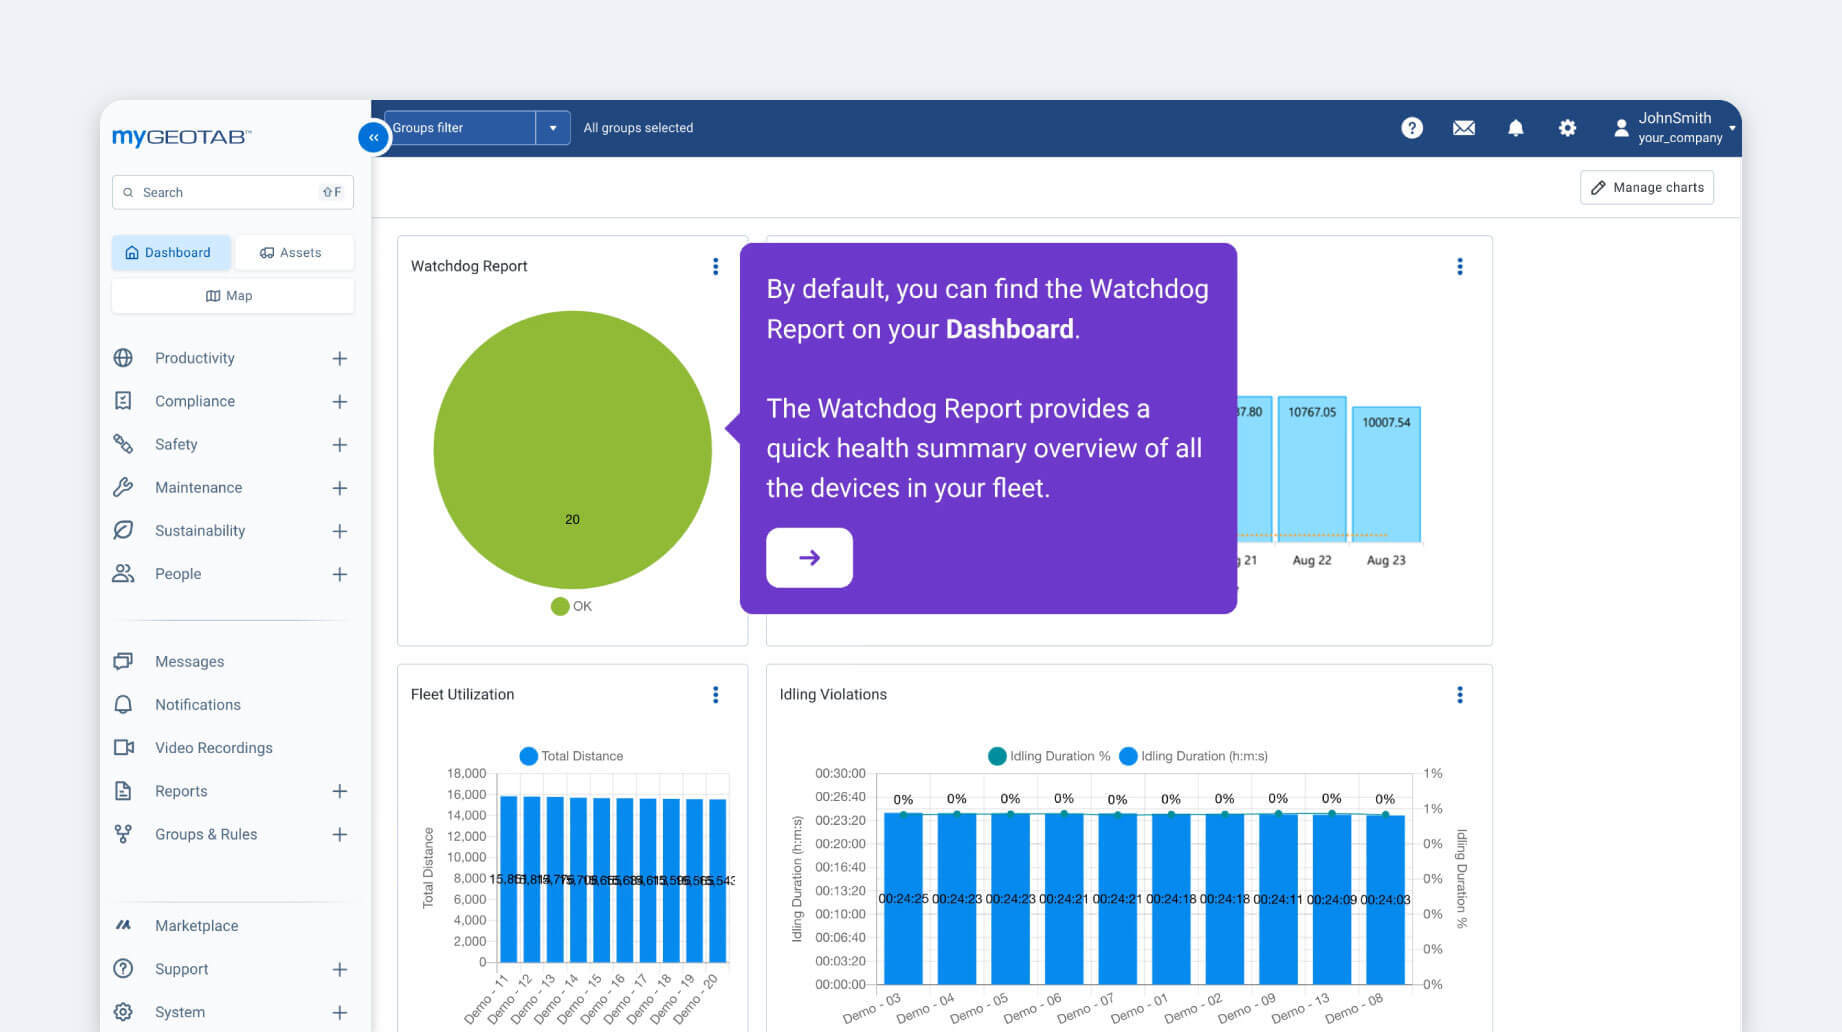
A good example of dashboard-style monitoring in MyGeotab is the Watchdog Report, which helps managers monitor device health and communications. This dashboard highlights status issues, including:
- Lost service
- Unplugged devices
- Devices not installed
Dashboard refresh timing depends on the use case. The frequency could range from once a day to as needed. What matters most is knowing how often your data updates, so you can trust it when making decisions.
Key features of a modern fleet management dashboard
A modern fleet management dashboard should have the tools you need to manage safety and compliance risk and stay ahead of maintenance and cost issues as fleets grow.
- Real-time vehicle tracking: Fleet views show vehicle locations and speed in real time. They also flag when vehicles stop unexpectedly. This helps optimize routes, cut idling and handle delays or customer changes faster.
- Driver behavior and safety insights: Dashboards highlight patterns such as speeding or harsh braking, giving you a clearer view of driving behavior. These insights support coaching efforts, strengthen compliance and help reduce risk across the fleet.
- Maintenance and diagnostic alerts: Dashboards surface alerts based on engine hours or diagnostic trouble codes (DTCs), supporting predictive maintenance (PM). With this visibility, you can plan service earlier, reduce unplanned downtime and manage the vehicle’s total cost of ownership (TCO) more efficiently over time.
- Custom dashboards and KPIs: You can configure dashboards to highlight the KPIs that matter most to your operation, helping you prioritize actions and track performance without sorting through unnecessary data.
- Notifications and exceptions: Dashboards alert you when activity falls outside expected thresholds, such as missed inspections or inactive telematics devices. This exception-based view helps teams focus on issues that need immediate follow-up.
How to use a fleet management dashboard effectively
Dashboards make it easier for fleets to work with fleet data and make informed decisions without advanced technical expertise. However, a dashboard only adds value when it clearly presents the right information and in the right context.
Effective dashboard design focuses on relevance, simplicity and clarity, helping you understand what the data shows and what to do about it. Poorly designed dashboards can cause you to miss important signals and make slower decisions.
Design dashboards for the people who use them
Before designing a dashboard, it is important to understand who the audience is, what information they need and which data is relevant to their role. Data only adds value when users can quickly tell whether what they are seeing is expected or requires attention. Without that context, it becomes harder to know what action is needed.
Dashboards provide context by pairing data with clear explanations and reference points, including:
- Clear titles and headings
- Labels, series and legends for charts
- Chart tool-tips that explain values or trends
- Comparison values such as targets or previous periods like the prior month, quarter or year
Keep it simple
Dashboards work best when they focus attention on what matters most. When dashboards become cluttered, important information can be harder to find and act upon. A simple dashboard prioritizes essential data and removes elements that do not support the objective.
When simplifying a dashboard, it helps to think in terms of two groups. The first includes data that provides necessary context and supports decision-making. The second includes elements that add little value to the objective, such as decorative logos or unnecessary navigation terms.
Additional tips to keep dashboards simple include:
- Reduce clutter: Use filters or hierarchies to layer information, or split content across multiple dashboards when needed.
- Group data logically: Organize data by department, function or use case so related information displays together.
- Use white space intentionally: Space between charts and widgets improves readability and reduces visual overload.
- Limit metrics to what matters: Display only the data that supports the dashboard’s purpose.
- Use colors sparingly: Too many colors can distract from key insights.
- Design for quick scanning: Keep the most important metrics visible without needing to scroll.
Focus on the metrics that actually matter
It can be tempting to track every metric available, but dashboards are most useful when they stay focused on key criteria tied directly to operational goals.
Tracking too many metrics at once can dilute attention and make it harder to identify what requires action. However, focusing on fewer, high-impact metrics can help you quickly understand performance and make decisions with confidence.
Common metrics that support effective fleet management:
- Fuel efficiency and idle time: Track miles per gallon (MPG) or liters per 100 kilometers (L/100km), along with fleet idling percentages. Consistently high idle time can signal fuel waste and opportunities to improve driver habits or routing.
- Vehicle utilization: Measure active hours vs. total available hours to balance workloads and right-size fleets. Many operations aim for utilization rates around 85-95% to maintain availability while using assets efficiently.
- Maintenance compliance: Monitoring maintenance status, such as overdue PM schedules or DTC alerts, can reduce breakdowns and meet Department of Transportation (DOT) or Federal Motor Carrier Safety Administration (FMCSA) requirements.
- Driver safety scores: Driver scorecards bring driver behavior monitoring into a single view by combining signals such as speeding or harsh braking. You can use these composite scores to support targeted coaching and help reduce crash risk across the fleet.
Dashboards vs. reports: When to use each
Dashboards are built for real-time monitoring to help you identify and respond to issues as they arise. They show current conditions at a glance, such as:
- Vehicle locations
- Active exceptions
- Overdue maintenance
Reports are designed for summary, analysis and documentation. They compile historical data over a set period, and fleet companies commonly use them:
- Audits
- Compliance checks
- Performance reviews
- Executive reporting
Used together, dashboards provide immediate visibility while reports deliver the context needed to evaluate trends and outcomes.
Customizing dashboards and reports in MyGeotab
Get a deeper understanding of your fleet with a customizable dashboard that shares essential data such as fuel consumption, maintenance or compliance trends in a single, cohesive view.
Custom dashboard reports are easy to use and present data in a more systematic and centralized way. They help managers with answering complex business-related questions and organizing their fleet efficiently, thereby improving operations.
How can I create a custom dashboard report?
The Dashboard section of MyGeotab is the front page of your fleet management portal. You can pull any data from your portal on demand.
However, putting the important metrics in one central location is a great way to save time and make your job easier.
There are four easy steps to setting up a new dashboard report:
- Determine what you want to measure
- Export the Exceptions Report into MS Excel
- Create an Excel chart
- Import your Excel file into MyGeotab
The section below will go into detail on how to design your custom report.
Designing a MyGeotab Custom Report
Step 1: Determine what you want to measure
Start by defining the metric you want to track. The right metric depends on your business goals, such as improving driver safety, optimizing fleet usage or supporting compliance.
Examples of common metrics:
- Rule violations (such as seat belt usage)
- Daily distance driven
- Maximum vehicle speed
- Driver scorecards
- Overall fleet risk levels
In this example, we’ll focus on identifying top seat belt rule offenders.
Step 2: Export an Exceptions Report to Excel
In MyGeotab, navigate to Rules & Groups > Exceptions.
Under Options, select:
- Your date range
- The vehicles you want to analyze
- The rule you want to track (Seat belt)
Click Apply changes to generate the list of exceptions.
To export the data, click Report > Details > Standard. The file will download to your computer as an Excel report.
| Note: Custom reports support a maximum of 1,000 rows in Excel. Adjust the date range or vehicle selection if needed. |
Step 3: Create a chart in Excel
Open the downloaded Excel file and select the Summary tab. This tab contains a PivotTable that will be used to build the dashboard chart.
- Click anywhere inside the PivotTable to open the PivotTable Fields panel.
- Leave only Name and Incident Count selected.
- From the Excel toolbar, go to PivotTable Analyze > PivotChart.
- Choose your chart type (for example, a clustered column chart) and click OK.
Once the chart is created, save the file in .xlsx or .xlsm format.
Step 4: Import the Excel file into MyGeotab
In MyGeotab, go to Administration > Reports > Report Views and select Create Custom Report. Upload your Excel file.
After uploading, configure the report:
- Enable Show report in drop-down list
- Enable Dashboard graphic options
- Choose who can view the dashboard (all users or specific groups)
- Set the date range, refresh period and run schedule (for example, weekly)
Rename the report (for example, Seatbelt Violations) and click Save.
Your custom report will now appear on the MyGeotab dashboard and refresh automatically based on your selected schedule.
How stakeholders use a fleet management dashboard
A fleet management dashboard supports different roles across an organization by presenting the same data in ways that match each team’s responsibilities. While everyone looks at fleet performance, the questions they need answered and the decisions they make can vary by role:
- Fleet managers: Use dashboards as part of their daily oversight duties to monitor vehicle locations, track idle time percentages, review maintenance alerts and respond to exceptions.
- Safety teams: They rely on dashboards to track driver behaviors such as speeding or harsh braking, spot risk patterns and support compliance with organizations like the FMCSA Hours of Service (HOS) rules.
- Operations leaders: These leaders use dashboards to assess vehicle utilization rates, pinpoint bottlenecks such as underused assets and forecast resource needs for better scheduling.
- Executives: High-level dashboard views help executives track performance trends such as cost per mile. They also use them to evaluate telematics ROI through metrics such as fuel savings or reduced violations.
Explore fleet management dashboards with Geotab
A fleet management dashboard in MyGeotab runs on a platform that delivers reliable, decision-ready vehicle data at scale. It brings this information into dashboards and reports that leadership can trust for performance tracking and long-term planning as fleets grow.
If you are evaluating how to improve oversight and support smarter investment decisions, explore Geotab’s solutions to see how a fleet management dashboard fits into a broader, data-driven fleet strategy.
Subscribe to get industry tips and insights
Frequently Asked Questions
You monitor fleet management by using connected vehicle data, such as telematics or GPS tracking, to track vehicle performance and compliance on an ongoing basis.
Fleet management dashboards help you review real-time information such as vehicle location or maintenance status, while reports support regular reviews and long-term analysis.
Fleet management dashboards are customizable. You can pick metrics, visuals and widgets, set refresh rates and control access so you only see relevant data.
Multiple stakeholders across an organization use fleet management dashboards. Fleet managers rely on dashboards for daily oversight, safety teams use them to monitor risk and compliance, operations leaders track efficiency and usage, while finance uses them to understand trends and total costs.
The Geotab Team write about company news.
Table of Contents
- What a fleet management dashboard does (and why it matters)
- Key features of a modern fleet management dashboard
- How to use a fleet management dashboard effectively
- Dashboards vs. reports: When to use each
- Customizing dashboards and reports in MyGeotab
- Designing a MyGeotab Custom Report
- How stakeholders use a fleet management dashboard
- Explore fleet management dashboards with Geotab
Subscribe to get industry tips and insights
Related posts

Construction fleet management software: What mixed fleets should look for
July 29, 2026
5 minute read


Beyond consumer apps: 5 ways integrated navigation protects your fleet
July 23, 2026
6 minute read

From video archives to active prevention: The case for AI dash cams
July 22, 2026
4 minute read


Crafting a fleet incident management plan that helps your municipality get ahead of claims
July 16, 2026
5 minute read