Fine-tuning fleet performance with data
In both IndyCar racing and fleet management, real-time data on fleet performance is essential to getting the competitive edge and winning the race.

By Nadine Haupt
Dec 22, 2023

In the world of IndyCar racing, real-time data is essential to getting the competitive advantage and winning the race. The same goes for fleet management. Success depends on having the right data when you need it. Geotab’s Nadine Haupt, former IndyCar trackside engineer, gives advice on organizing your data so you can pinpoint issues and boost fleet performance.
Telemetry in the World of IndyCar Racing
The world of telematics is not new to me. As the first female trackside engineer in IndyCar racing, I depended on the real-time data — provided by telemetry — to tune race-engines. My primary focus was optimizing the engine for peak performance while adjusting to the specific needs of the driver and car.
Real-time data from the race car was delivered to my laptop through the use of a telematic data logging device installed on the car. Every time the car was on track, I watched key engine performance indicators that would inform important adjustments and decisions.
Analytics in the Pit Box
I used a variety of parameters to track performance of the IndyCar vehicles, some of the engine and chassis vitals included engine RPM, oil and water temperatures and pressures, turbo boost pressure, fuel consumption, gear position, and wheel speed. Occasionally, when I was testing something specific, I would look at additional parameters to truly understand the dynamics and impact of the change I had made.
As I stood with the team at the timing stand in pit lane, my laptop was the primary tool for my work. The data would be fed into a software portal where I could monitor as the car ran, and while the car was getting mechanical adjustments in pit lane, analyze the captured data from a recent run.
When I was first introduced to the data analysis platform for racing, it was overwhelming. There was a lot of data and information on the standard dashboard templates. I quickly realized that the software was initially set up to support a chassis engineer, not an engine engineer.
I needed to develop my own unique custom dashboard — with metrics that were relevant to me — to quickly and easily assess the key performance indicators (KPIs), see trends, and monitor performance.
Fine-Tuning Your Own Business Metrics
Maybe you’re not fine-tuning the engine of an IndyCar, but you’re probably responsible for fine-tuning some aspect of your business. You have your own KPIs that show you the health of your business. Depending on your role and objectives, the data you need at your fingertips will be unique to you.
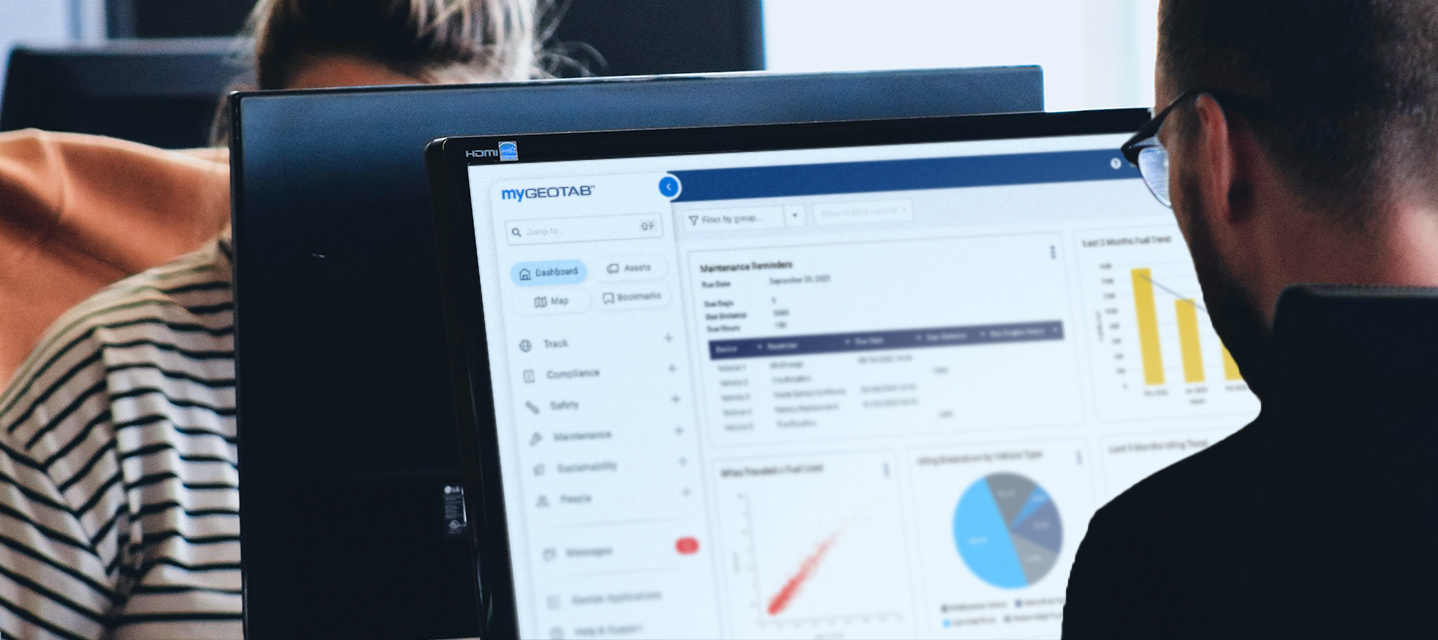
Whether your focus is risk management, fleet productivity, efficiency, or safety and compliance, the Geotab portal is the window into your business. But as I found in racing, the standard dashboard might not be what works best for you.
Why You Should Customize Your Fleet Dashboard
With telematics, the mountain of data that’s available to you can be overwhelming. Why should you consider customizing your Geotab dashboard? Here are three reasons:
- Make critical decisions and adjustments with ease — With a customized dashboard, you can quickly see only the data you need to make decisions and adjustments. By eliminating the extra data, you can focus in on those KPIs that will move your business closer to its goals.
- Identify and assess trends — Having a consistent view of fleet performance on your dashboard allows you to easily identify and assess trends. Trend analysis is a great way to notice changes over time so that you can understand the impact of an event or change.
- Monitor fleet performance in a way you understand — Personalize your layout so that you can quickly digest the information. The MyGeotab dashboard is designed so you can drag and drop the elements. Set up the display in a way that your own brain can easily process the data. Not only will it feel comfortable to you, it will allow you to assess situations and adjust accordingly without extra effort.
The amount of data that the Geotab telematics solution provides does not need to be overwhelming. With a custom dashboard, you can take a 30,000-foot view of your metrics. The option to dive deeper is always there if you notice a shift in pattern and want to analyze it further.
Start by identifying the key data you need to effectively and efficiently run your business. Then set up clear, easy-to-read reports on your dashboard to monitor trends and identify disruptions.
No matter your fleet goal, leveraging the power of customization can help you quickly get the information you need how your fleet is performing to make decisions with ease.
Related:
How to Design a Custom Dashboard Report
Subscribe to get industry tips and insights
Nadine Haupt is an OEM Business Development Manager for Geotab.
Table of Contents
Subscribe to get industry tips and insights
Related posts
Construction fleet management software: What mixed fleets should look for
July 29, 2026
5 minute read
Beyond consumer apps: 5 ways integrated navigation protects your fleet
July 23, 2026
6 minute read
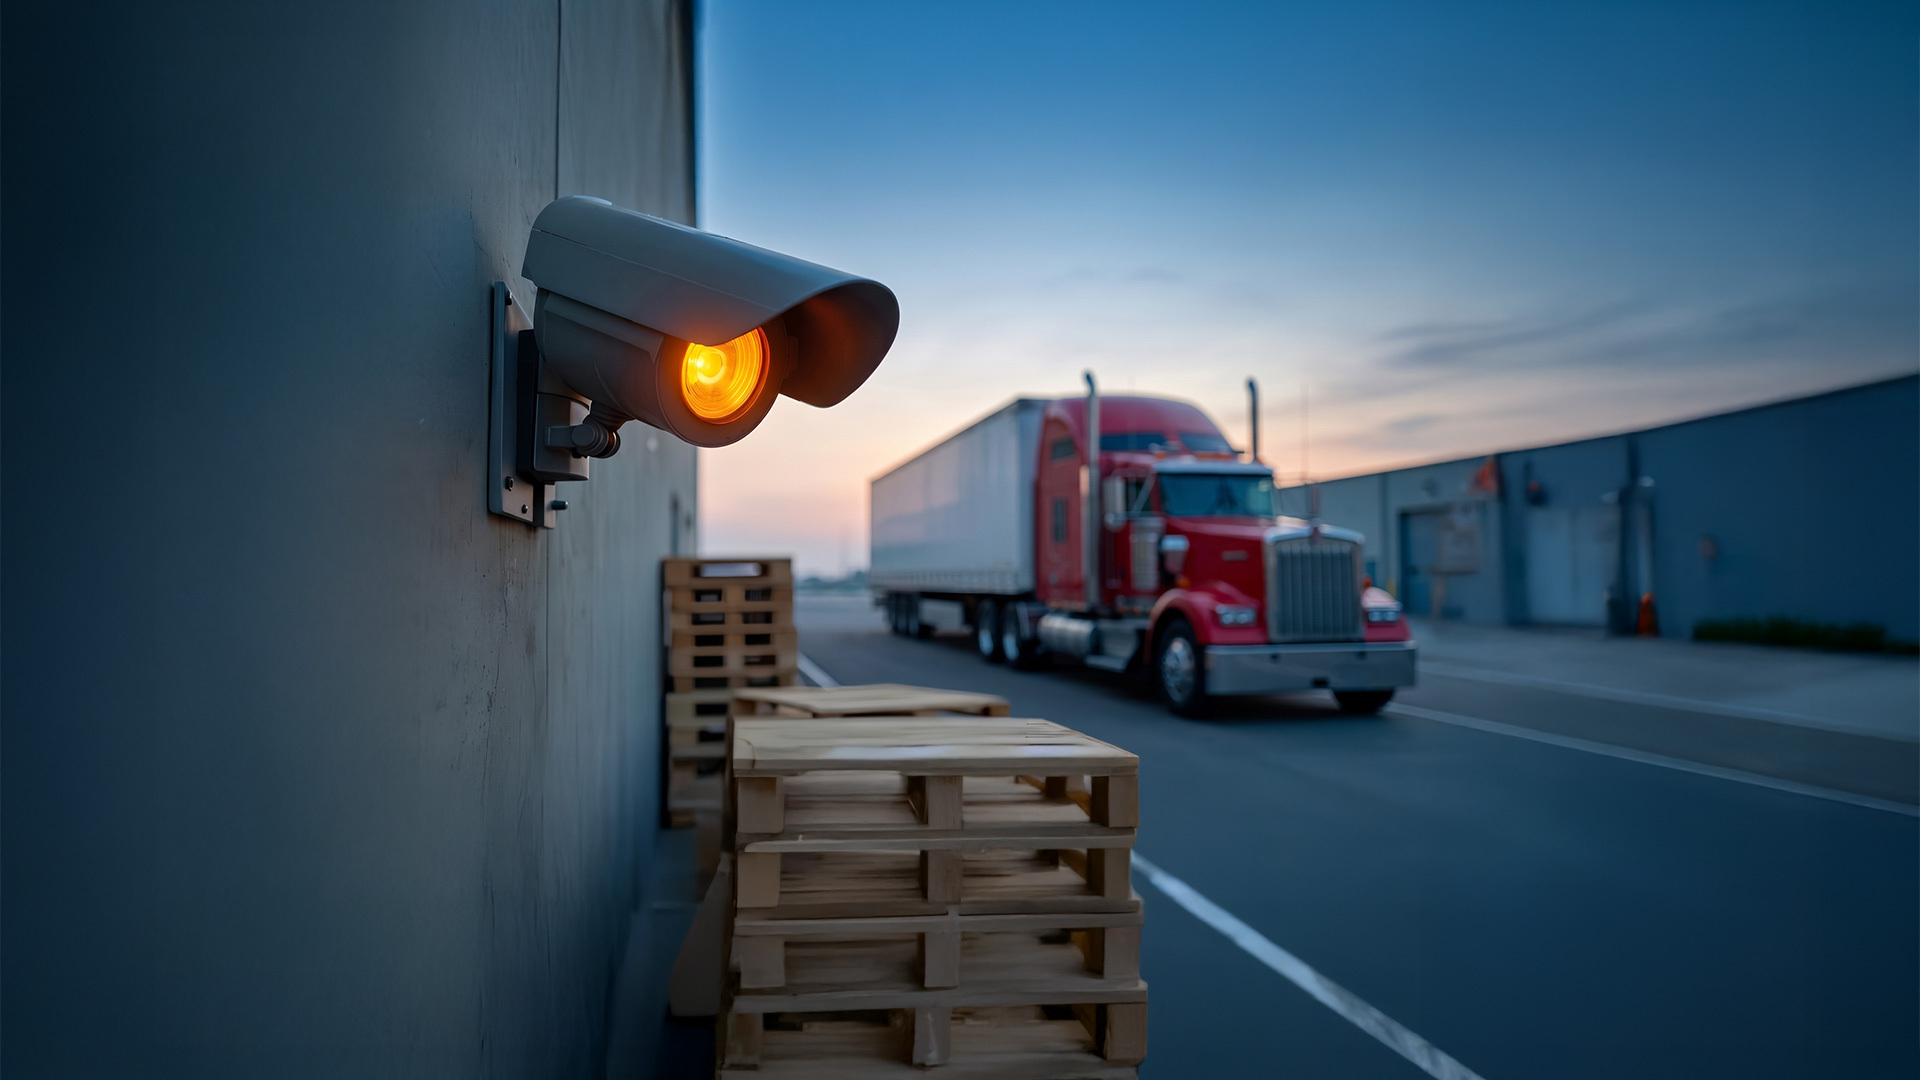
Closing blind spots in cargo security with a 360 fleet camera system
July 22, 2026
3 minute read
The safest mile in field service is the one nobody drives
July 22, 2026
2 minute read