Monitoring road icing with hyper-local temperature mapping
Data scientist, Daniel J. Lewis, demonstrates how cities can use hyper-local temperature mapping to prioritize the top locations for road salting in winter

By Daniel Lewis
Aug 26, 2024
Bridges often drop in temperature faster than other roadways, due to their exposed upper and lower surface. The temperature change can potentially lead to dangerous ice formation on the road surface when precipitation is present — surprising drivers and creating the risk of collisions. On days with rapid changes in inclement weather, or days where the temperature fluctuates above and below freezing, it may be difficult to prioritize locations for road salting to mitigate this risk, especially for cities with limited winter fleet resources.
Road salting is also costly in long-term maintenance as the salt penetrates through the concrete and gradually corrodes the embedded steel in steel-reinforced concrete bridges. Montréal’s Pont Champlain (Champlain Bridge), which has been salted every year, was in need of replacement only 50 years after construction at a total cost of over four billion Canadian dollars; work is still underway.
As a city maintenance official or engineer, what if you knew in real-time that due to traffic volume or hyper-local weather conditions that certain bridges remained above freezing temperatures? This could allow you to reduce maintenance costs by not salting those locations, or at least reducing the kg/lane-km used. It could give you the time to focus your attention on other bridges and roadways which do pose a current risk.
Knowing in real-time which bridges are at a high risk for ice formation would also allow alerts to be sent to drivers, warning them of changing and dangerous road conditions.
See Also: Protect Your Fleet from Winter Weather Hazards
Hyper-local temperature mapping enabled by Geotab vehicle tracking devices provides a way to actively monitor road conditions without any additional infrastructure. Over a million vehicles are connected to Geotab and temperature data is generated from over 250,000 of those vehicles per hour all throughout North America.
Example: Hyper-Local Temperature Mapping in Montréal
Among the many parameters we record is ambient air temperature from vehicles equipped with a sensor. This makes it possible to gather millions of temperature data points per hour in near real-time, and generate a comprehensive, constantly updating map of road temperature across the continent.
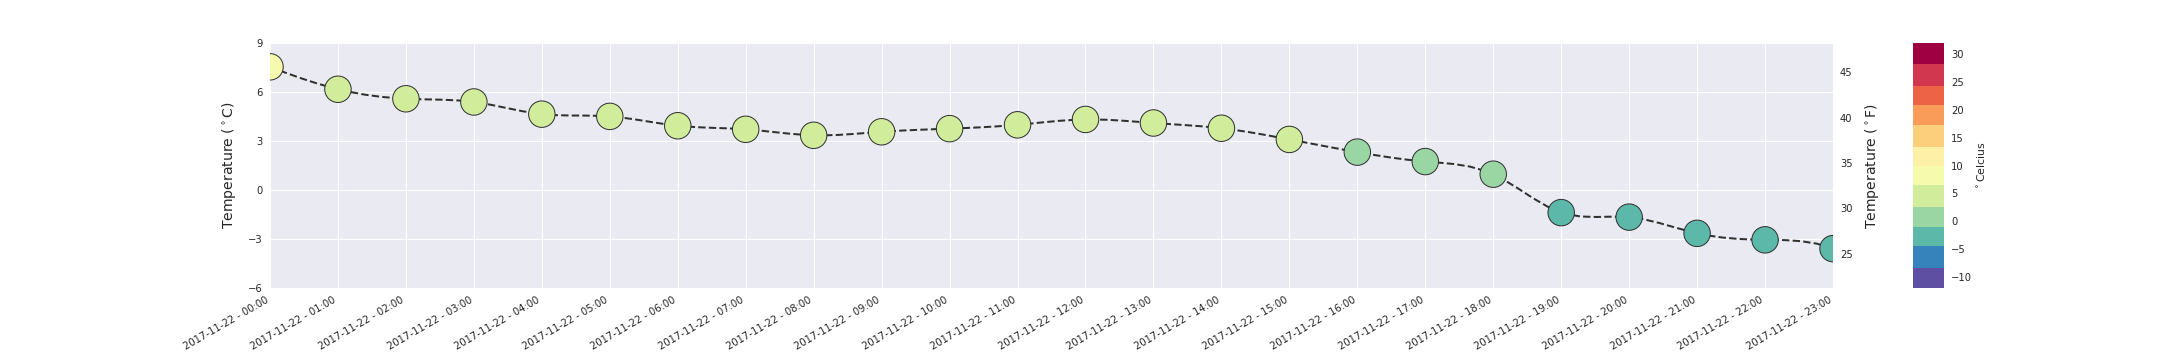
Figure 1. Example of Montréal average temperature change during one day in November.
Due to its many waterways and bridges with varying traffic volume, the city of Montréal, Québec, is an excellent example for the application of this data. The plots above show how local conditions and traffic volume caused various bridges to and from Montréal and Laval to drop below freezing at different points in the day.
The figure above shows the average temperature in Montréal per hour over the course of the day on Nov 22, 2017. While temperatures started off warm in the early morning, by early evening the temperature was dropping below the freezing point; there was also precipitation periodically throughout the day (light rain).
The following example illustrates the impact of differing traffic volume. The Pont Charles-de-Gaulle (Charles de Gaulle Bridge) over the Rivière des Prairies which links the eastern tip of Montréal with Charlemagne, has approximately 52 percent more traffic volume per day than the Pont Matthieu and Pont Lepage crossings over the Rivière des Mille Îles (linking Laval with Terrebonne).
The difference in traffic volume, and the local weather conditions caused by their locations along the river, lead to differing road temperatures throughout the day.
Figure 2. Animated map showing changing temperature on the bridges Pont Matthieu/Pont Lepage (left) and Pont Charles-de-Gaulle (right).
In the morning and early afternoon, when the average temperature of the region is still high, both crossings show similar road-level air temperatures. However, as the temperature begins to lower in the mid-afternoon, we see the lower-volume crossings over the Riviere des Mille Îles start to drop in temperature faster than the Pont Charles-de-Gaulle.
At 6:00 p.m., when the average city temperature is still above freezing, we see the Rivière des Mille Îles crossings have already dropped to below 0℃ (32℉), while the Pont Charles-de-Gaulle remains above 0℃. This is a potentially dangerous situation as weather stations for the city may be reporting above-freezing temperatures while the bridge already has ice forming. From there, as the temperature in the region continues to cool, Pont Charles-de-Gaulle rapidly drops in temperature (Pont Matthieu/Pont Lepage not shown after 6:00 pm due to limited traffic volume).
Learn more about near real-time temperature for urban planning, transportation and infrastructure management and find use cases for hyper-local temperature at data.geotab.com.
More from the Data & Analytics team:
Google Cloud Next: Geotab at the Forefront of AI for Smart Cities
Subscribe to get industry tips and insights
Daniel Lewis
Daniel Lewis is a Senior Data Scientist, R&D Specialist for Geotab, working on predictive maintenance and smart cities projects.
Table of Contents
Subscribe to get industry tips and insights
Related posts

Crafting a fleet incident management plan that helps your municipality get ahead of claims
July 16, 2026
5 minute read


How sanitation fleets can prevent return trips and reduce solid waste collection costs
June 15, 2026
3 minute read
.jpg)