Match day in my hometown: Worse traffic, less idling

Senior Manager, Sustainable Mobility at Geotab
Aug 13, 2026
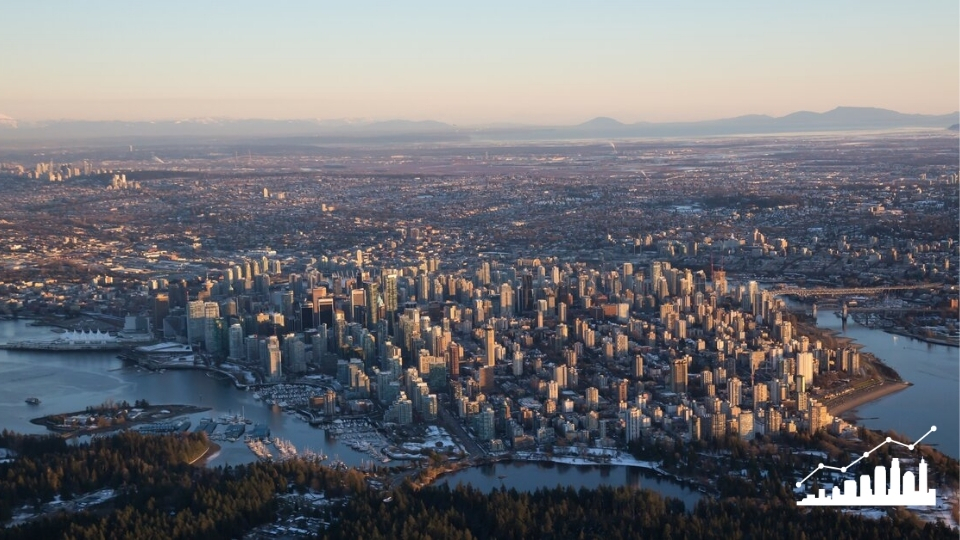
When 16 North American cities were on the world stage this summer, Geotab took the opportunity to measure commercial vehicle traffic to understand the impact on our roads.
Unsurprisingly, congestion got worse in 15 of 16 cities on match days, with slower average road speeds and stretched travel times. Counterintuitively, idle time, the hours commercial vehicles spend with engines running and wheels stationary, actually improved at 14 of 16 cities.
Being from Vancouver, I was particularly interested in how congestion and idling changed for my hometown.
BC Place sits right in the middle of the city with a SkyTrain station and multiple bus routes at its doorstep. As an urban centre, congestion is an everyday event, so worsening traffic on match days wasn't a surprise. Match-day congestion worsened by 1.4 points on our freight score, roughly in line with the urban average. On a typical day, the median commercial vehicle near BC Place idles for around 47 minutes. On match days, that fell to about 39, an 8-minute improvement per vehicle, and one of the top idle improvements across all 16 cities.
Road closures and fan-zone management around the stadium redirected surface traffic, and with direct transit access, a meaningful share of fans came by train, bus and foot rather than car. Commercial vehicles also appear to have avoided the zone during matches when they could, and when they were on the roads, they didn't sit around.
Canada’s other host city Toronto started with the lowest baseline congestion score (3.9 vs. Vancouver's 5.9), and congestion took a steeper hit on match days (2.2 points), the largest fall in the dataset. It had a harder time absorbing the load in an already very congested region particularly after the matches ended. However, Toronto, like Vancouver, had one of the largest improvements in idle time (albeit both starting from poor positions).
Suburban venues were more insulated from both effects. Purpose-built for car-based crowds with highway access corridors that keep fan traffic away from freight routes, they averaged a 0.9-point congestion drop and about 4 minutes of idle improvement on match days, roughly half Vancouver's idle gain. (Not to say suburban venues are more efficient; longer distances to travel and fewer alternative modes generally means more fuel burned overall.)
I certainly didn’t expect a massive sporting event to temporarily improve idle times. If idle were purely a product of congestion, the two metrics would move together. It raises the question how much of our cities’ baseline idling is avoidable in the first place.
.png)
Disclaimer: The Host City Ranking is not endorsed by or affiliated with FEDERATION INTERNATIONALE DE FOOTBALL ASSOCIATION (FIFA) or the 2026 FIFA World Cup in any way. The Host City Ranking is an independent analysis based on Geotab's proprietary commercial vehicle data.
Subscribe to get industry tips and insights
Senior Manager, Sustainable Mobility at Geotab
Charlotte Argue is a sustainable transportation expert, conference speaker and industry board member with 15+ years experience in EVs.
Subscribe to get industry tips and insights
Related posts

Why the OEM versus device-level telematics debate misses the point for mixed-fleet operators
September 25, 2026
2 minute read


European data sovereignty: the next step we've been building toward
September 9, 2026
2 minute read
The leasing industry helped build the autonomous future
August 25, 2026
1 minute read
What an EV battery is actually worth at the end of a lease
August 20, 2026
2 minute read