Taming the technical issue
In the technology industry, technical issues can arise. Sometimes these technologies we depend on don’t work as expected
By Geotab
Dec 28, 2023

A common theme in the technology industry, in general, is that technical issues can arise. Sometimes these technologies we depend on don’t work as expected – a frustrating experience for any end user. In a recent J.D. Power study, it was noted that there’s a climate of high consumer demand for new in-vehicle technology, such as audio, entertainment, and navigation, and that these systems are some of the most problematic categories in today’s new vehicles. In fact, a consumer report on infotainment reported that a vast majority of the 3,148 respondents found infotainment systems “complicated and trouble-prone.” While some of this can be attributed to learning curves, there is no doubt that technical issues can arise with new and old technology.
In looking at telematics specifically, it should come as little surprise that a large amount of data gets generated every day. The data moves from the device to the server and is then presented in easy to view reports for the end user. Should a technical issue occur along the way, root causes must be identified. The purpose of this article is to provide you with a bigger picture of how technical issues are typically identified, in addition to looking at the debugging steps for external technicians.
It Always Starts With Issue Isolation
Since telematics systems are such amazing sources of information that drive business decisions, there’s always an expectation that repairs are prompt. One quick way to the root of an issue is to try to isolate it.
Here’s a map of how a telematics system’s architecture might look like:
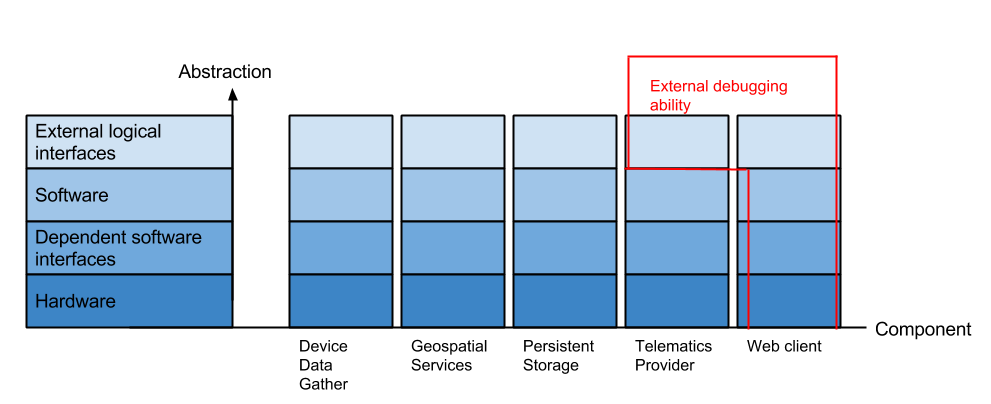
Figure 1 presents two axis:
Component: This axis isn’t ordered exactly, it just presents a nice way of categorizing and ordering atomic services necessary to serve core business use cases. It is roughly sorted by number of links used to different types of servers from the web cient (Figure 1 far right) point of view. You can also imagine how other technologies might fit into this picture.Web client: Any device using a telematics portal such as my.geotab.com.
- Application server: Any telematics provider’s main business-logic server.
- Persistent storage server: Long-term storage service server.
- Device data gathering server: Massively write-scalable servers able to receive data from all telematics devices in use.
- Geospatial server: Server that provides geospatial services, such as posted road speed, coordinate to address conversion, etc.
Abstraction scale: this axis shows all logical levels of technology driving each particular piece in the telematics system.External logical interfaces: The external interface of a technology. The data provided through the application programming interface(API) is an example. This level is public and subject to telematics users’ requirements.
- Software: The core logic that performs actions to satisfy the top level interface requirements. A telematics provider usually develops this and is internal from this level and lower.
- Dependent software interfaces: Pre-written, pre-supplied library software upon which the higher software level is based. An example of this is a browser API in the web client technology.
- Hardware: The nuts and bolts that the software controls. Anything from hard drives to network hardware.
The way to understand this technology map is to analyse a concrete example. An example of a business use case is determining the history of trips for a particular device. Here is a possible corresponding map of the input information flow:
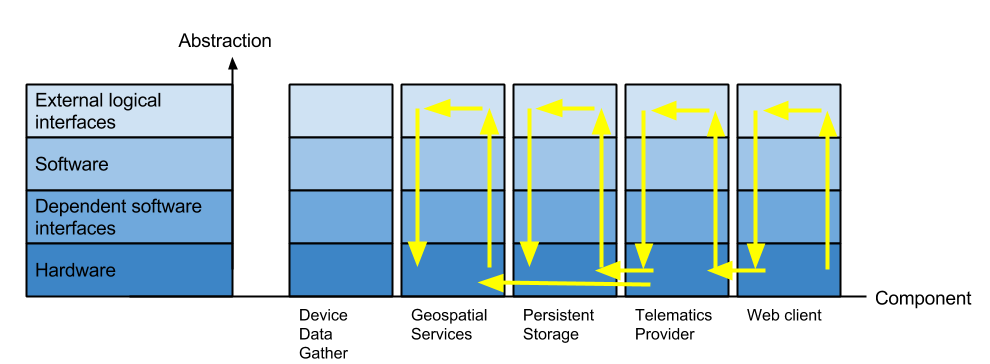
Let’s see what the input process for a trips history report is in detail:
- The user is using an iPhone to click on a “Trips History” button while browsing a telematics portal such as my.geotab.com.
- Finger touches screen.
- Hardware records a change in screen conductivity where the screen was pressed.
- Software from the phone manufacturer polls the hardware and detects a tap.
- Phone operating system software passes on the event to the currently active application, which is a browser.
- Telematics web client software is already loaded in the browser and determines that this tap means that the user intends to see a “Trips History” report.
- Commands are sent from the web client software to a standard socket software that deals with all the low-level details of making a request for a file over a network to the telematics provider.
- The telematics provider is listening for connections through similar software that abstracts away the details of networking. It receives the request from the web client.
- The telematics provider needs to make some decisions based on what is asked for, for example deciding if the person requesting this report has access to it, according to the stated policy at the top level. Also implements logic to transform the different arguments that can be sent with the request into actions that are to be performed.
- Assuming the telematics provider decides to provide a report, it must use its connection to the persistent storage layer to request the relevant data.
- The persistent storage layer receives the arguments of the request and instructs its driver to read the requested data from hard drive.
- The telematics provider may also need to reach out to the geospatial services server for enhancing the data. An example would be providing addresses for coordinates.
- The geospatial services server receives the request, and decides to do an in-memory lookup.
This very small business process example is only the input required to get a trips history report. The output process should follow a similar, reverse path. The timings of information flow is often an important detail. The technology map highlights a few useful tricks that can be used on a day where nothing is going right, in addition to covering the five Ws.
More question examples include:
- When did the problem appear first? An error search might satisfy this.
- What version of the software is being looked at?
- Define what the expectation is.
- What is the difference between expected output and actual output?
- What are the standards and APIs being working with?
- What are the processes that are involved in the current situation? Can the problem be isolated to just one process?
- What are the necessary steps that can make the problem appear in a small interference-free test account?
- What parts of the processes are visible? Some clues may be recoverable just by looking at the public or accessible parts of the technology stack. For example, browser developer tools is great for debugging web clients.
- What are the input and output paths through the technology stack that are taken by selected business processes?
- What other inputs pose similar issues?
Do you have additional tips and idea when it comes to fixing technical issues? If so, please leave your questions and comments in the box below.
Subscribe to get industry tips and insights
Geotab team
Table of Contents
Subscribe to get industry tips and insights
Related posts
.jpg)
Marketplace Spotlight: Redefining Fleet Security with Matrix iQ
July 15, 2026
2 minute read
AI readiness checklist for field service fleets: Is your data ready for AI?
July 6, 2026
1 minute read


How sanitation fleets can prevent return trips and reduce solid waste collection costs
June 15, 2026
3 minute read
.jpg)
Trailer telematics: How fleets track and manage trailers in real time
June 2, 2026
4 minute read