How to get the most out of your fleet EVs with MyGeotab
Tracking EV metrics in MyGeotab can help you pinpoint areas for improvement in terms of performance, range and ROI.
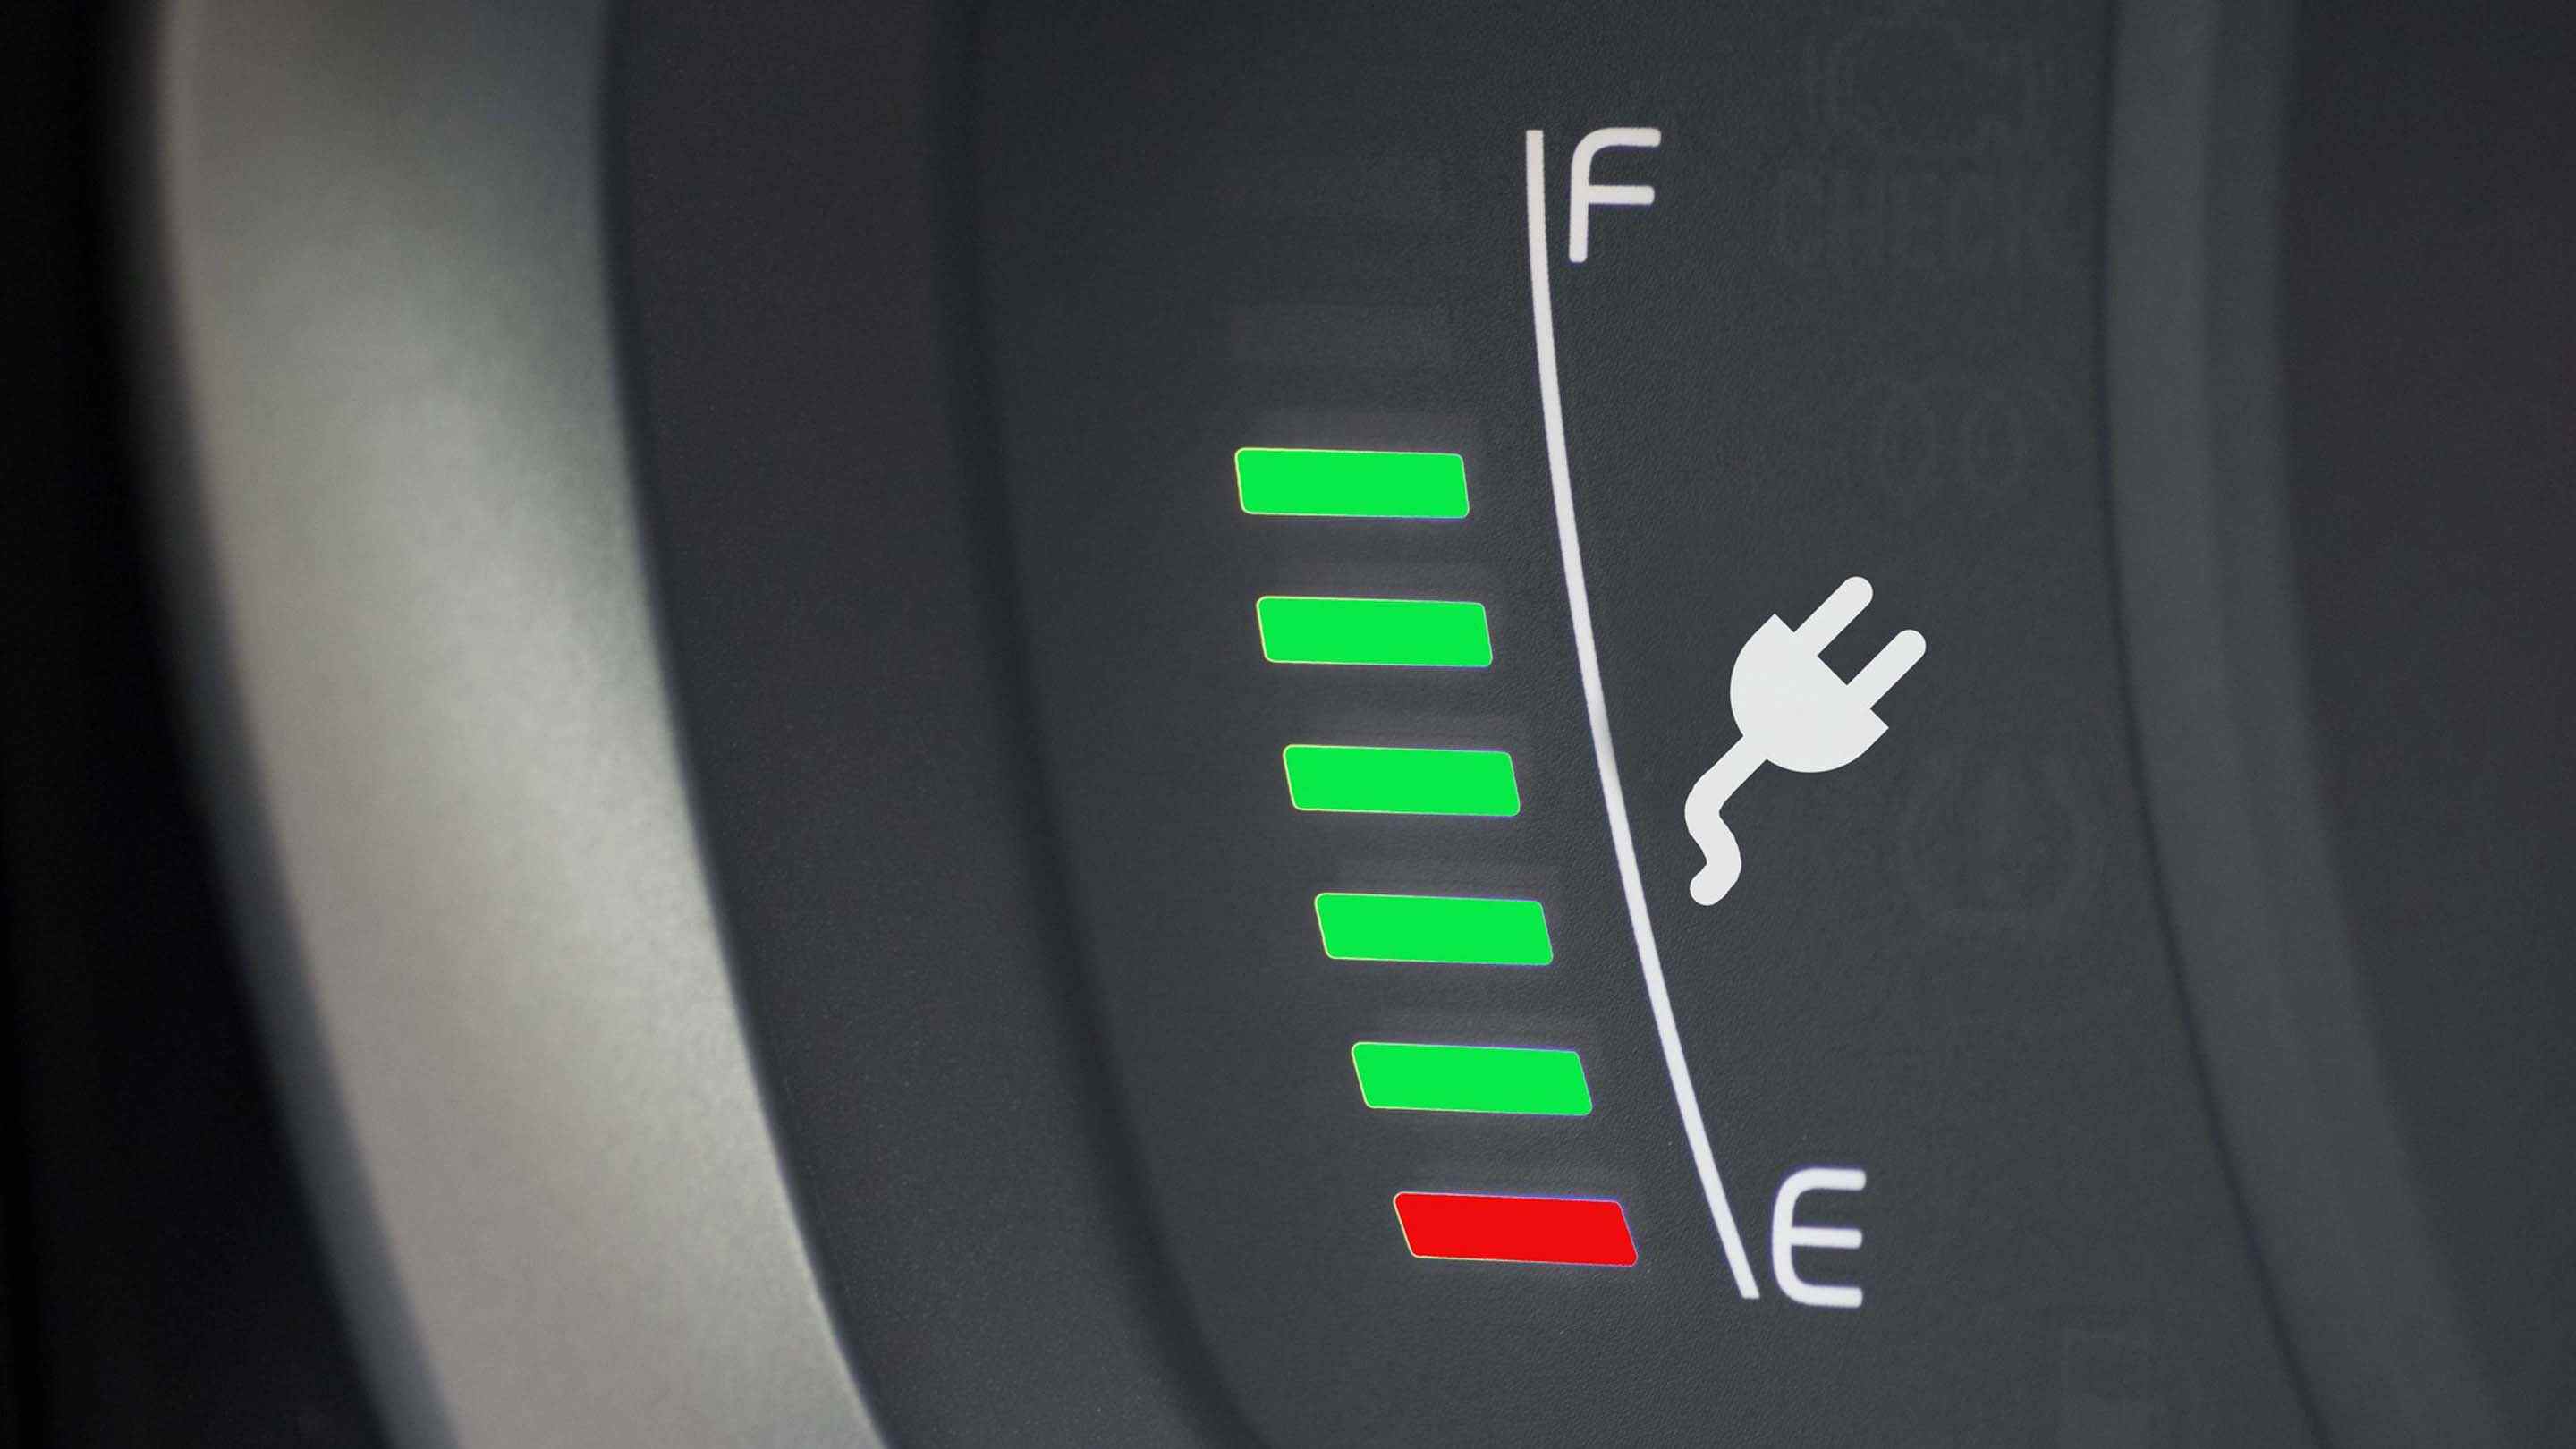
Once you have added EVs to your fleet, it is critical to monitor their performance to be sure they are delivering the best ROI, and working to support the fleet’s bigger goal of successful EV adoption. Monitoring your EVs will provide you with a complete picture of their performance, utilization and cost, so that you can manage them effectively. What are the key metrics you should be tracking, and how do you see that information in MyGeotab?
First things first, it is important to note that whether you’re looking to make your fleet 1% or 100% electric, you need to make certain that those vehicles are fully data supported by your fleet management system. EVs have unique metrics that need to be monitored in order to optimize their performance, range and return on investment. Geotab is committed to supporting new and in-demand vehicles and now supports over 300 EV models.
So now to the reporting capabilities. This post takes you step-by-step through setting up some of the most important EV monitoring metrics in MyGeotab.
See also: Podcast: Why choose electric vehicles?
MyGeotab reports for tracking EV metrics
The Fuel and EV Energy Usage report
In this report, you can see how your EVs are performing and get an understanding of the electric range that they’re typically achieving. You can use this data to compare actual range against each vehicle’s promised range, and see how your EVs are performing in relation to your conventional vehicles.
The Fuel and EV Energy Usage report displays the driving energy consumption for each of the vehicles in your fleet. This includes the energy used for propulsion, and also to power the auxiliary system, for heating and cooling and other functions. In the case of EVs, it also accounts for energy accrued while driving, through regenerative braking.
Because both fuel and electric energy usage are combined in this report, it displays energy usage for EVs, Plug-in Hybrid Vehicles (PHEV) and conventional fuel vehicles. MyGeotab defaults to show electric energy economy in MPG-e (miles per gallon equivalent), enabling direct comparison across the entire fleet.
If you’re running PHEVs, you likely have questions about how often they are getting plugged in to make sure you’re getting your ROI. This report will show if you’re maximizing the battery use of your PHEV, and will flag if any vehicles are being run exclusively on gas.
How to run the Fuel and EV Energy Usage report:
- To access the Fuel and EV Energy report, click on Engine and Maintenance in the left-hand menu.
- Select Fuel and EV Energy Usage from the dropdown menu.
- Select the date period that you want to report on, and the vehicles that you want to see data for. Finally, click Apply changes.
The default display measure for electric energy economy is MPG-e. You will also see the total amount of electric energy used during your selected date range in kWh. For PHEVs and gas vehicles, fuel economy is shown in MPG by default, and you will see the total fuel used during that period.
.png)
If you would like to view electric vehicle economy in a different measure to MPG-e, you can change this in your user options. Navigate to your user page in the top right-hand side of the screen and click Options.
You have a range of metric and imperial measures to choose from:
· L-e/100 km
· km/L-e
· kWh/100 km
· Wh/km
· km/kWh
· MPG-e (US) – default
· MPG-e (Imp)
· kWh/100 mi
· Wh/mi
· Mi/kWh
For PHEVs, you will see both the amount of fuel and electric energy used. If there is no data for electric energy used, then that vehicle has been run exclusively on gasoline for the selected time period.
EV Charging report
The EV Charging report provides information on the electric power and energy consumed when your EVs plug in to charge. The report shows exactly where, when and for how long those charging events occurred. Just as you would keep tabs on the number of fill-ups your vehicles are performing, this report gives you insight into your EV’s charging activity.
The report also enables you to see the starting and ending battery charge percentage for each charge. For building load management, the report will help you to understand the impact that your EV fleet has on overall facility load, and can contribute to calculating charging costs. Running charging reports by groups or departments can help you assign operating costs accordingly.
How to run the EV Charging report:
- In MyGeotab, click on the Engine and Maintenance module in your left-hand menu.
- Select Fuel and EV Energy Usage from the dropdown list.
- Toggle to EV Charging in the menu (beside Fill-ups) at the top of your screen to display charging activity for EVs. Select the date period and the vehicles that you would like to display in the report.
- Then click Apply Changes.
You will initially see the charging events displayed in a list. This shows the zone that the vehicle was charged in, the duration and location of the charging session, the battery charge percentage at the start and end of each charging event, the electric energy economy since the last charging session and the overall electric energy added.
.png)
By clicking on the map icon to the right of the screen, you can view each charging event’s exact location on a map.
Real-time charging activity
The map feature will show you in real-time who needs to charge, who is actively charging and who has the most and least battery charge percentage.
For dispatcher-controlled fleets, this feature is particularly useful to determine who is nearest to a certain location, and who has sufficient range to complete a job.
The map view also shows you which EVs are charging outside or inside a zone.
How to access real-time charging activity:
To use this feature, navigate to Map in the right-hand menu.
The list view on the left-hand side shows you the current battery charge of each EV, and indicates with a lightning bolt if any of those vehicles are actively charging.
.png)
This gives you an instant overview of who needs to charge their vehicle, and if vehicles have enough range to complete their routes or to take on additional work.
To determine which EVs are charged from least to most, click on the EV Charge filter.
EV rules and notifications
We know it’s difficult to keep your eye on the live map at all times so the MyGeotab platform offers the ability to create a number of customized reports using EV data diagnostics. This enables you to create and tailor reports and conditions to your fleet’s unique requirements whether it’s range concerns or reminders for your drivers to plug in at the end of a shift.
You can also minimize charging during peak rate hours, prioritize vehicle charging based on their charge status, free up a plug when an EV has reached sufficient charge, know exactly which EVs are fully charged and ready to go and much more.
Electric vehicle charging alerts
Establishing charge alerts by zone allows you to confirm that a vehicle plugs in once it enters a zone. This will help you to reduce the costs associated with vehicles not being able to complete a duty cycle due to insufficient charge.
How to create a Charging Alert for a Zone:
.png)
Select Rules & Groups from the left-hand menu, and then select Rules from the dropdown list.
- Inside the rules control, click Add at the top of your screen.
- Give it an appropriate name for easy reference, and then click on the Conditions tab at the top of the Exception Rule Edit module.
- From the Conditions tab, select Add Engine and then select the type Measurement or Data.
- Navigate to the Diagnostic field and locate the option Generic state of charge.
- Move to the value and select the percentage under charge that you wish to be notified at.
- Click the Add button, then select Add zone or zone type.
- Select the appropriate zone that your EVs report to at the end of the day and click Add.
.png)
To create or edit notifications for this rule, click on the Notifications tab at the top of the Exception Rule Edit module.
Here, you can set up all notifications that you need. You have the choice of creating emails, alerts, driver feedback and more. Remember to click Save in the top left-hand corner after you’ve set these up.
Summary
By following these simple step-by-step instructions, you can ensure that your EVs are always running optimally. And since Geotab currently collects data off the greatest number of makes and models of EV, you can rest assured that Geotab has your fleet covered when it comes to monitoring EV performance.
Watch the Geotab EV Performance video series on YouTube. For more information, check out the EV Reporting and Monitoring User Guide.
Subscribe to get industry tips and insights
The Geotab Team write about company news.
Table of Contents
Subscribe to get industry tips and insights
Related posts

The fleet safety incentive program checklist for driver engagement that lasts
June 19, 2025
2 minute read
Beat the Heat: Easy Ways to Maximize Your EV Range This Summer
June 19, 2025
2 minute read
Charlotte Argue: Breaking down cost barriers for electric fleets
June 5, 2025
4 minute read
.jpg)
Geotab’s new fleet Sustainability Center simplifies fuel and emissions reduction
March 3, 2025
3 minute read
How long do electric car batteries last? What analyzing 10,000 EVs tells us…
January 20, 2025
9 minute read