How long do electric car batteries last? The updated guide to real-world EV battery health
Analysis of over 22,700 electric vehicles, covering 21 different vehicle models, confirms that overall, modern EV batteries are robust and built to last beyond a typical vehicle’s service life.

Senior Manager, Sustainable Mobility at Geotab
Apr 28, 2026
Key Insights
- Average degradation rate: The average annual electric vehicle degradation rate is 2.3%.
- Power: High-power DC fast charging (>100kW) is the single largest stressor, leading to degradation rates up to twice that of the low power charging group (3.0% vs 1.5% per year).
- Climate: Hot climates impose a penalty on battery life, with vehicles operating in hot conditions degrading 0.4% faster per year than those in mild climates.
- Utilization: The increase in degradation from high daily use is a measurable but worthwhile trade-off for the gains in fleet productivity and ROI.
- State of charge (SOC): For most EV use, there's no need to worry about avoiding fully charging or emptying the battery. Degradation only speeds up when vehicles spend over 80% of their total time at or near-full or nearly empty charge levels.
How long will my electric vehicle battery really last? It’s a key question for anyone considering an EV. Battery degradation, or the gradual decline in a battery's ability to store energy, affects your driving range, performance and the vehicle’s resale value. To support innovation and build fleet confidence in electric vehicle technology, Geotab has conducted several extensive studies using real-world telematics data (data collected from the vehicles themselves) to see how quickly EV batteries degrade.
Our 2025 analysis of over 22,700 electric vehicles, covering 21 different vehicle models, confirms that overall, modern EV batteries are robust and built to last beyond a typical vehicle’s service life. However, this latest dataset, which includes newer EV generations and a growing reliance on high-speed charging, highlights the variability across vehicles and how certain operating conditions can have a big impact. While some battery degradation is inevitable, fleet managers can make some adjustments to get the most life out of their batteries and their investment.
Battery degradation trends: Comparing past analyses
Geotab’s first big study in 2020 on light-duty electric vehicles showed an average battery degradation rate of 2.3% per year. By 2023, further analyses showed an improvement, with 11 common EV models averaging only 1.8% degradation annually (likely due to advancements in battery technology and thermal management systems).
When we expanded the study in 2025, the average capacity loss had returned to 2.3% per year across the 21 make-models. This means the average battery is projected to have 81.6% of its original capacity (state of health or SOH) after eight years.
This return to a 2.3% average doesn’t mean batteries are getting worse. It likely reflects a few combined factors related to newer vehicles and how they are being used, such as:
- Higher-power charging: The overall average is likely being influenced by the rise of higher-powered charging capabilities in newer EV models.
- Vehicle type and chemistry: Average degradation rate appears to vary significantly by model. Multi-purpose vehicles (MPVs) including light vans in our analysis average a higher rate (2.7% per year) compared to light cars (2.0% per year). Differences across vehicle models are likely driven by specific battery chemistries which are designed for different priorities such as maximizing range (energy density) or maximizing how long they last (longevity), as well as unique configurations in battery management systems.
- Initial drop-off: Many EVs show a sharper drop in capacity in the first year or two before the rate levels out. The current average includes a higher proportion of newer EVs. In contrast, eight out of 11 of the same established models from our 2023 data set have stabilized to an impressive 1.4% average degradation per year, demonstrating exceptional long-term SOH retention.
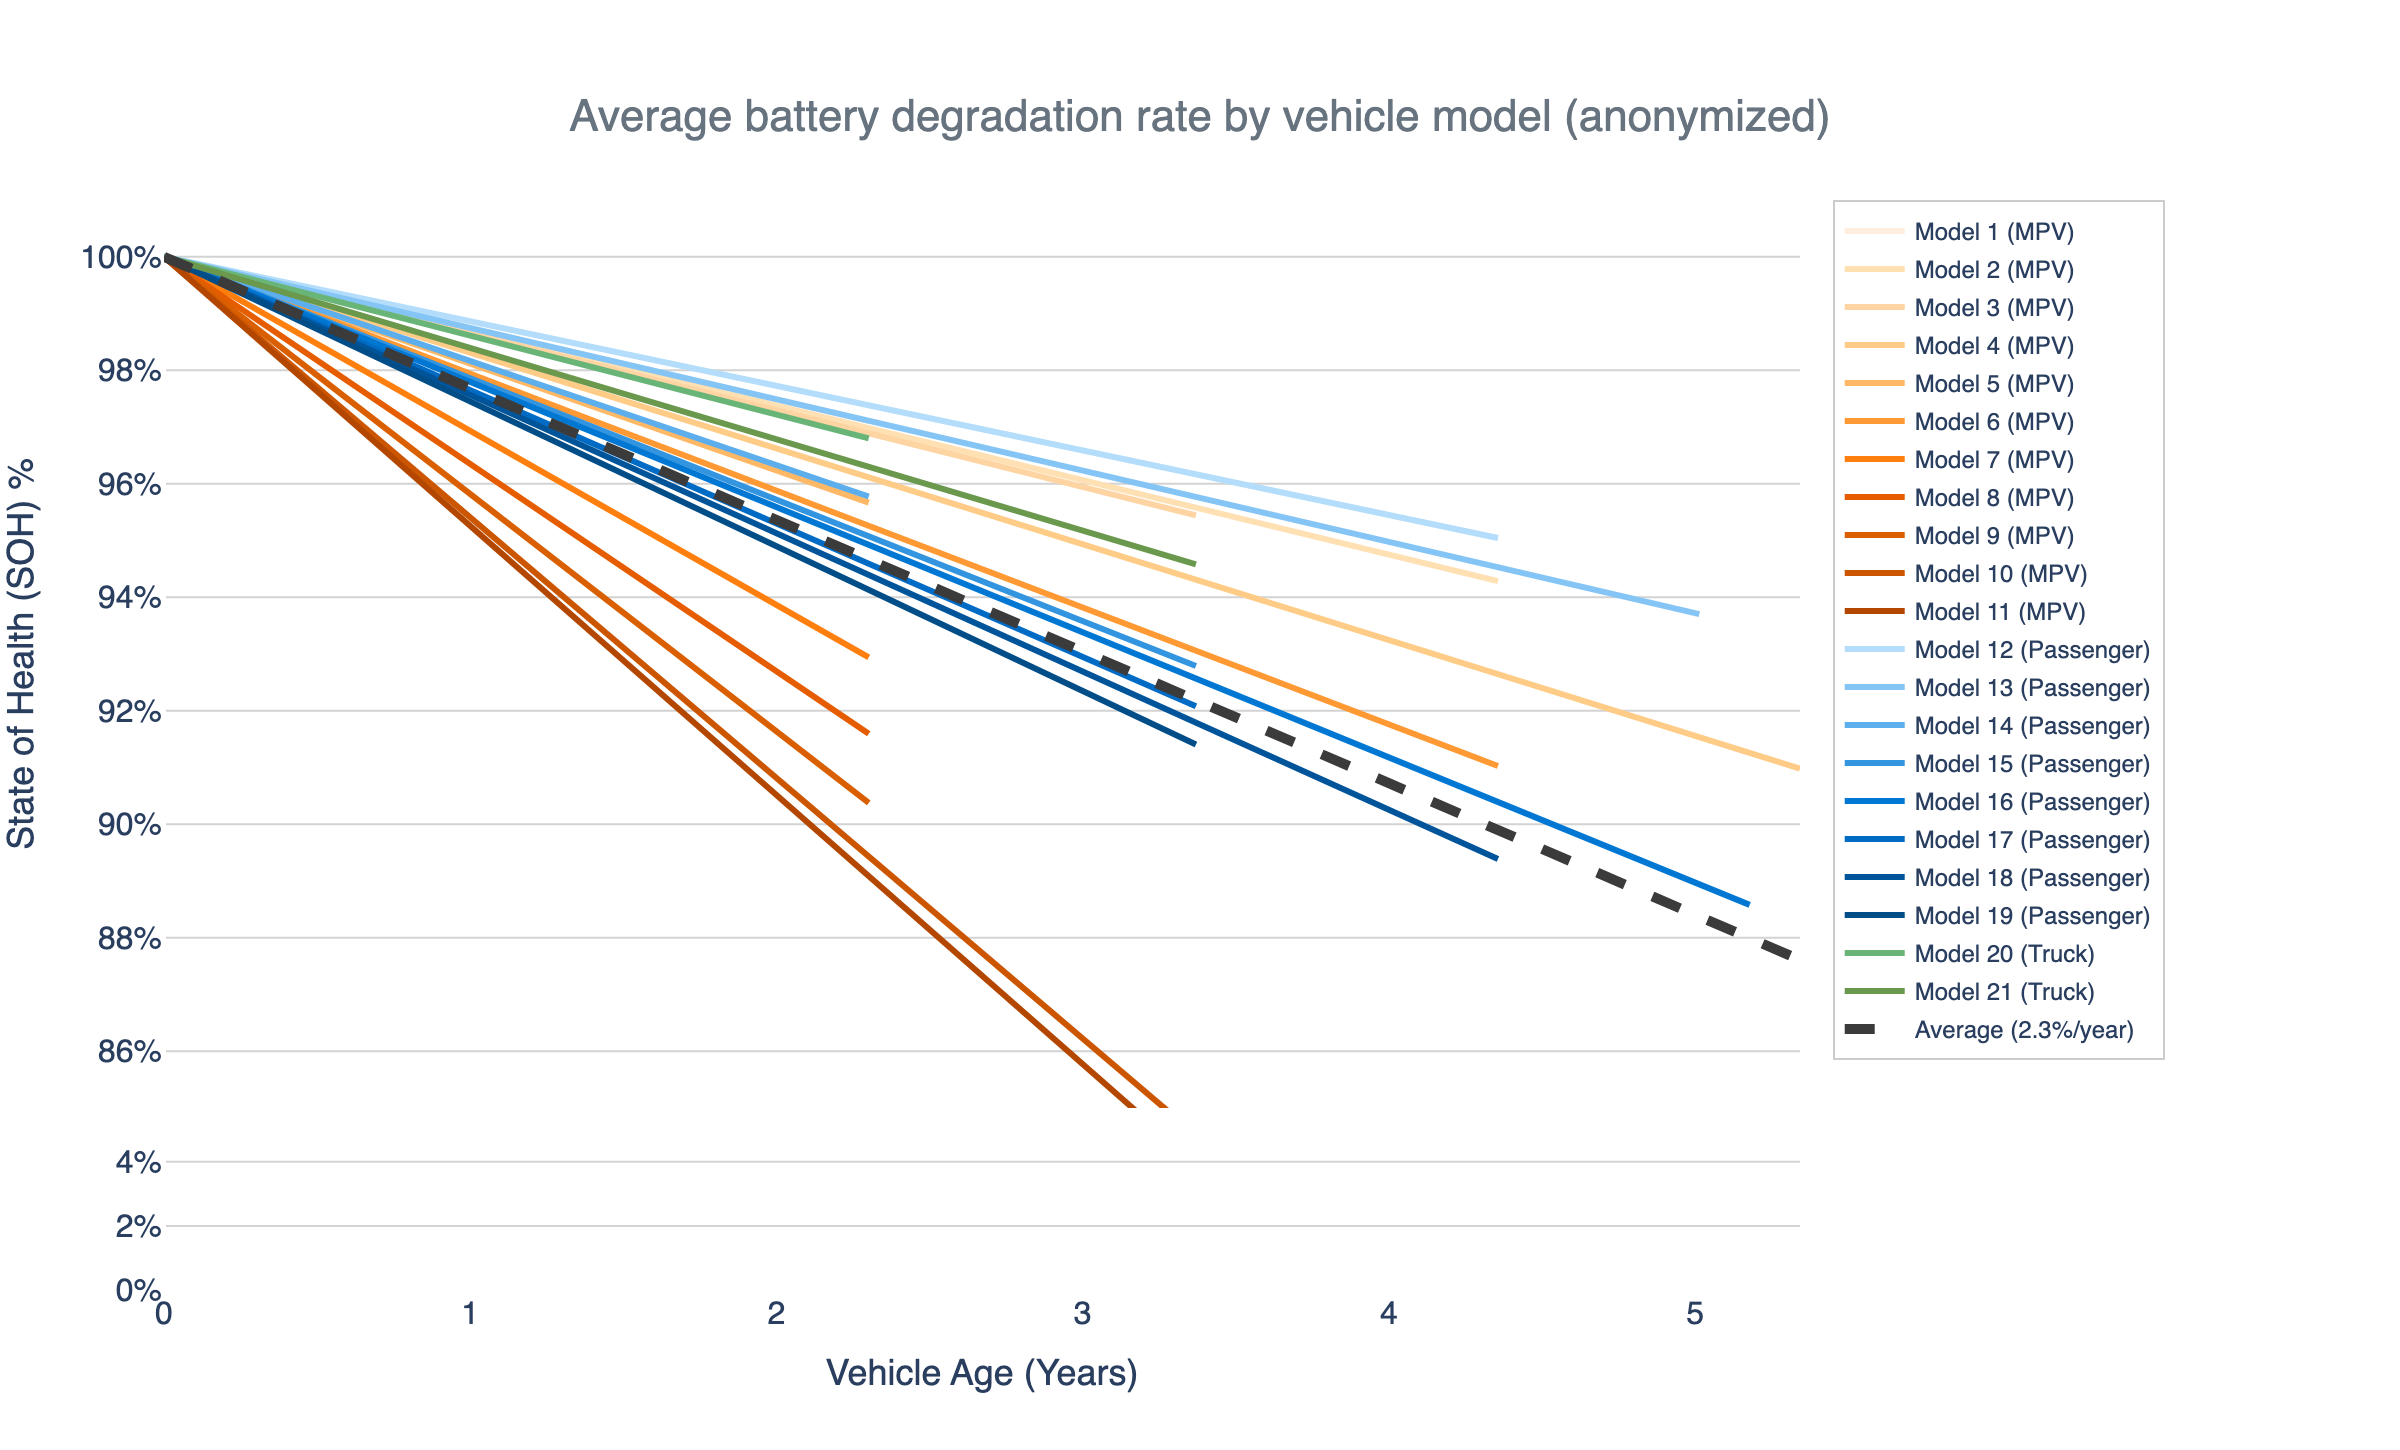
Figure 1: Average EV battery degradation rates, by vehicle model and class (multi-purpose vehicles such as vans, passenger cars and trucks). Models have been anonymized.
While inherent design influences battery health across vehicle models, the vehicle’s operating conditions have an impact too. To better understand the role of external factors, we grouped vehicles into similar operational conditions, looking at power levels, local climate and usage.
Average degradation rates only tell part of the story.
How high-speed charging influences EV battery life
As electric vehicle technology advances, we’re seeing more powerful and faster charging capabilities. While faster, higher-power charging can improve vehicle productivity, it’s important to ask: How does this extra power affect the battery’s long-term health? Our analysis shows that both the frequency and the power level of direct current fast charging (DCFC) influence how quickly the battery degrades.
The impact of DC fast charging usage
To see how DC fast charging (DCFC) matters, we split the vehicles into two groups based on how often they used DCFC as a portion of all charging sessions (AC and DC):
- Low DCFC frequency: Vehicles where DCFC constituted less than 12% of total charging sessions experienced an average annual degradation of 1.5%.
- High DCFC frequency: Vehicles that exceeded 12% DCFC usage saw a full percent increase in average annual degradation of 2.5%.
The results confirm: if you use DC fast charging more often, your battery will lose capacity faster, on average.
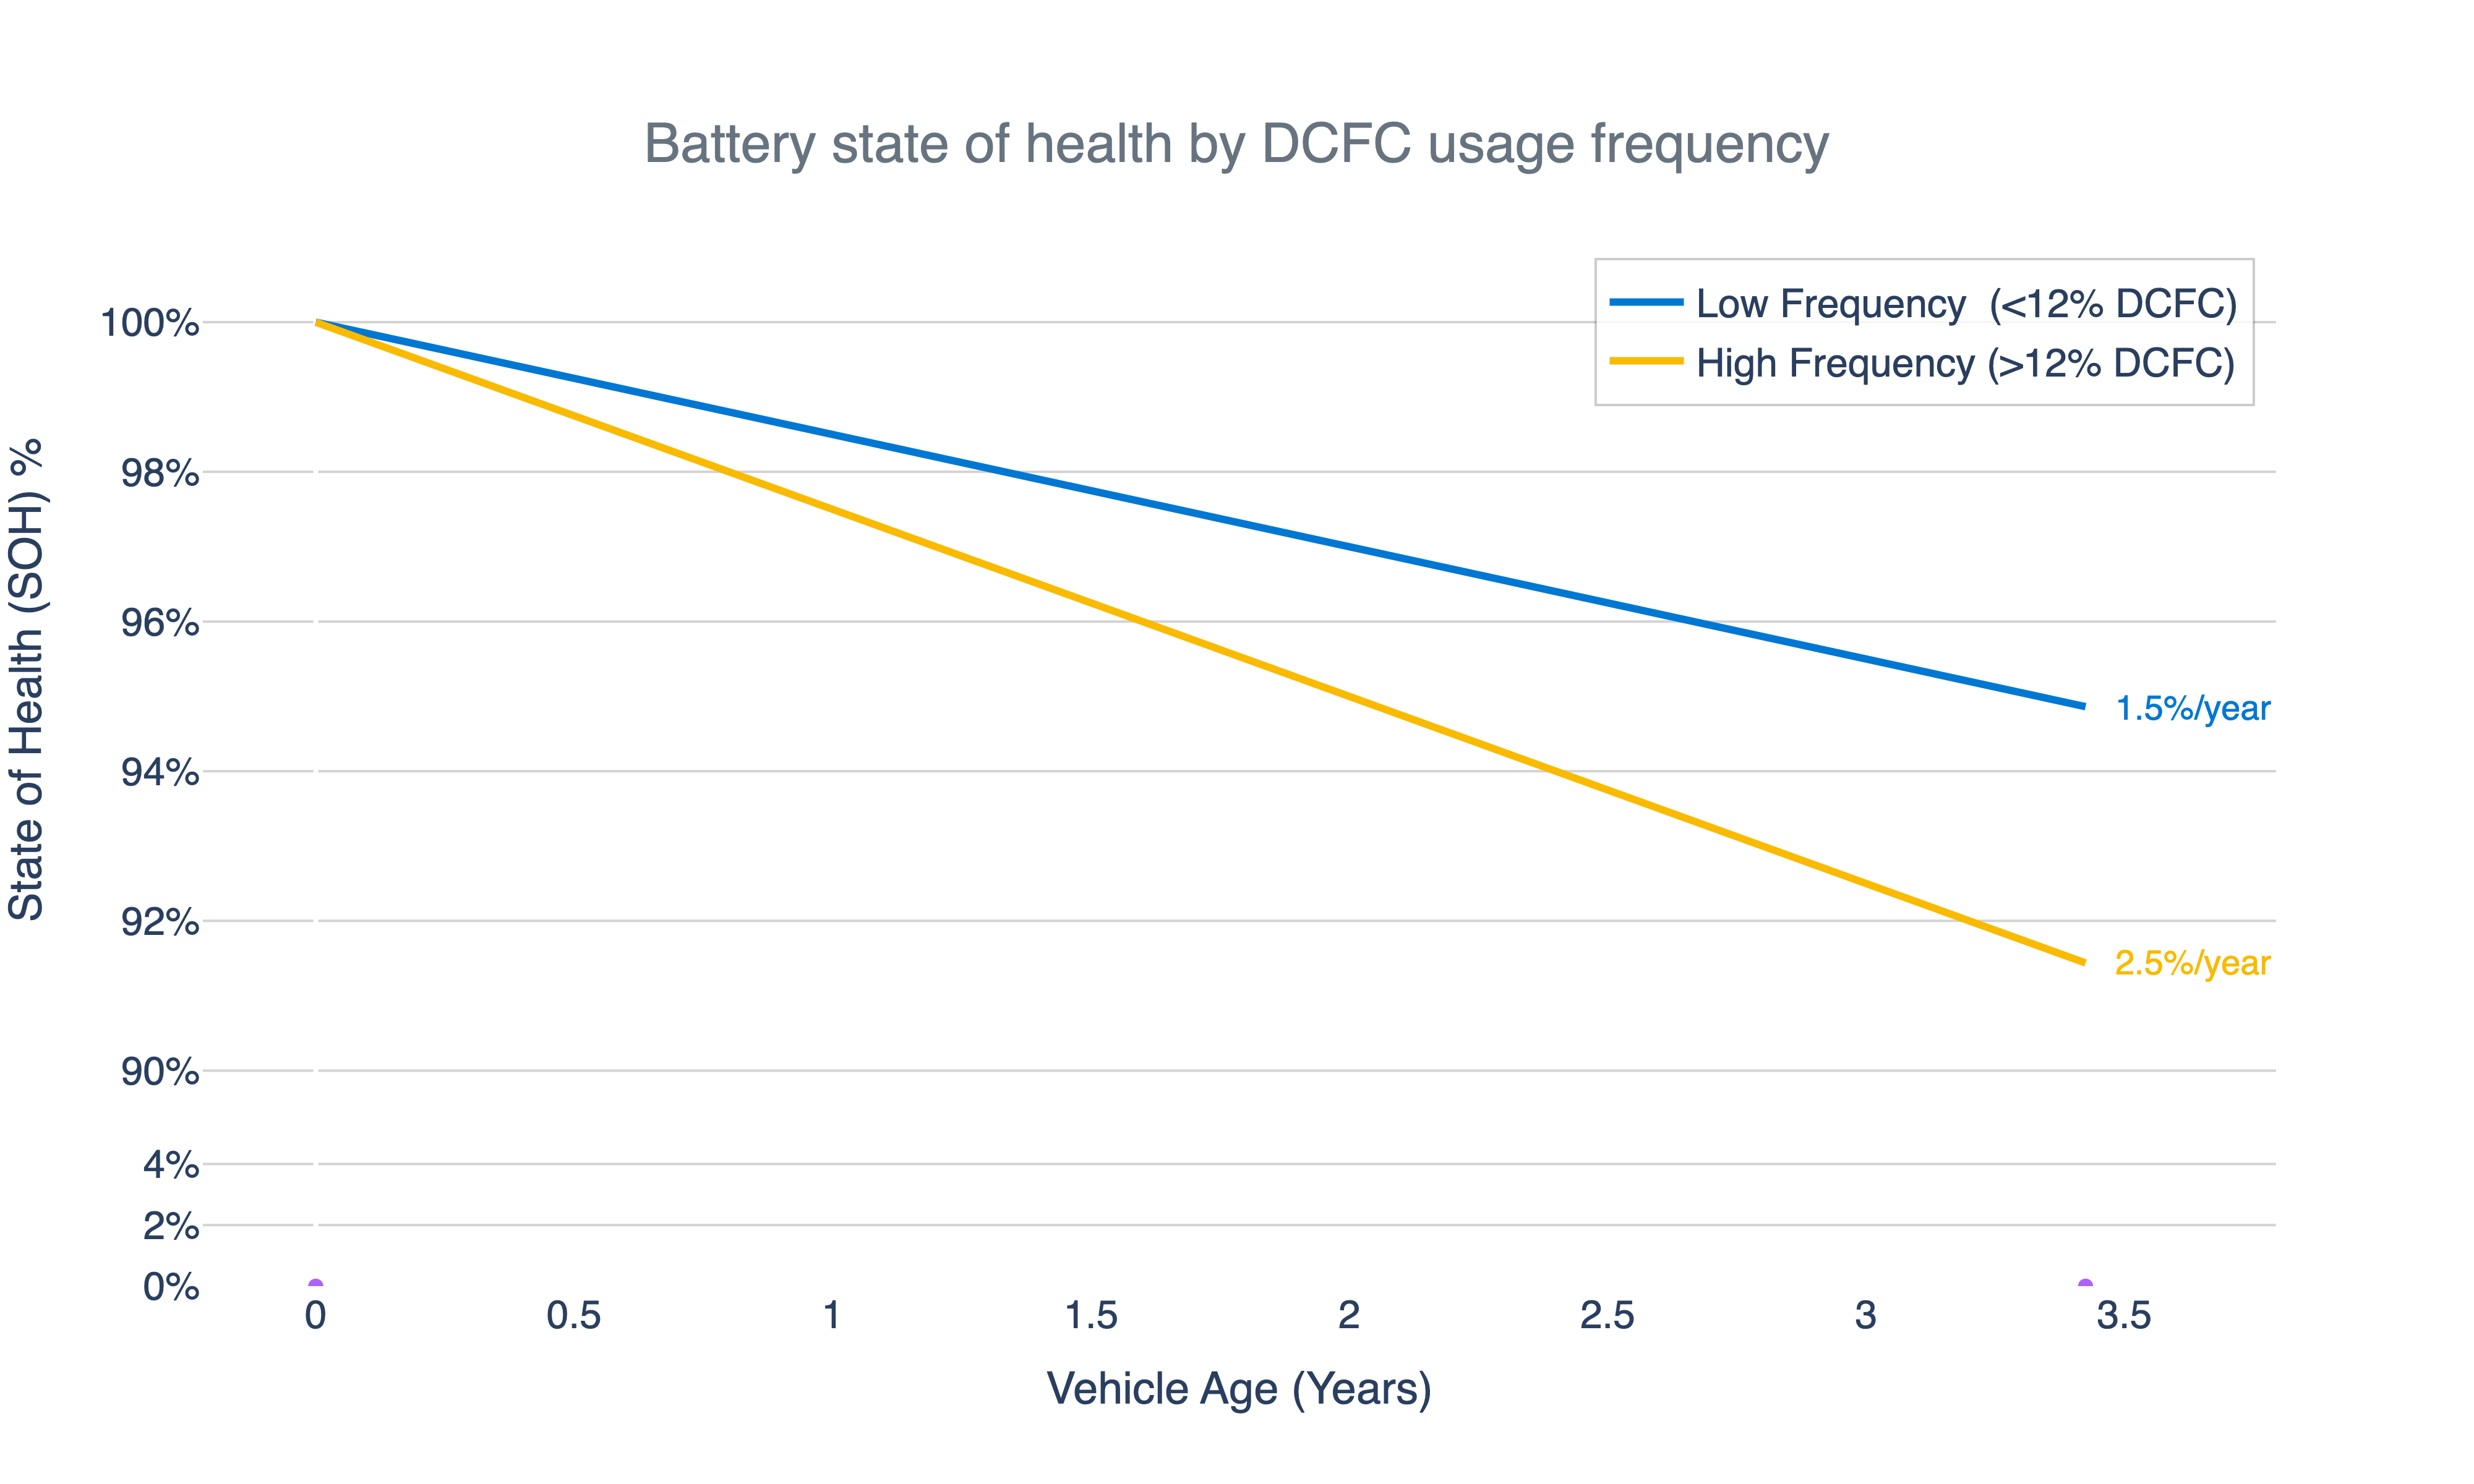
Figure 2: Chart depicts the average degradation rate of vehicles based on how much they relied on DCFC charging, defined by low = under 12% DCFC usage and high = over 12% DCFC usage
Does charging power matter?
Frequency is only half the story; we must also consider the “punch” the battery receives during those sessions. To investigate whether the power level matters independently of just DCFC frequency, we grouped the high-frequency DCFC users into two buckets: Low-Power, where less than 40% of DCFC sessions exceeded 100kW, and High-Power, where more than 40% of DCFC sessions exceeded 100kW. This results in three defined groups:
| DCFC Group | DCFC Usage Criteria | High Power Sessions (>100 kW) | Average Degradation (per year) |
| Low Frequency | Less than 12% of sessions | N/A | 1.5% |
| High-Frequency Low-Power | More than 12% of sessions | Less than 40% of DCFC sessions | 2.2% |
| High-Frequency High-Power | More than 12% of sessions | Over 40% of DCFC sessions | 3.0% |
These results demonstrate a clear benefit for vehicles that predominantly use lower power charging, which are projected to still have 88% of their original battery capacity after eight years (1.5% annual degradation). In contrast, vehicles that frequently use both high-power and high-frequency DCFC are projected to have a battery capacity of 76% after eight years (3.0% annual degradation).
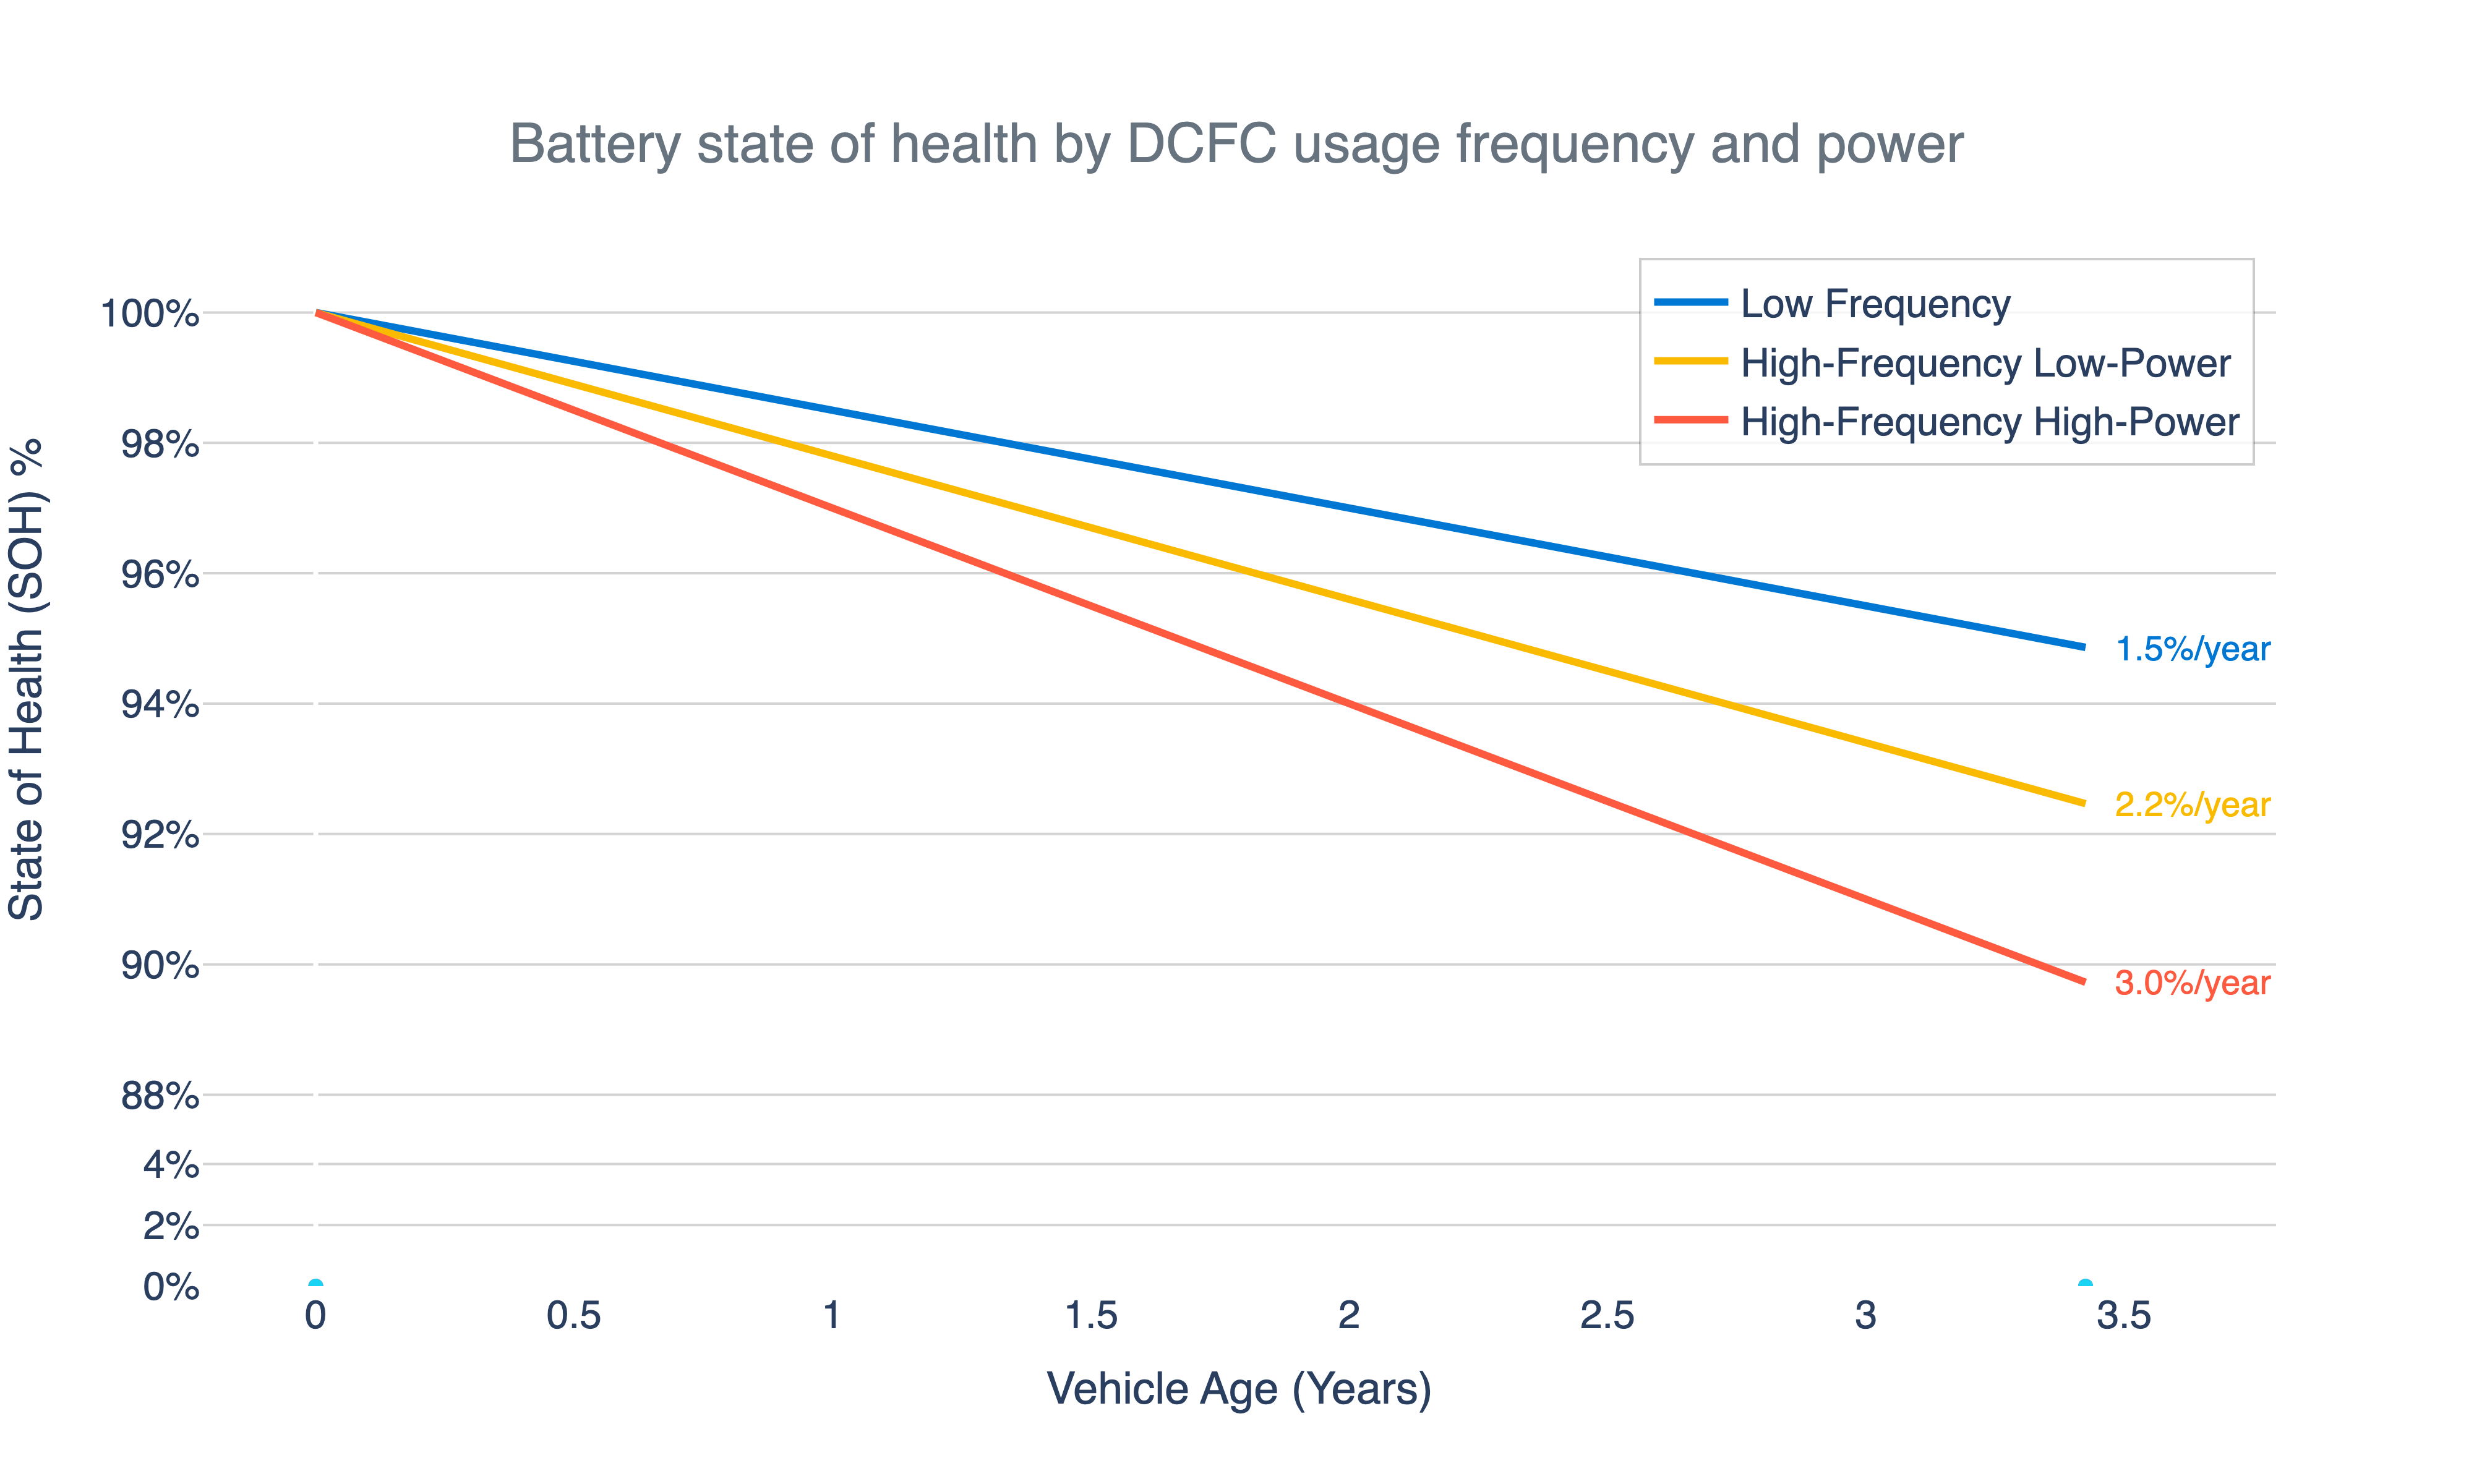
Figure 3: The average degradation rate of vehicles by frequency and power of DCFC usage, defined by Low Frequency = under 12% DCFC usage; High-Frequency Low-Power = over 12% DCFC usage, <40% 100+kW; High-Frequency High-Power = over 12% DCFC usage, >40% 100+kW.
The shift: Adapting to a high-power landscape
Across our customer base, reliance on high-speed DC fast charging has nearly tripled, jumping from less than 10% to about 25% of all charging sessions. Furthermore, the average power of these sessions has increased from roughly 70 kW to over 90 kW.
Note: The fluctuations seen in 2020 were largely driven by the high concentration of Tesla models and their early adoption of the high-power Supercharger network. Since then, a broader range of vehicle models has entered the market with the capability to accept higher charging power rates.
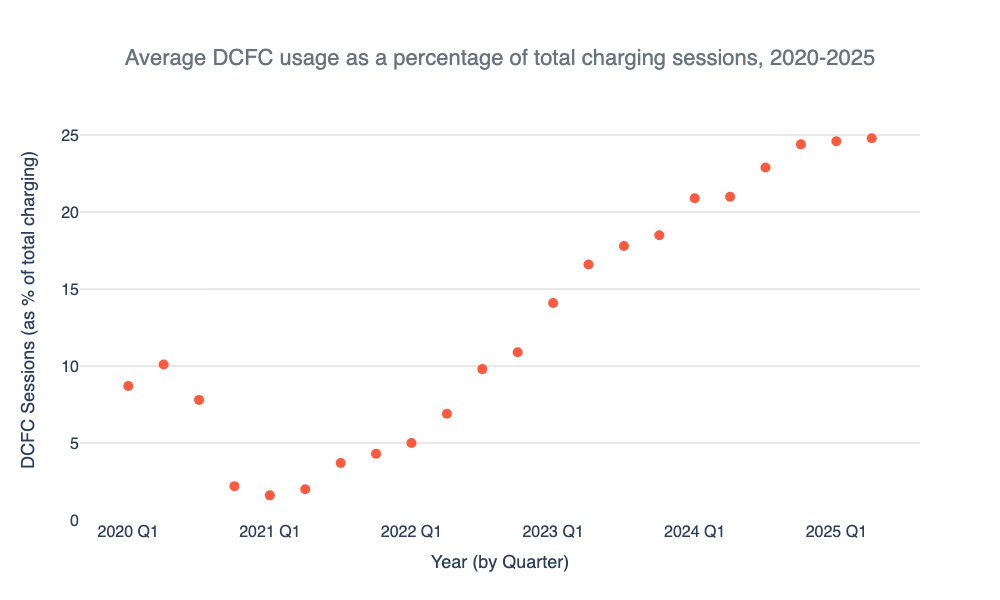
Figure 4: Average frequency of DCFC charging has increased steadily over the last five years.
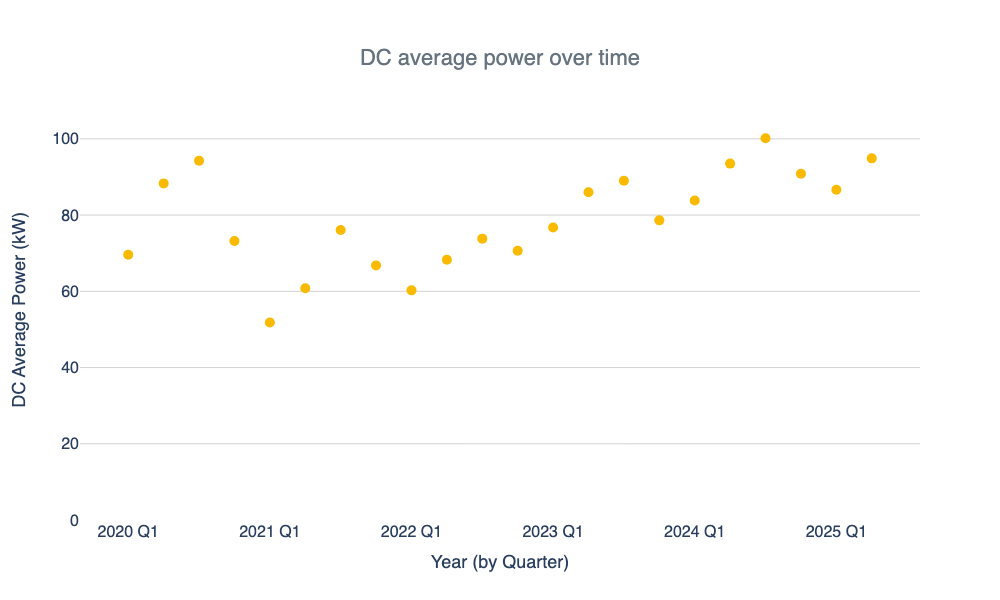
Figure 5: Average DCFC power (calculated by averaging the peak power for all DCFC charging sessions for every three months, or quarter) has increased over the last five years. This graph’s zig-zag nature showcases the seasonal changes in average peak power.
Strategic sizing: Matching the charger to the job
This trend highlights the importance of strategic sizing: carefully matching charging power to a vehicle's specific operational requirements. For the best long-term battery health, the best practice is to use the lowest power level that still meets your operational schedule.
For instance, if a vehicle is regularly parked overnight for five or more hours, installing infrastructure to fully charge it in 15 minutes may be overkill. By reserving high-power DCFC for essential needs rather than making it the default, you can significantly protect your long-term battery investment.
How does temperature impact battery degradation?
Temperature plays a significant role in why batteries degrade. EV batteries exposed to extreme heat degrade faster than those in cooler climates.
Hot temperatures
High temperatures naturally speed up battery degradation because heat increases chemical activity and stress inside the cell. Fortunately, EVs’ internal battery management systems help lessen this effect by regulating the battery temperatures.
To assess the impact of climate, we grouped vehicles based on the percentage of days exceeding 25° C:
- Mild climate group: Vehicles that experience less than 35% of days above 25° C.
- Hot climate group: Vehicles that experience more than 35% of days above 25° C.
The data confirms a moderate effect: vehicles operating in hot climates on average degrade 0.4% faster per year than those in mild climates. As a result, geographic location remains a key variable in predicting a battery’s lifespan. Our current dataset lacked sufficient “cold-only” samples – vehicles in consistently cold climates without a warm season – to isolate the impact of extreme cold on long-term degradation.
State of charge (SOC): Utilizing the full battery
EV owners are often advised to keep their battery charge (SOC) between 20% and 80% to avoid the chemical stress associated with a full or empty battery. However, our data indicates that this cautionary measure is only critical if the battery is habituated at these extremes for extended durations. For typical daily use, strict adherence to the 20-80% SOC rule may be unnecessary.
To measure the actual impact of charge levels, we analyzed how long vehicles spend at extreme SOC levels (below 20% or above 80%) across all states (driving, charging and rest). We categorized the vehicles into three groups:
- Low exposure (below 50% of total time at extreme SOC)
- Medium exposure (50%-80% of total time at extreme SOC)
- High exposure (above 80% of total time at extreme SOC)
Note on data controls: Our analysis observed an inverse relationship between DCFC frequency and extreme SOC exposure. Due to the "tapering effect", where DC charging speeds drop significantly after 80%, high-frequency DCFC users rarely spend prolonged time at maximum charge. Once controlling for this variable, we found that a distinct threshold exists for where SOC exposure begins to impact long-term health.
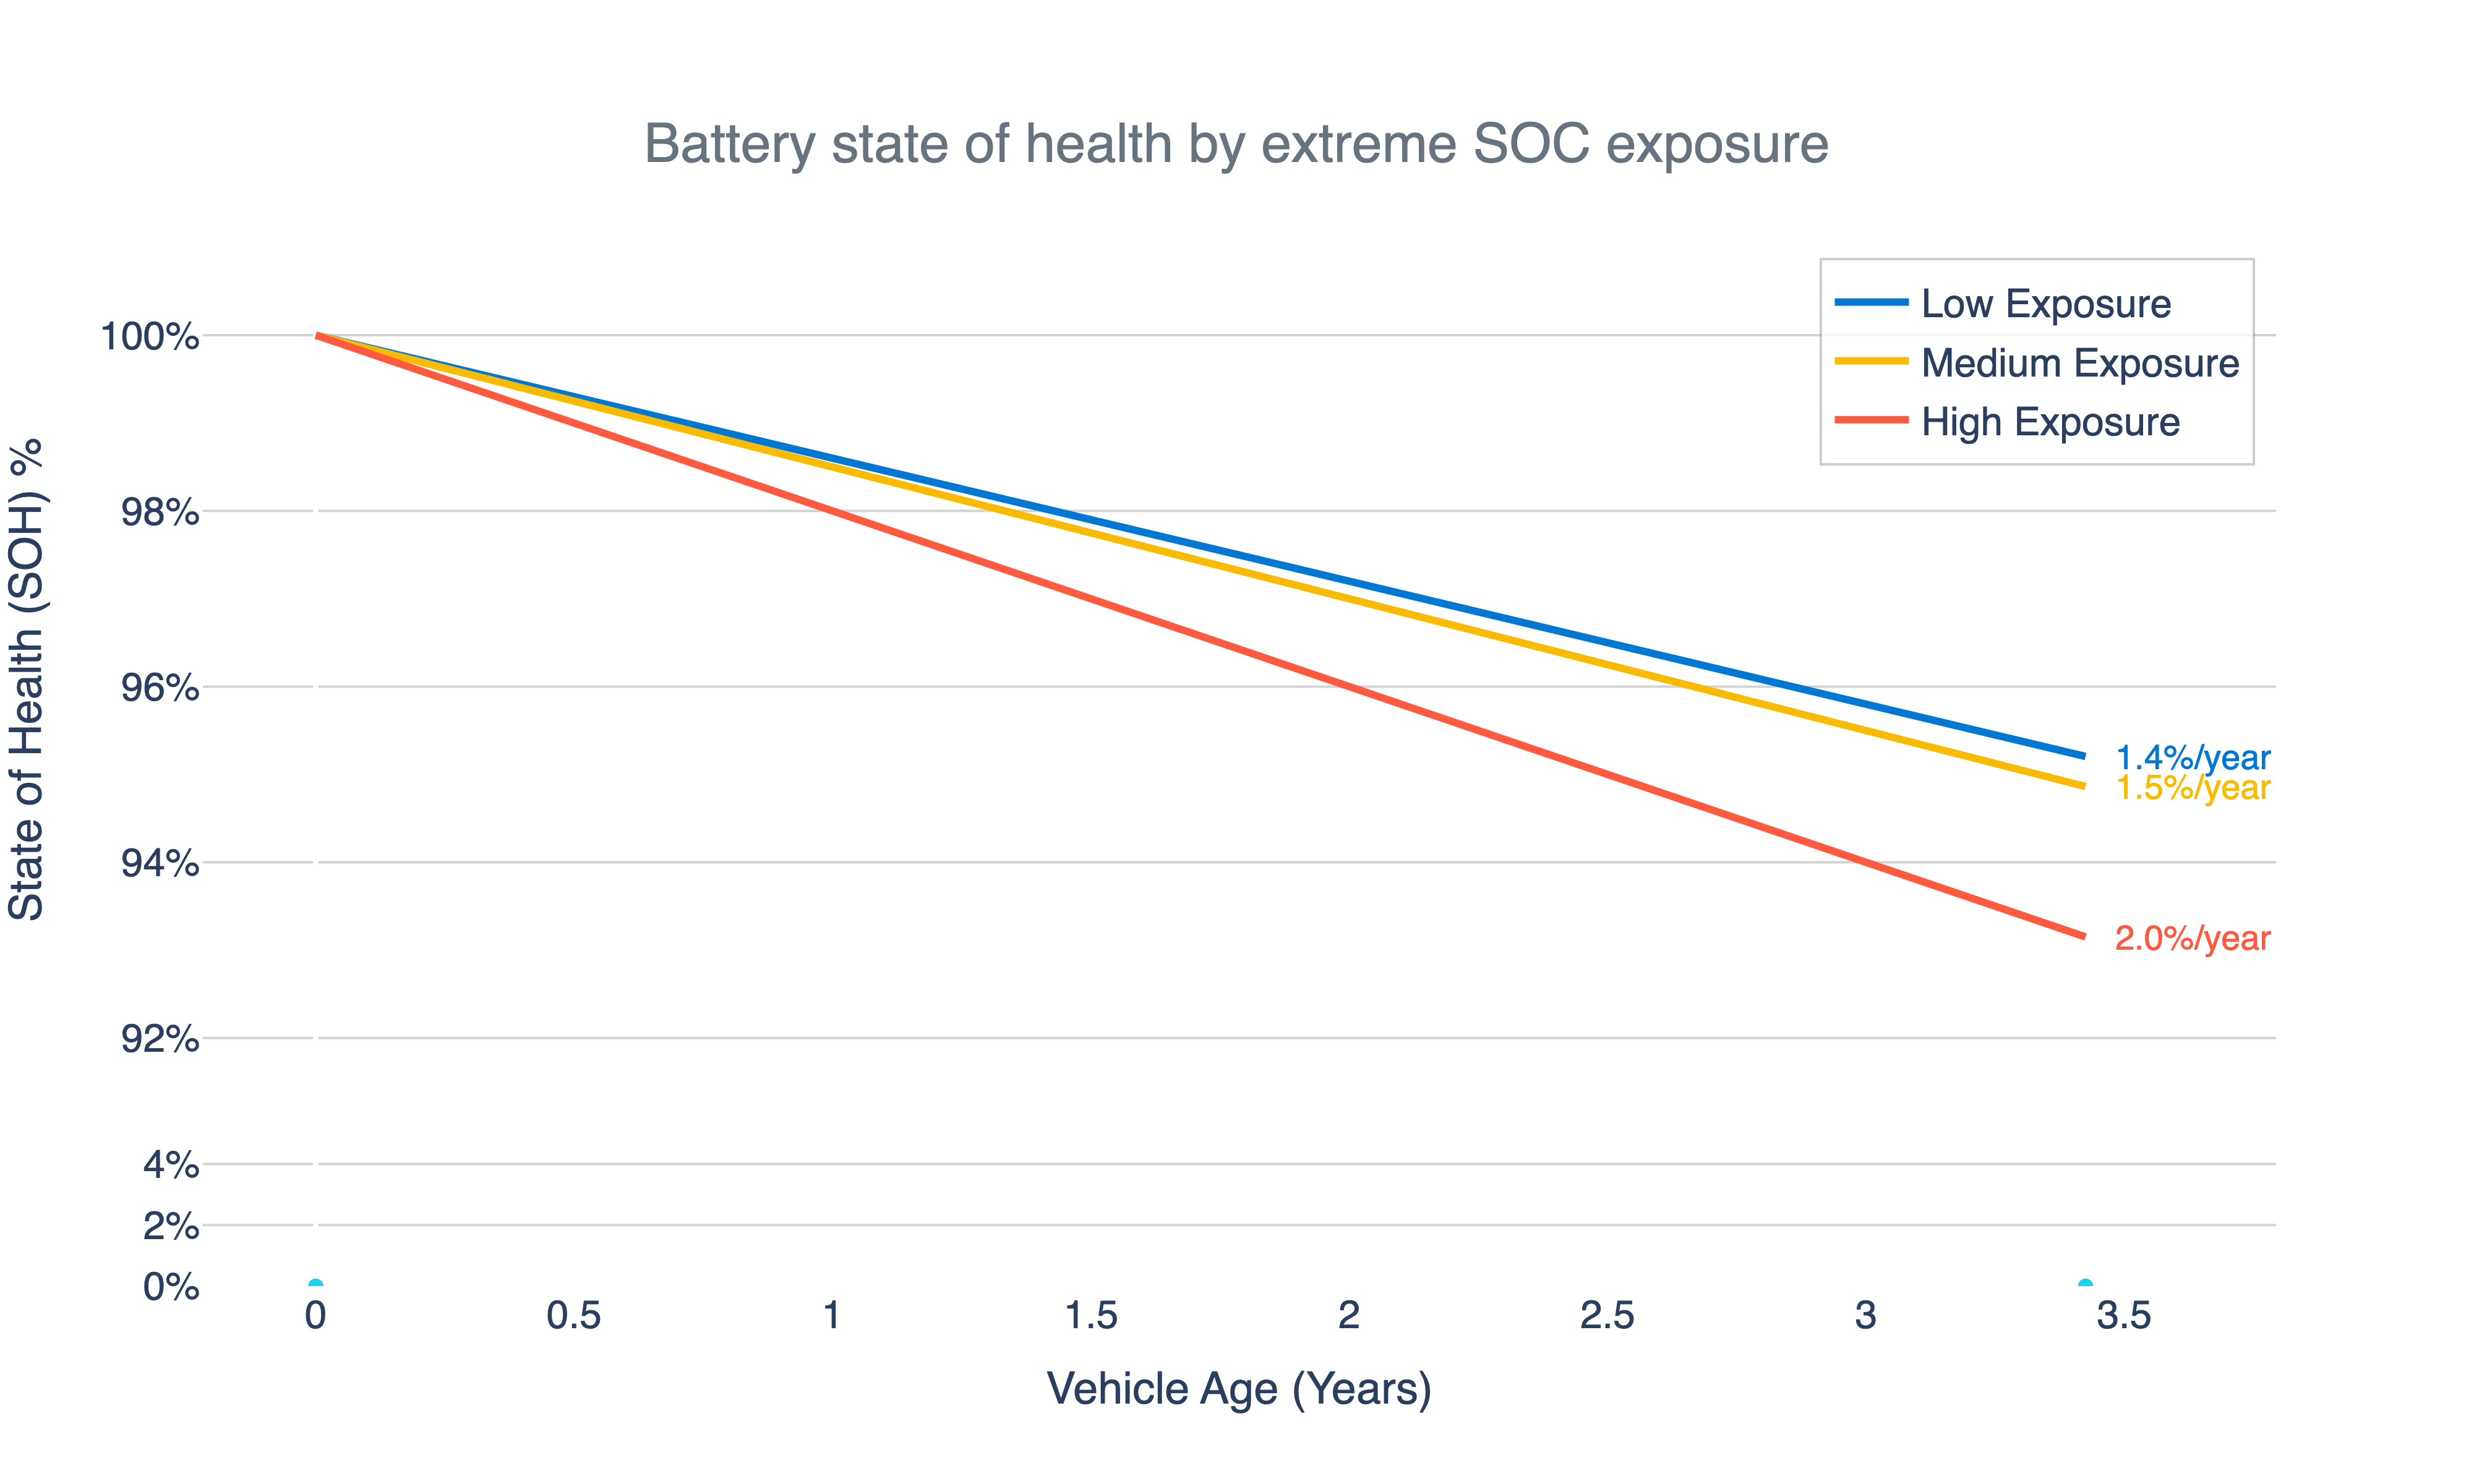
Figure 6: Exposure to extreme state of charge (SOC) is only significant under high exposure, where time above 80% SOC or below 20% SOC exceeds 80% of cumulative time. To control for power, this chart only includes vehicles with low DCFC usage.
The data demonstrates that moderate exposure to extreme SOC levels does not significantly accelerate degradation. The degradation rates for the low (1.4%) and medium (1.5%) groups are nearly the same.
However, there is a critical threshold at 80% exposure. Vehicles that habitually spent over 80% of their total time at extreme SOC levels experienced a significant acceleration in battery degradation, averaging 2.0% per year. This increase shows that battery degradation only accelerates when there is prolonged, habitual and extreme exposure to high or low states of charge.
Why moderate SOC exposure is safe
A key factor in mitigating SOC-related stress is the protective engineering implemented by auto and battery manufacturers. All modern EV batteries incorporate hidden software buffers at the upper and lower limits of the charge capacity. For instance, a battery indicating 100% SOC is chemically less than a full charge, and 0% does not represent a chemically empty state.
This engineering buffer likely explains the minimal impact observed from moderate SOC exposure in our analysis. The battery is designed to handle normal use across its entire charge range.
Prioritizing productivity: Utilization as a managed cost
Battery life is also influenced by throughput; how much energy moves through the cells overall. We measured this using the average charge cycle metric, which tracks how many “full” cycles a battery completes. One full cycle represents the cumulative discharge and replenishment of 100% of the battery’s usable capacity.
For example, if a vehicle uses 25% of its battery for a morning delivery and then charges that 25% back over lunch, it has completed one-quarter of a cycle. Repeating this four times equals one full cycle. We averaged this total over the course of a year to determine the daily intensity of use.
To analyze this impact, we categorized vehicles in three groups:
- Low charge cycle (<15%): The equivalent of a full cycle every 7+ days
- Medium charge cycle (15%-35%): The equivalent of a full cycle every 3-6 days
- High charge cycle (>35%): The equivalent of a full cycle every 1-2 days
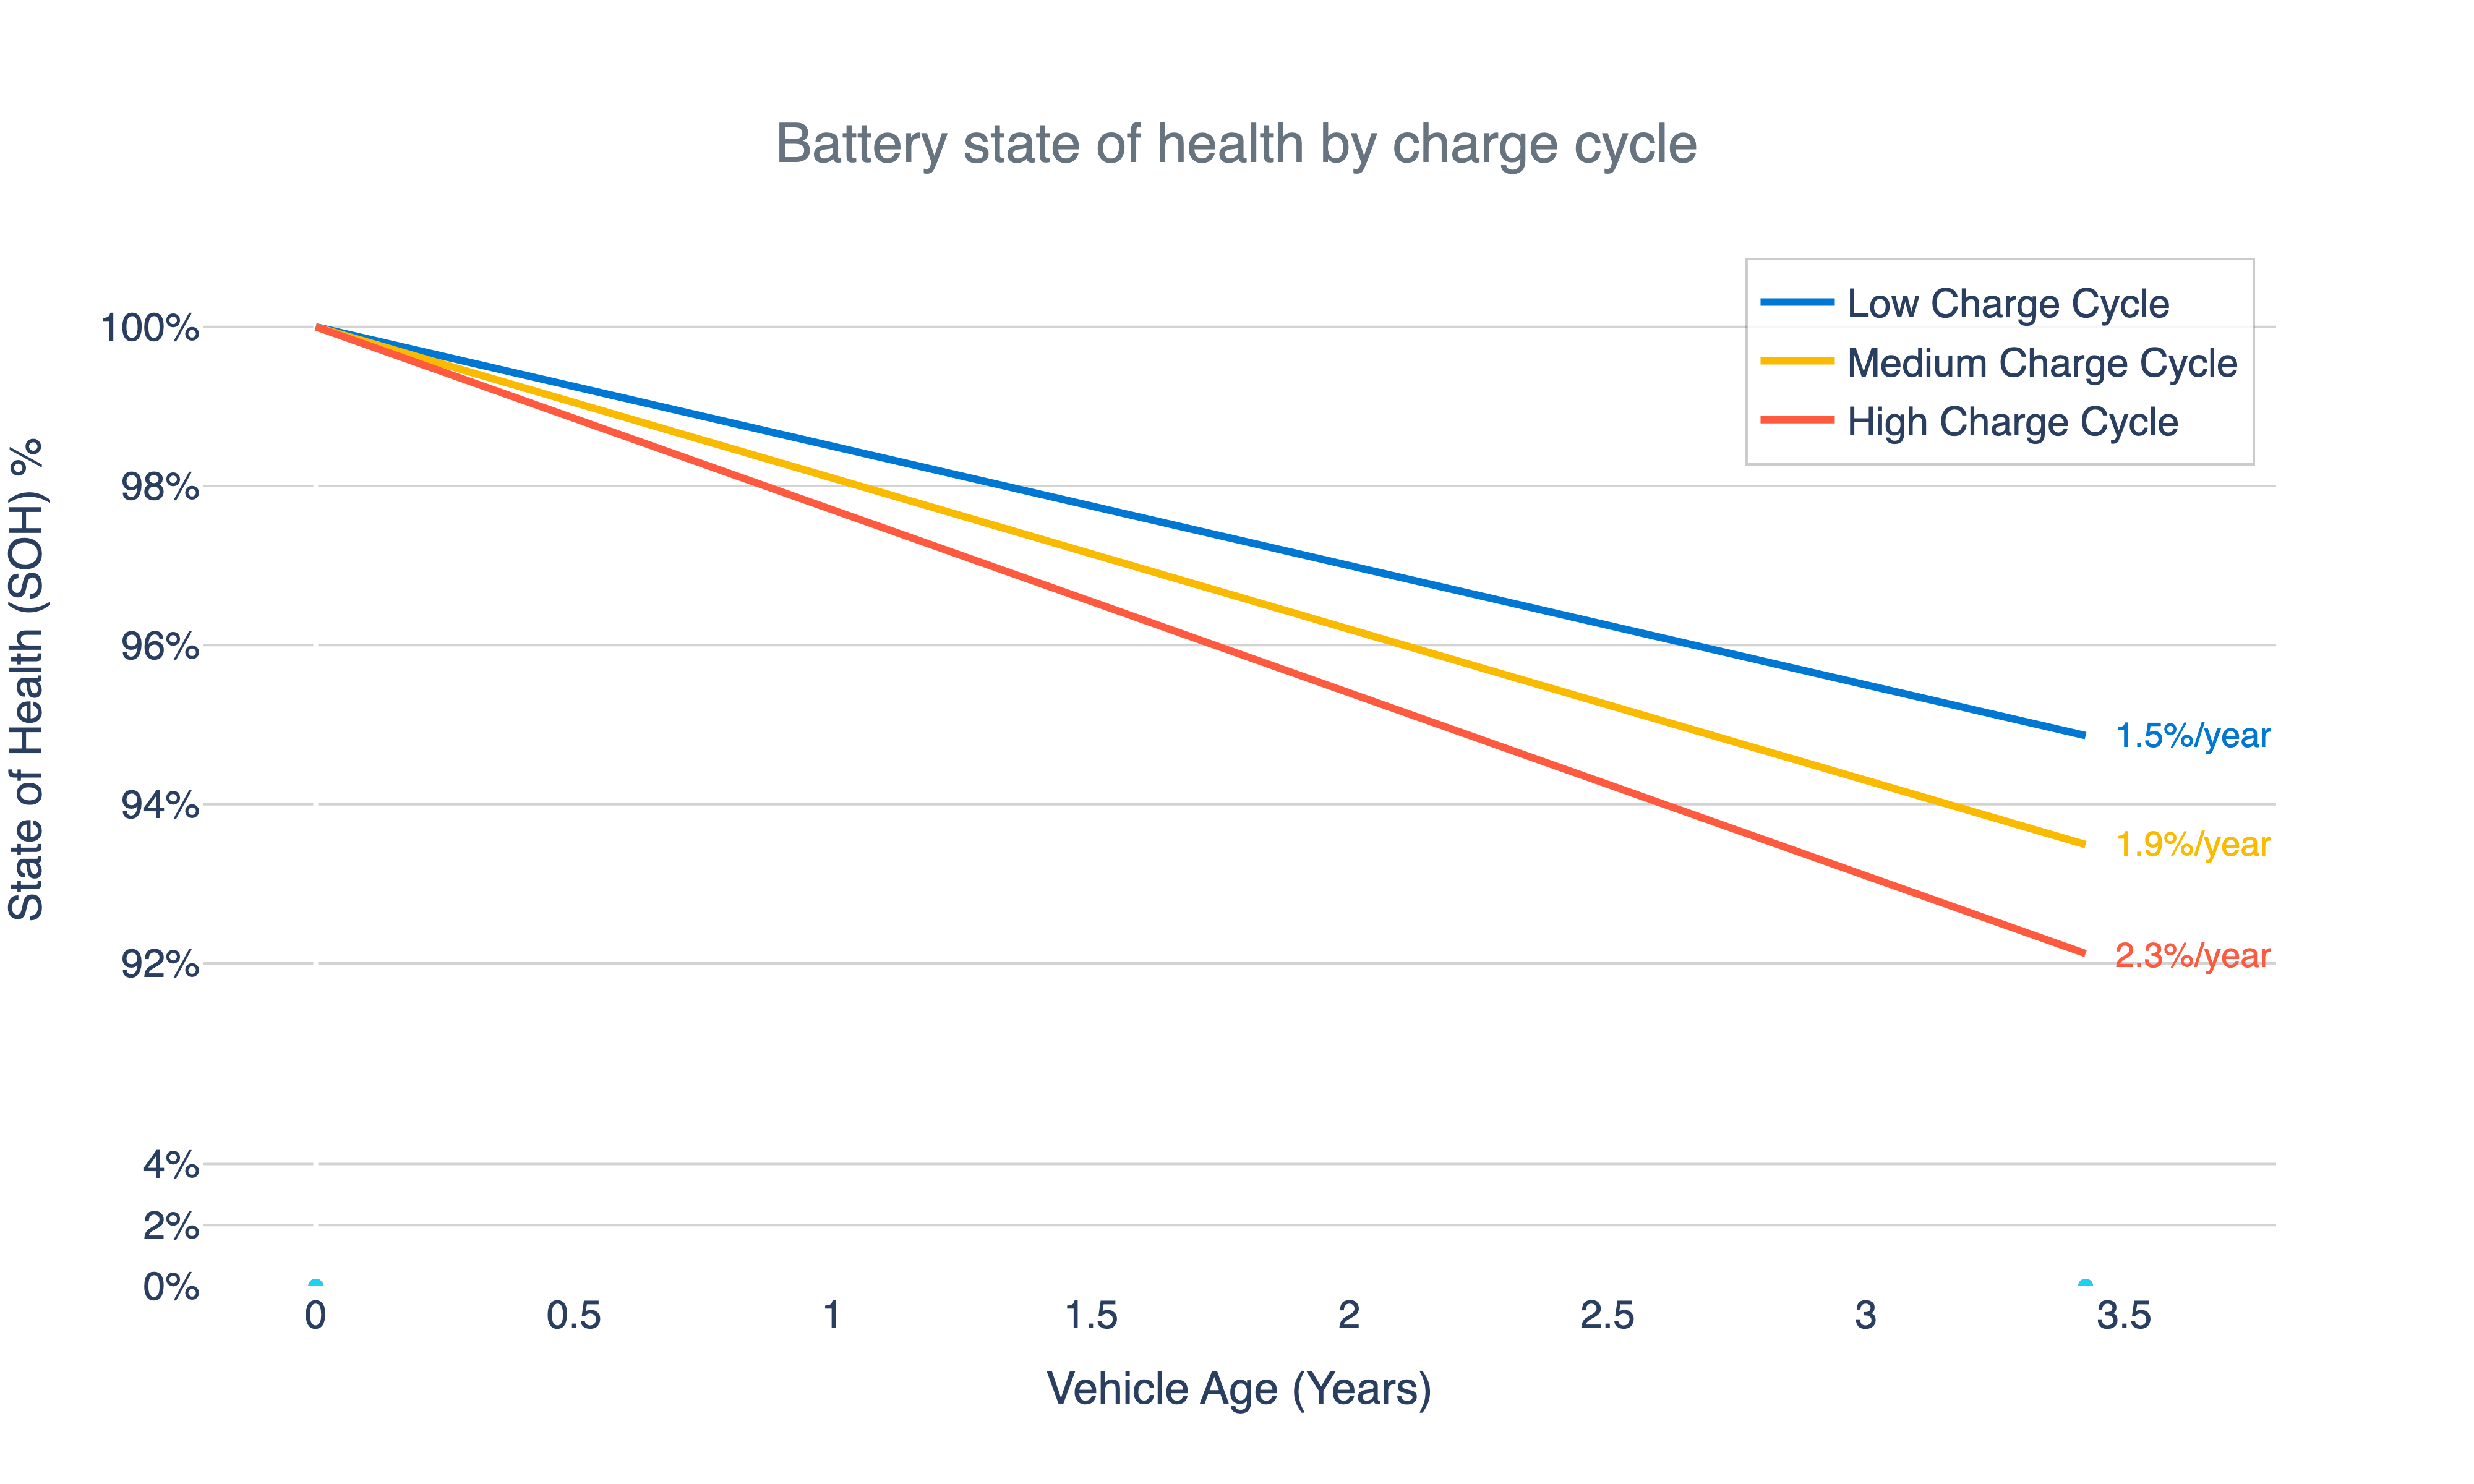
Figure 7: Battery state of health by charge cycle
The data confirms that operating intensity accelerates aging. As daily throughput climbs from low utilization (< 15% of a cycle) to high utilization (> 35% of a cycle), the average annual degradation penalty increases by 0.8% (rising from 1.5% to 2.3%). This reveals an unavoidable trade-off for fleets: higher daily productivity, essential for maximizing revenue and achieving a faster return on investment (ROI), comes at the cost of faster battery wear. However, this intensive utilization also maximizes the displacement of internal combustion fuels, saving on costs and directly advancing fleet sustainability and carbon reduction targets.
The long-term impact is arguably nominal when weighed against the benefits of maximized uptime: After eight years, low-use vehicles are projected to retain 88% state of health, while high-use vehicles still maintain a highly functional 81.6%.
The primary takeaway for fleet managers is clear: Operational strategies should prioritize vehicle deployment to meet both ROI and sustainability targets. However, managers must ensure that increased utilization doesn’t result in a disproportionate reliance on high power DCFC, which will drive additional capacity loss.
Design, chemistry and the limits of our data
While our analysis focuses on external factors (power, climate, battery level and usage), it’s important to remember that intrinsic factors like battery system design and composition can also influence degradation rates (and the impact of external stressors).
Intrinsic factors that impact battery longevity (but are not looked at in this study) include:
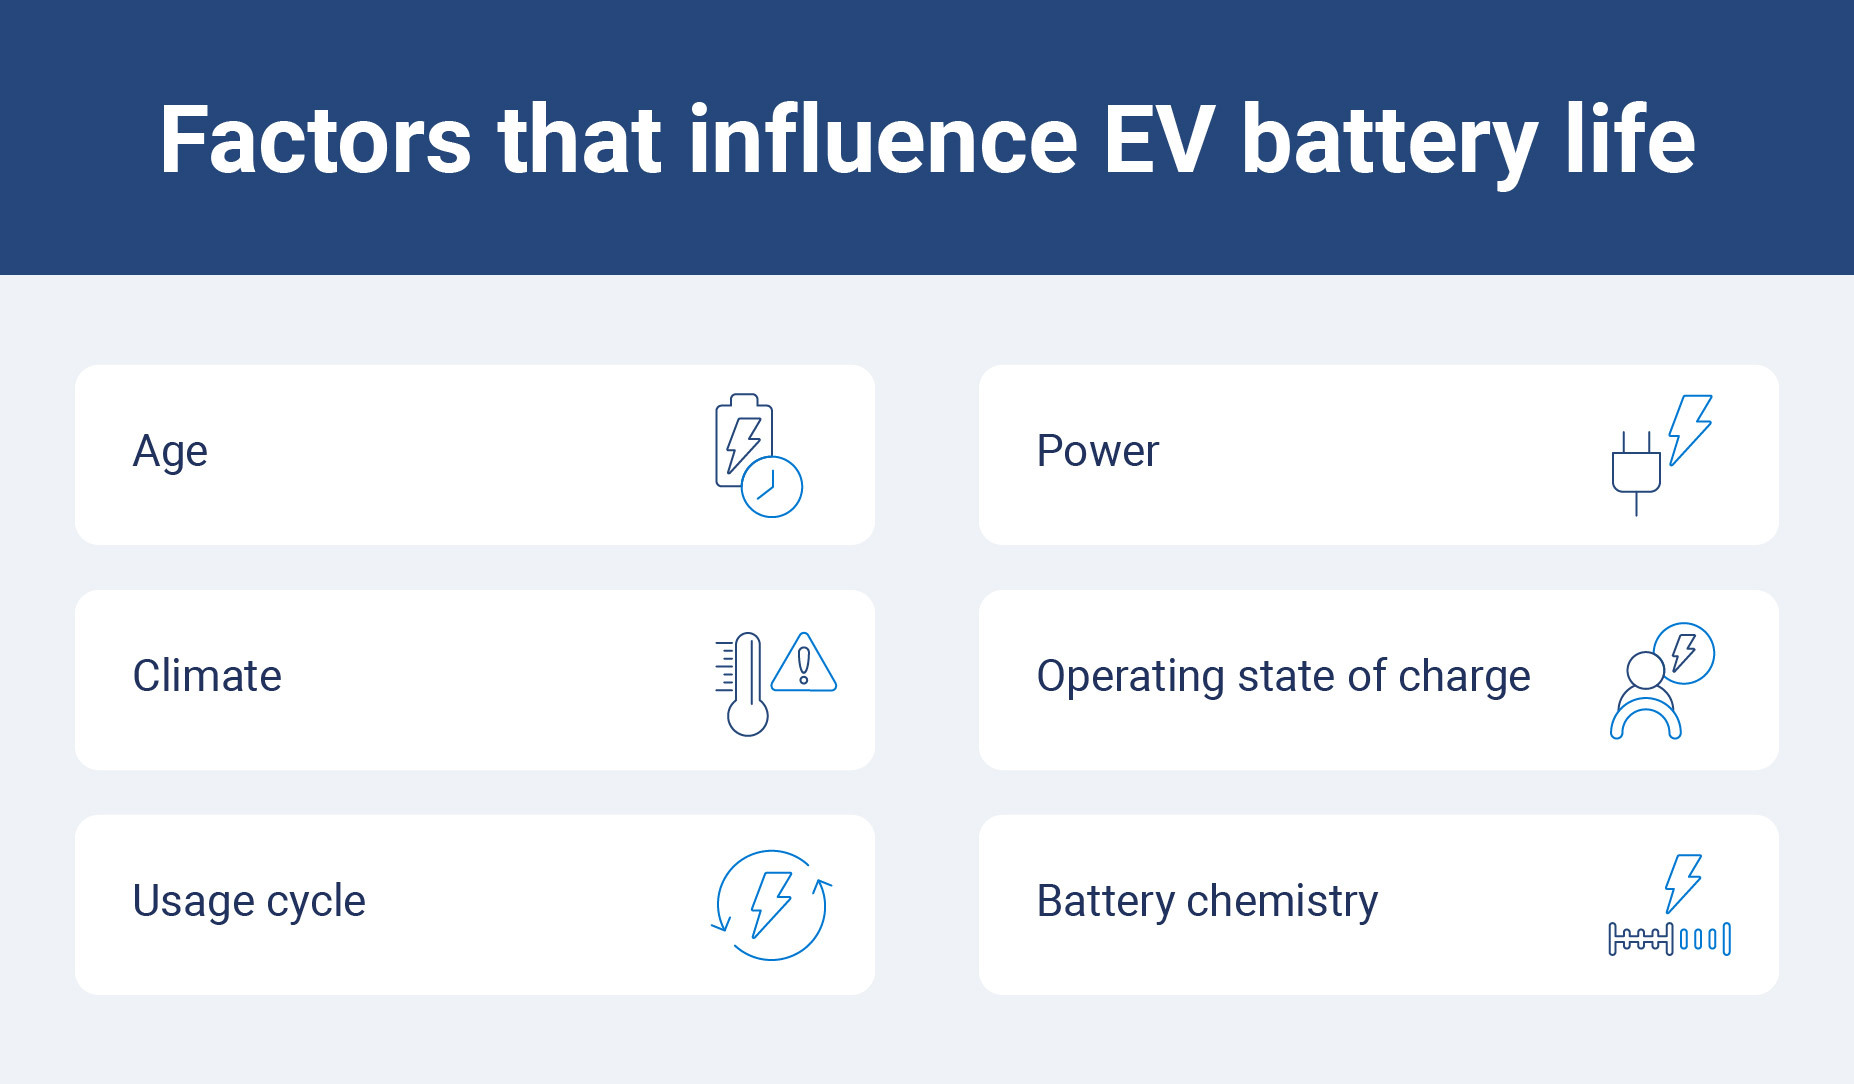
- Battery chemistry: The specific chemistry used (e.g., lithium iron phosphate [LFP], nickel manganese cobalt [NMC], or emerging sodium-ion) will dictate the baseline degradation curve. Different chemistries are optimized for different benefits; some favor longer cycle life (longevity), while others prioritize higher energy densities, thermal stability or lower production costs.
- Battery Management System (BMS): The design and software within the BMS play a critical role in how the battery is protected under stress. This includes the battery packs’ thermal management systems.
Important notice
All data and degradation rates presented in this study are aggregated and averaged across large cohorts. Therefore, while these findings establish strong trends, it is important to note that each individual vehicle may exhibit more or less degradation than the average due to a unique combination of its intrinsic battery properties and its specific usage profile.
Study summary: Managing risk and optimizing ROI
The data confirms that modern EV batteries remain robust and are expected to last beyond a typical vehicle's service life. However, our 2025 analysis, which shows the average degradation rate has returned to 2.3% per year, highlights the emergence of specific operational behaviors that accelerate aging. These trends offer a clear, proactive strategy for fleet management.
High-power DC fast charging is a dominant stressor, leading to the highest annual battery degradation rate. This finding is particularly important, given the industry's trend toward high-power charging. While we expect continued improvements in battery technology and management systems to correct for these external factors (thus promoting the long-term viability of electric fleets), fleet strategy can prioritize certain actions to maximize vehicle lifespans and ROI.
Fleet manager takeaways
- Be strategic with charging power: Where appropriate, prioritize AC charging or lower-power DC charging, only using high-power DCFC (especially above 100 kW) when operationally necessary. This strategy helps minimize battery stress, as unchecked, high-power charging can lead to an estimated 76.0% SOH after eight years, compared to 88.0% SOH for those who prioritize lower-power charging.
- Be aware of climate: There was a small but measurable difference for EVs operating in hotter climates (an increased rate of 0.4%). Consider operational adjustments during heat waves such as parking in the shade or indoors to reduce exposure.
- Prioritize vehicle utilization: The acceleration in degradation from high utilization is a manageable cost (an approximate 0.8% penalty) when weighed against the significant revenue and productivity gains from maximizing vehicle deployment. Your fleet strategy should prioritize uptime and usage.
- Avoid extreme state of charge (SOC) exposure: Your drivers can worry less about adhering to a 20%-80% SOC rule for day-to-day use. However, avoid leaving vehicles parked and idle for prolonged, habitual periods when the charge is near full or near empty, as degradation accelerates significantly when extreme SOC exposure exceeds a 80% cumulative time threshold.
Adopting a telematics-led, data-driven approach provides the visibility necessary for proactive monitoring. By leveraging these insights to strategically manage charging power and avoid prolonged exposure to extreme SOC levels, you can effectively preserve battery health, help protect your investment and ensure the long-term operational viability of your EV fleet.
Compare these new findings with those from Geotab’s previous EV battery health analysis to see how the trends have evolved.
Subscribe to get industry tips and insights
Frequently Asked Questions
The average lifespan of EV batteries will be around 13 years or more based on observed degradation rates. Modern electric vehicle (EV) batteries continue to perform strongly. Geotab’s latest analysis shows an average degradation rate of 2.3% per year, affirming long-term battery viability for both individual and fleet use. EV battery degradation varies by model and is also influenced by operating conditions for the vehicle such as charging power, climate and usage.
Fast charging, particularly using DC fast chargers, can increase battery degradation due to the higher temperatures and currents involved. Frequent use of fast chargers may shorten the battery’s lifespan compared to slower Level 2 charging.
You can check your EV battery health using telematics tools that provide data on its state of charge, degradation rate and remaining capacity. Many EVs also offer built-in diagnostics to monitor battery performance and notify drivers of potential issues.
In Geotab’s 2024 study, the average battery degradation rate was 1.8% per year. In the updated 2026 study, the average battery degradation rate increased to 2.3% per year, based on a larger dataset and shifts in EV usage patterns, particularly an increase in fast charging.
EV battery degradation is measured by tracking its state of health (SOH), which represents its current usable energy capacity relative to its capacity when new. Geotab calculates current battery capacity by measuring energy input (when charging) and output (when driving), analyzing the battery’s change in state of charge (SOC) during these energy transfers. By measuring these parameters over time, this methodology provides a reliable long-term trend.
The most impactful decision within the operator's control is the charging power used. Reserve high-power DC fast charging (DCFC) only for when operational demands require it.
Senior Manager, Sustainable Mobility at Geotab
Charlotte Argue is a sustainable transportation expert, conference speaker and industry board member with 15+ years experience in EVs.
Table of Contents
- Battery degradation trends: Comparing past analyses
- How high-speed charging influences EV battery life
- How does temperature impact battery degradation?
- State of charge (SOC): Utilizing the full battery
- Prioritizing productivity: Utilization as a managed cost
- Design, chemistry and the limits of our data
- Study summary: Managing risk and optimizing ROI
Subscribe to get industry tips and insights
Related posts
.jpg)
Marketplace Spotlight: Redefining Fleet Security with Matrix iQ
July 15, 2026
2 minute read

Charged up: 6 data-driven strategies to maximize EV range in summer
June 19, 2026
2 minute read