How live GPS tracking works
Animation has changed the game in mapping. Our senior software developer discusses live GPS tracking, the animation process, and the future of mapping.
By Geotab Team
Jun 2, 2016
Updated: Nov 6, 2024

Historically, maps have been static — and telematics maps were no different. Buildings, roads, markers, and regions were all shown as static symbols, appropriately enough. However, fleets and individual vehicles were also depicted as static images — meaning that in the past, live GPS tracking was not really… live.
Vehicles are inherently dynamic and maps should reflect that movement.
The introduction of animation to mapping has changed the game. Animation is not just bells and whistles but rather a more adequate representation of inherently dynamic vehicles. With Active Tracking, the current status and position of vehicles are reported at a higher rate, so that vehicle movements are animated on the map, instead of being shown as static markers.
Power up your fleet. Learn more about Geotab’s fleet management software.
Comparing traditional versus animated maps
Typically, a map answers the question “Where?” However, when we're looking at vehicles, the question we often want to ask is “What?” What is going on? Location is only part of the answer. To illustrate the point, let’s look at the example of a vehicle turning a corner.
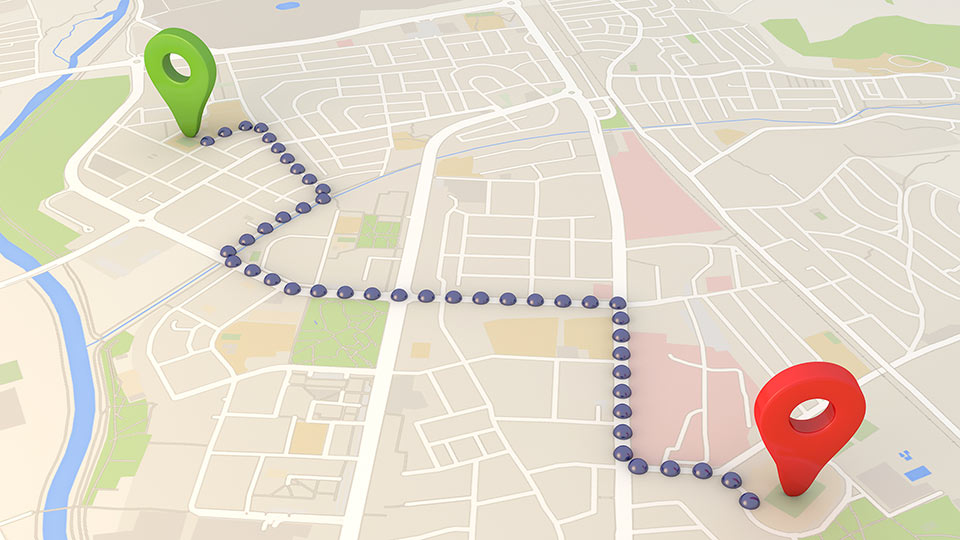
A traditional map shows the vehicle making a turn from one street to another with two map markers: one before the turn and one after. What can it tell us? Well, not much, apart from the fact that vehicle indeed made a turn.
On an animated map, the vehicle moves across the screen in near real-time. The turn is shown as a smooth, fluid movement. This is live GPS tracking.
What difference would an animated vehicle make? Without introducing any data whatsoever, it would tell us how the turn event happened.
Animation allows us to draw further insights into:
- Driver Behavior — We might notice, for example, that the vehicle didn't slow down during the turn and we'd better to switch on the fleet’s harsh braking rule in MyGeotab.
- Road and Environmental Conditions — Or, we might notice that after the turn vehicle started to move extremely slowly with frequent stops. Why? Is something wrong with the pavement? Is it safe to take this route to begin with? Should we instruct other fleet members to take a detour?
These are the sorts of questions that would never be asked. With traditional static maps, there is the risk of overlooking the problem.
Seeing how things happened, leads us to ask the why questions and gain a deeper understanding of the vehicle's activities.
You might ask: “If animating vehicles is that good, why is nobody doing it?” Well, the truth is it’s very technical and difficult work.
Really difficult.
Animation requires a series of key events to happen.
- Before the vehicle location data comes to the map, it must travel from the vehicle through the cellular network to the server.
- Then the data goes through optic-fibre to the MyGeotab servers, where we check if this data is trustworthy and whether there any fleet rules it violates.
- Finally, this device location is delivered over wifi or ethernet network to the browser, where it is animated.

Suggested Reading: Data Management at Geotab
Managing the unknown in live GPS tracking
In a perfect world, everything would go right, but that’s rare. Even when everything goes right, there is still a network latency and processing delay to manage. There are a number of other variables that must be coordinated. A vehicle can drive through a tunnel or area with poor cellular coverage, increasing the data delivery time significantly. The server can experience higher than average data flow during peak hours. Anything and everything can happen — that's the norm. It’s the job of a software developer to anticipate and manage those issues and keep everything operating smoothly.
The animation process
Geotab adopted two approaches to handle delay. Firstly, we delay animation a little bit, so when new device location arrives, it looks like it came from the future, so we have animate vehicle towards it. All vehicles start with 15s animation delay, which helps to deal with most common fluctuations in data flow. As some vehicles are luckier than others by driving in areas with better cellular coverage, we will decrease delay if data flow is stable and predictable enough. Other vehicles might get their animation clock readjusted even further than 15s, or up to 25s if the time intervals between vehicle statuses are extremely irregular.
Secondly, if the vehicle is driving the straight line and there is no new data, we'll assume it will continue driving the same direction for next 10 seconds, and in most cases it does.
Another problem we overcame was combining both traditional static vehicles and animated ones on the same map. How do you tell one from the other? After a few experiments, we noticed that adding a little glow around the animated vehicle gives it an obvious visual distinction. When the vehicle stops at the end of the trip or a vehicle went out of cellular coverage and only the last location is known, the glow fades away and the vehicle marker enters the static style.
The future of mapping
Active Tracking animation has come a long way. We reduced the animation delay and introduced vehicle location prediction algorithms that keep the animation going if a network glitch introduces an unexpected pause in the data flow. But the work is far from being over.
Our goal is to keep reducing the delay as much as possible. With Geotab’s expertise in working with data, we can make this possible. MyGeotab systems are now processing 900 million data points per day or around 750 thousand per minute. Vehicle location predictions can be improved by analyzing underlying street data. If a vehicle driving on the highway with no exits nearby is unlikely to make a sudden turn, based on the vehicle speed, we can safely make predictions up to the next exit ramp. Additionally, we might shift from the browser polling for new vehicle location data to server push notifications. This both will reduce GPS data delivery delay and will help us to make location predictions even further.
The future will bring many developments to mapping. There are many other aspects of vehicle behavior that can be visualized, such as how intensely a vehicle speeds up or slows down. Currently, the animation path goes strictly through the GPS points. In the future, the vehicle path could follow the street shape precisely, show exactly how it starts moving at traffic lights, or enters turns. The map view could be shifted also from the vehicle as an abstract schematic marker to a real vehicle with people in it. Integration and text or sign recognition are also part of the exciting future of maps.
To see live GPS tracking in action, be sure to check out our Active Tracking demo video.
Related Posts:
Subscribe to get industry tips and insights
The Geotab Team write about company news.
Table of Contents
Subscribe to get industry tips and insights
Related posts

Odometer reading: How to check + optimize for smarter fleet management
July 15, 2025
5 minute read


The impact of unproductive idling on police vehicle service life
June 10, 2025
3 minute read

Multi-stop route planners: A fleet manager's guide + best tools in 2025
June 5, 2025
5 minute read

