What Happens to a City When the World Shows Up?
When six million visitors arrive in 16 cities at once, a city’s resilience is put to the test. Here's how commercial drivers and fleet operators can use data to stay ahead of it.

By Mike Branch
Vice President, Data and Analytics at Geotab
Jun 4, 2026
.jpg)
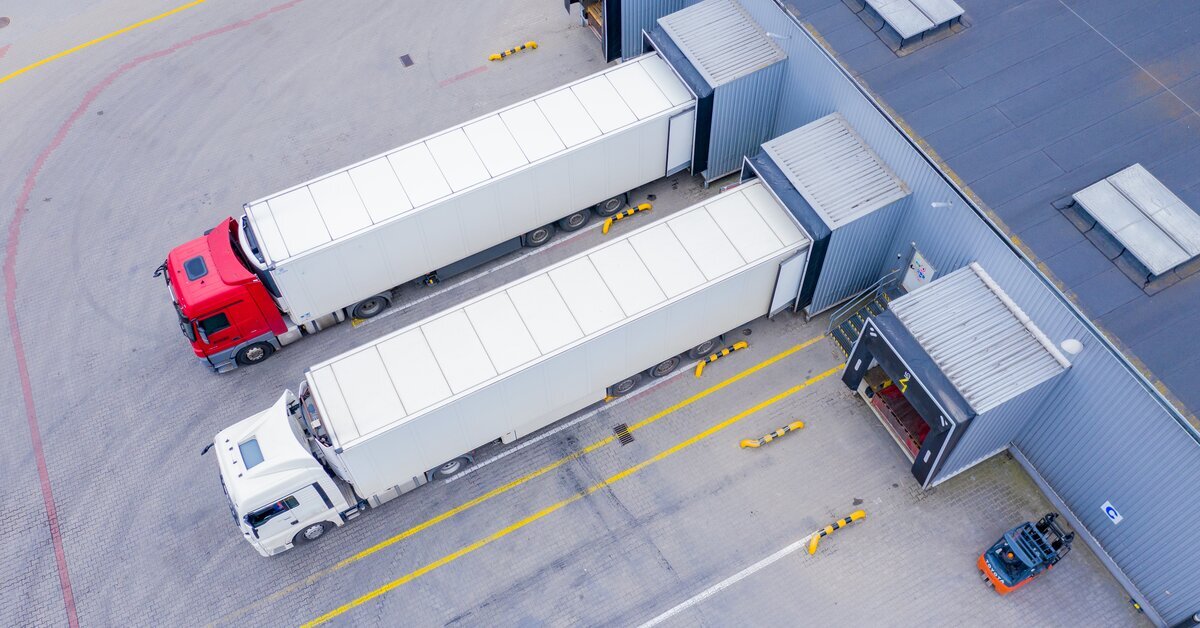
Hosting the world for a global sports tournament is an honor. It's also a major stress test for a city’s road network.
In just one week, 16 cities across North America will host the largest sporting event ever staged: 48 teams, 104 matches, and an estimated six million visitors. While the world cheers on their team, we’ll be watching the traffic patterns underneath it.
Geotab processes 100 billion data points daily from more than six million connected commercial vehicles. That data doesn’t just measure traffic. It reveals how cities move under pressure. And ahead of this tournament, it’s already providing valuable insights for fleet operators navigating increased congestion and demand.
From reactive management to proactive orchestration
For decades, cities have managed mega-events reactively: crowds arrive, congestion builds and response teams adapt in real-time. Today, connected vehicle data allows transportation teams and businesses to plan ahead instead of simply reacting.
Through Altitude by Geotab, we analyzed billions of data points from major sporting and public events across 2025 to build our Host City Readiness Rankings. The dashboard evaluates each host city across congestion, idle time, safety and resilience metrics to help businesses and fleet operators better understand how traffic pressure may affect the movement of goods and services during peak event periods.
Think of it as a road movement report card for cities during large-scale events.
What the data shows
The rankings highlight where congestion pressure is likely to be greatest and where transportation networks may face the most strain. Each of the 16 host cities presents different strengths and challenges.
For example, the area surrounding Gillette Stadium in the Boston region demonstrated strong event-day traffic flow performance, while larger metropolitan hubs such as Los Angeles and Atlanta showed the complexity of managing dense commercial traffic alongside event-related travel demand. The data provides insight into planning. Fleet operators can use this information proactively by building in buffer time, adjusting delivery schedules, and rerouting around peak kickoff windows.
In a recent driver survey, 79% of U.S. respondents said event-day driving increases stress levels, while many Canadian and Mexican drivers cited concerns around fuel efficiency in tournament traffic. For the commercial drivers keeping host cities supplied, from delivery vehicles to service fleets, understanding where traffic pressure is concentrated provides a meaningful operational advantage.
For fans attending matches, public transit also plays an important role in reducing road congestion and keeping commercial traffic moving efficiently.
The shift from big data to actionable intelligence
Among the most valuable insights our data delivers is a city's resilience: not just how congestion builds, but how quickly a city recovers. By analyzing patterns from major sporting and public events across 2025, we can now see how each host city has historically bounced back from peak traffic stress and where persistent bottlenecks remain long after crowds disperse.
This matters for commercial operators. A city that recovers quickly from event-day congestion presents a different risk profile than one where freight corridors stay congested for hours. Understanding a city's resilience pattern, when and where traffic normalizes, gives fleet managers and transportation leaders the intelligence to plan not just around kickoff, but through the full window of event impact.
What comes next
As the tournament progresses, we’ll continue tracking how host cities perform against their pre-tournament baselines. More importantly, we’ll share practical insights commercial operators can use throughout the event: which corridors are holding up, which match-day windows carry the highest congestion risk and how routing patterns evolve as the tournament advances.
Where cities outperform expectations, we’ll gain valuable insight into what adaptive traffic management looks like at scale. Where pressure is greatest, the data will help identify where future mobility investments could have the biggest long-term impact.
Cities cannot redesign their road networks overnight. But understanding how congestion builds and spreads during a mega-event gives transportation leaders and businesses the intelligence they need to make smarter operational and infrastructure decisions moving forward.
Let the games begin!
The Host City Ranking is not endorsed by or affiliated with FIFA.
Subscribe to get industry tips and insights
Vice President, Data and Analytics at Geotab
As Geotab’s Vice President of Data and Analytics Mike Branch leads the development for solutions that enable insight from over 5.8 million connected vehicles and 100 billion telematics records that Geotab processes daily.
Table of Contents
Subscribe to get industry tips and insights
Related posts
AI readiness checklist for field service fleets: Is your data ready for AI?
July 6, 2026
1 minute read

Charged up: 6 data-driven strategies to maximize EV range in summer
June 19, 2026
2 minute read


B.C.'s Dashcam Mandate Creates an Opportunity for Safer Roads Across Canada
June 5, 2026
2 minute read