Simplifying data exploration and visualization with Geotab Ignition
Geotab Ignition was launched earlier this year to help advance research on smart cities, autonomous vehicles and more.
Aug 26, 2022
During these unprecedented times, one thing that almost everyone has come to learn is just how important data is — whether for businesses trying to operate, governments trying to reopen, or for the everyday consumer trying to understand the impact of events. In fact, there’s no question that data is the undercurrent of these unparalleled times, with access to it proving to be especially critical in helping governments and businesses make informed decisions. But while having access to aggregate data is beneficial to many, the ability to properly navigate the technical and visual aspect of data is not universally understood — potentially hindering users’ ability to leverage data platforms properly and effectively.
See also: Empowering business with data intelligence: Fiona Zhao interview
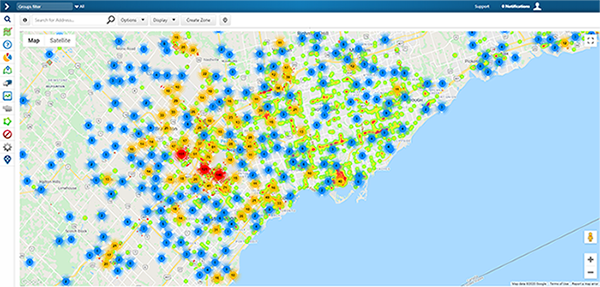
To further enable all users to better analyze and digest connected vehicle insights, our Data & Analytics team launched Geotab Ignition earlier this year. Geotab Ignition aims to help advance our customers' knowledge and the research surrounding smart cities, autonomous vehicles, and intelligent transportation by providing seamless exploration of anonymous aggregate data.
Originally launching with 12 datasets, in just a few months’ time, the team has expanded the Ignition platform to include 25 datasets to date. These aggregate datasets are divided into four different categories: Urban Infrastructure, Weather, Location Analytics and Mobility.
To help Geotab customers and the public better understand the data available on Geotab Ignition, the Data & Analytics team has put together a snapshot of the different datasets available and identified industry users, such as Deloitte and Fleet Profit Center, who have taken advantage of this multi-use platform.
Highlighting the popular and notable Geotab Ignition datasets
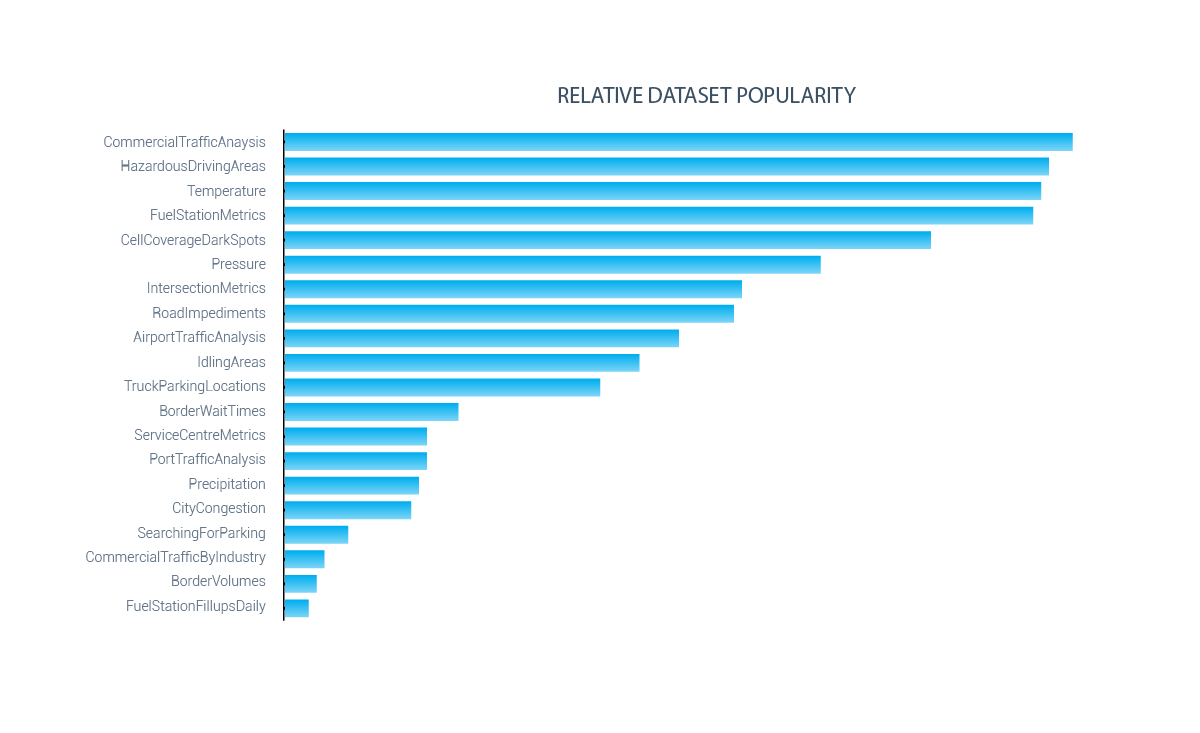
The five most popular datasets by number of queries
Of the 25 Geotab Ignition datasets, the following have been identified as the five most popular based on their utilization by public and private sector organizations all over the world.
- Commercial Traffic Analysis — Released in April of this year (at the initial rise of COVID-19 across North America), this dataset has gained momentum as the most used dataset on Geotab Ignition. Geotab's Commercial Transportation Recovery Dashboard provides a live look at commercial transportation and trade activity and can be used as a macro-level tool to understand economic recovery across regions and different sectors.
- Hazardous Driving Areas — This dataset highlights urban and rural areas where vehicles are consistently experiencing harsh braking occurrences and collision-level events. Many times this data is used to help city governments understand potential infrastructure problems and/or help improve driver safety by assisting drivers looking to normalize their driver score. For example, if a driver’s score didn’t take into context the fact that there were more hazardous driving areas in New York city due to drivers constantly slamming on their brakes than in say rural Idaho, a New York City driver could be inadvertently penalized over a driver from Idaho.
- Temperature — This dataset is continuously updated with temperature data processed at aggregate from vehicle ambient air temperature sensors down to 500ft by 500ft regions. This data can be used for a variety of applications in many industries. For example, in the automotive sector, this dataset is commonly used to accurately identify temperature-sensitive failures, such as a failing car battery.
- Fuel Station Metrics — At aggregate, this dataset identifies fuel tank fill-up events and produces a geographic distribution of gas stations segmented by frequency of fill-up by the time of day and type of vehicle. Fleet management companies greatly benefit from these metrics in order to help track accurate fuel station data.
- Cellular Coverage Dark Spots — In certain regions, a lack of cellular coverage can result in potential security risks for drivers. This dataset highlights geographic areas where there are persistent cellular coverage issues across multiple carriers, helping fleets to understand what the strength of cellular coverage is in their region. This dataset can also be utilized by cities and telecommunications companies to help improve areas of poor cellular coverage.
See also: Interview with Mike Branch on the Commercial Transportation Recovery Dashboard
Top three underrated Geotab Ignition datasets that users should take advantage of
Beyond the datasets highlighted above, there is such a rich ecosystem of data insight available on Geotab Ignition that isn’t being utilized to the extent it should be. From understanding which industries are seeing better recovery in the transportation sector from COVID-19 to doing deep dives on intersection-related congestion in cities and traffic corridor analysis, there is so much untapped potential. We believe the following datasets also deserve to be on the “popular” list:
- Commercial traffic by industry — As businesses and governments continue to navigate their COVID-19 recovery efforts, many may have failed to recognize the importance of segmenting activity by industry. For example, by analyzing recovery efforts by industry, users can identify how Canada's transportation and logistics industry is recovering and compare this data to the manufacturing industry in the U.S. to help accurately depict the current and future state of specific countries and industries.
- Border volumes and wait times — This dataset displays percentage to normal volume and wait times of commercial vehicles located at North American borders, updated hourly. Not only does this dataset provide an accurate indication of trade, it also produces valuable input for routing prediction to help improve fleet productivity.
- Intersection insight — Whether you’re looking to identify more effective routes, understand city congestion or conduct corridor analysis, this dataset can help provide users with rich data insights from vehicle activity at signal-controlled intersections.
Geotab Ignition's top industry users
Oftentimes, businesses and governments may fail to recognize the significant role data plays in helping industries advance. To help provide increased awareness, we have identified the top Geotab Ignition users by industry.
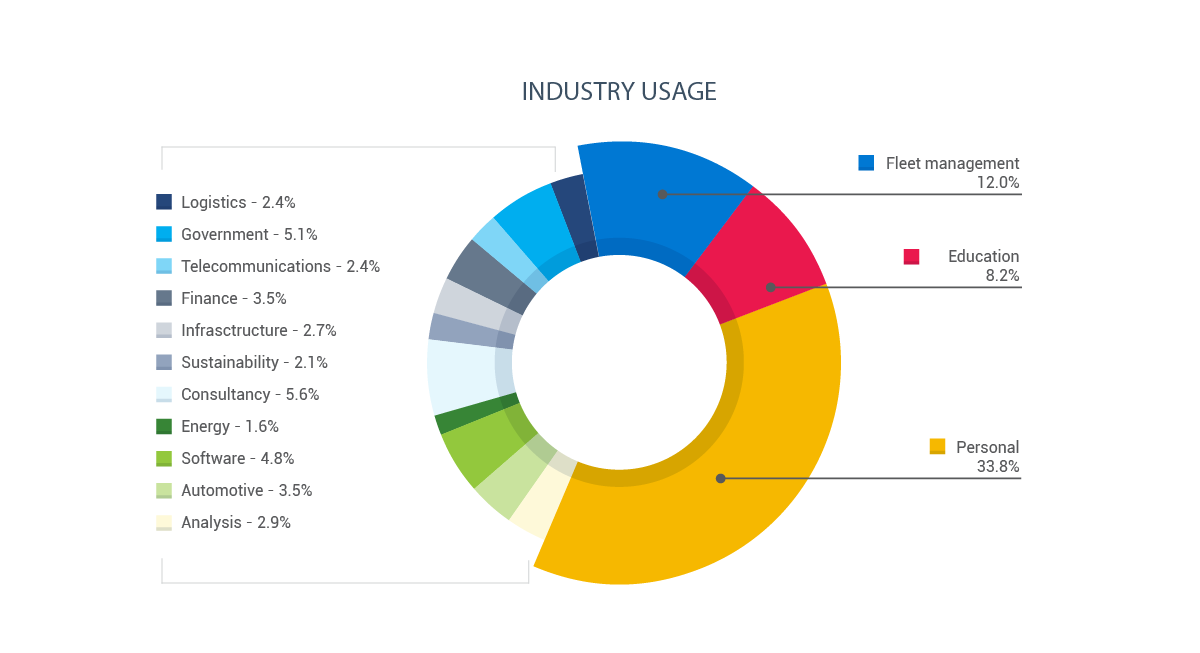
As expected, since Geotab Ignition is available to both Geotab customers and the public, the largest number of queries and user constituency is driven from personal email accounts.
Top five industries by user volume:
- Fleet management
- Education organizations
- Consultancies
- Government
- Software companies
Top five industries by number of queries executed:
- Fleet management
- Consultancies
- Software companies
- Education organizations
- Organization in sustainability
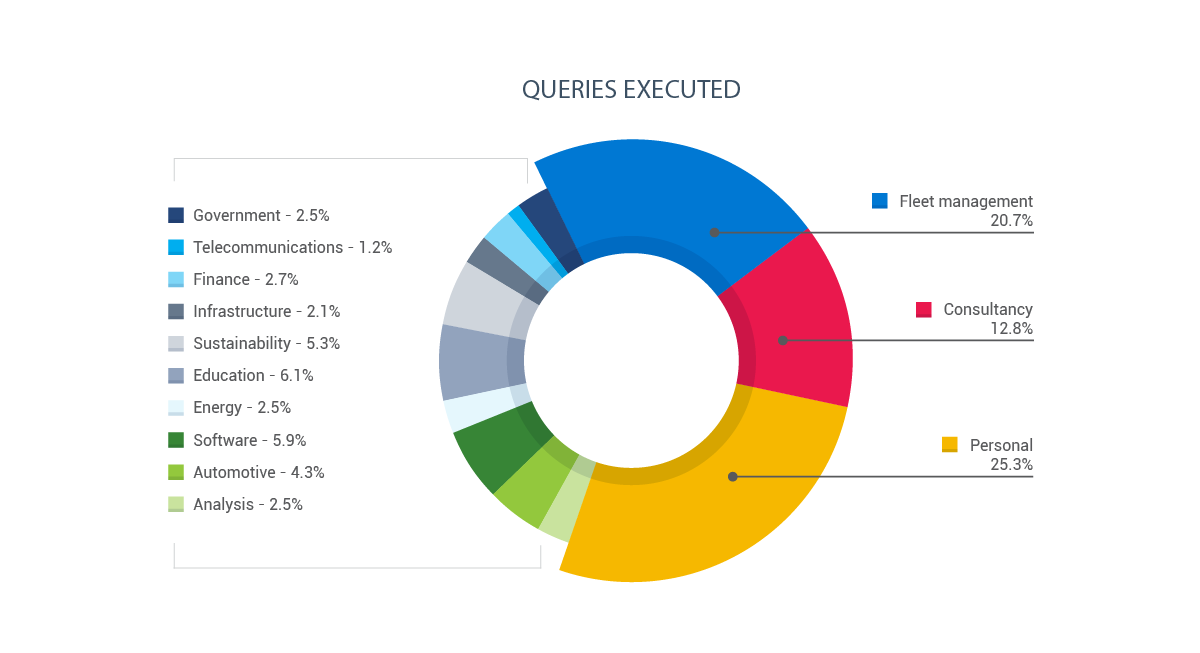
Given that fleet management and consultancies occupy the top two spots on the number of queries executed on Ignition, we have profiled both Deloitte and Fleet Profit Center below for a depiction of how they have put this data to use to help advance their own ecosystem.
How Deloitte leveraged Geotab Ignition as an alternative index in their COVID-19 Economic Recovery Dashboard
When Deloitte looked to launch its COVID-19 Economic Recovery Dashboard, they wanted to produce a forward-thinking analysis based on non-traditional high-frequency data. Hypothesizing that the movement of goods and people would be leading indicators for economic growth during this crisis, Deloitte reached out to Geotab. Within a couple of days, they had established an integration into Geotab Ignition’s Commercial Activity, Airport Activity, and Border Crossings datasets. The breadth of jurisdictions covered and the availability of “ready-made” insights from Geotab Ignition helped Deloitte produce valuable data insights and achieve over 160K views of their COVID-19 recovery dashboard.
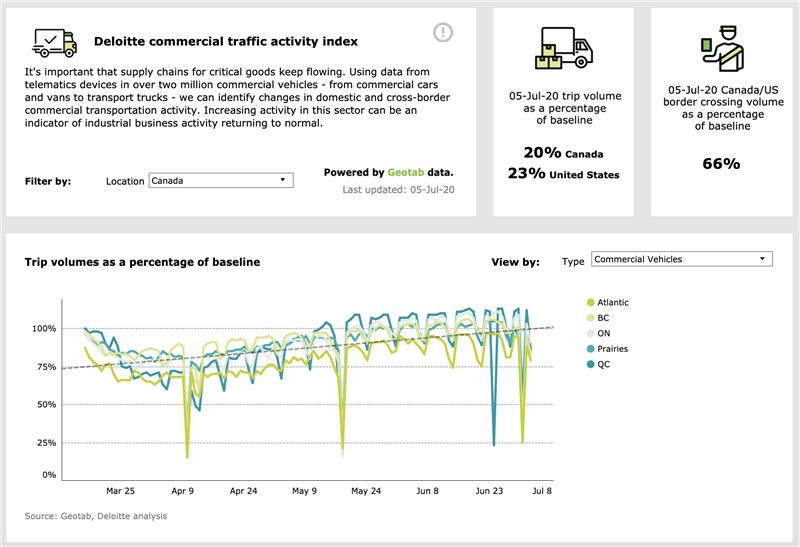
“In just a few days, Deloitte went from requesting Geotab Ignition data from Geotab’s Data & Analytics team, to generating valuable insights on North American commercial traffic activity for our Economic Recovery Dashboard. These data-sets were structured and made readily available, the team easily plugged the data into their API and away we went!” said Stefan Popowycz, Partner at Deloitte Omnia AI (Deloitte Canada’s Artificial Intelligence Practice).
Providing Fleet Profit Center's customers with superior data access with Geotab Ignition
Fleet Profit Center actively leverages the Geotab Ignition platform to enable big data conversations with customers and prospects. By integrating their custom Add-In FPC Intelligence Map with the Geotab Ignition platform, Fleet Profit Center is able to provide valuable insight into a customer's specific problem.
This integration allows Fleet Profit Center to effectively work to add a customer's business data as another layer of data input, allowing for a more detailed trend analysis to be completed.
"The ability to merge Ignition with our client's telematics and CRM data provides us with insights that would have otherwise required years of vehicle tracking to achieve" says Justin Streich, President of Fleet Profit Center.
How can I get started with Geotab Ignition?
If you want to take advantage of this easy-to-use platform, simply register for a free account at ignition.geotab.com. Once registered and logged into the platform, you can create queries to access and visualize the available data. This will allow you to further explore the data and even embed it on your own platform.
If you are interested in automatically pulling the available data from behind the scenes, request a free service account here and we’ll help get you started!
Subscribe to get industry tips and insights
The Geotab Data & Analytics Team write about news related to data.
Table of Contents
Subscribe to get industry tips and insights
Related posts

Beyond the hype: Real AI priorities for field service leaders
March 26, 2026
6 minute read

Unified data: The key to fleet liability reduction for government agencies
March 19, 2026
9 minute read


Building a proactive government fleet safety program with data and AI
March 9, 2026
5 minute read