Measuring fleet productivity and managing downtime with telematics
Measuring fleet productivity with telematics can help improve efficiency and save your business money.
By Geotab Team
May 2, 2025

If you are a fleet manager today, one of your key objectives is to track fleet productivity and reduce costs. Many businesses are striving to achieve fleet efficiency at a time when labor and fuel costs are skyrocketing. Improving productivity will help you provide optimal service to your customers, which is so important now more than ever.
Telematics technology gives fleet managers accurate and detailed visibility over their vehicles, helping businesses allocate assets where they’re needed the most. In this blog, we discuss several cost-control strategies using Geotab GO device data which can help boost productivity and vehicle uptime.
What is fleet productivity?
Fleet productivity is the basic measure of employee work output. Creating a productivity score provides a way to objectively measure performance so you can identify successes and pinpoint areas for improvement. The ultimate goal is to achieve fleet efficiency and reduce your fleet costs.
Maintaining 100% visibility over vehicle utilization and work assignments helps make sure that Hours Paid = Hours Worked as much as possible. Gaining just one hour of driver productivity per day, or even per week, adds up quickly.
Having said that, you should also note that it is not ideal to expect 100% productivity, especially when employees lack control over their own output. For example, the performance of drivers can be impacted by different factors such as customer availability or adverse weather and traffic.
What is fleet efficiency?
When a business focuses on getting maximum output from the minimum input, it can achieve fleet efficiency. You can improve efficiency by ramping up productivity and keeping costs down. To calculate fleet efficiency, you need to take several variables into account, including productivity, fuel consumption, emissions, routes, costs and driver safety.
How is fleet productivity measured?
Fleet productivity can be measured based on fixed and variable costs. Fixed cost, as the name suggests, includes fixed expenditures such as the acquisition of vehicles, leasing, and more. Variable costs on the other hand are fuel, tires, maintenance, repair and labor. If we take labor into consideration to calculate fleet productivity, the following formula can be helpful:
Productivity score formula
(Total Hours Worked) / (Shift Hours less Lunch, Breaks or Meetings, Downtime like traffic) = Productivity Score
For example:
(Drive time = 5 hours + Office time = 1 hour) / (8 hours shift - 1 hour lunch and breaks)
(5+1) / (8-1) = 86% Productivity score
You can adjust this formula as needed depending on the structure of your business.
Top fleet metrics for measuring productivity
Fleet managers are under a lot of pressure to increase fleet efficiency and reduce costs. Tracking several key metrics over time can inform vital decisions and business strategies. Although you may have other metrics that are important to your specific goals, here is a starting list:
- Miles traveled
- Daily Vehicle Inspection Reports (DVIR)
- Fuel costs
- Odometer readings
- Repair and maintenance costs
- Labor costs
- Operation costs
Which Geotab reports can help track and measure driver productivity?
- Trips Summary Report
This report measures mileage, driving time, idling time and zone type duration by vehicle, over a given time period. The Trips Summary Report helps with customer visits to see if drivers are utilizing their day to the fullest.
Video tutorial: Learn how to Run a Trips Summary Report
- Customer Visits Report
The Customer Visits Report measures zone activity by vehicle, displaying the time of arrival/departure and the duration spent in a zone.
For businesses seeing increased activity because of recent events, this report flags new locations and tracks which customers you are still able to visit and not visit. For businesses facing a loss of revenue, this report can help determine which customers are able to maintain a relationship so that they can be paid extra attention.
Video tutorial: How to use the MyGeotab Customer Visits Report.
- Time Card Report
This report measures the first and the last ignition of the day, driving time, idling duration, location of the last ignition, and zone type. These measurements can be used to see whether breaks or lunches are being extended, or whether an excessive amount of unauthorized stops are occurring.
Video tutorial: View a Time Card Report in MyGeotab.
- Trips History Report
Take a look at your vehicle's trip history and breadcrumb trail to correctly assess productivity. You can either look at vehicles individually or analyze them together to better understand day-to-day activities and uncover areas of improvement.
Video tutorial: View a Vehicle’s Trips History in MyGeotab
How idling can impact fleet productivity
Whether your fleet has light, medium or heavy-duty vehicles, putting a strategy in place to reduce idling is critical for productivity. Idling is when a vehicle's engine is running, even when the vehicle is stationary. While not all idling is avoidable, for example in heavy traffic, there are many instances where it can be minimized.
Excessive idling not only wastes fuel but also wastes time. Idling vehicles are not making deliveries or driving to their next work location. Idling can also put extra load and engine hours on your fleet, increasing the number of oil changes and other maintenance tasks required. Reducing idling also brings down your carbon footprint from a sustainability perspective.
What are some strategies for reducing idling time?
While the Geotab GO device automatically monitors idling within each trip (no setup required), customizable reports and rules make tracking idling easy.
Here are the most effective reports for identifying and curbing idling:
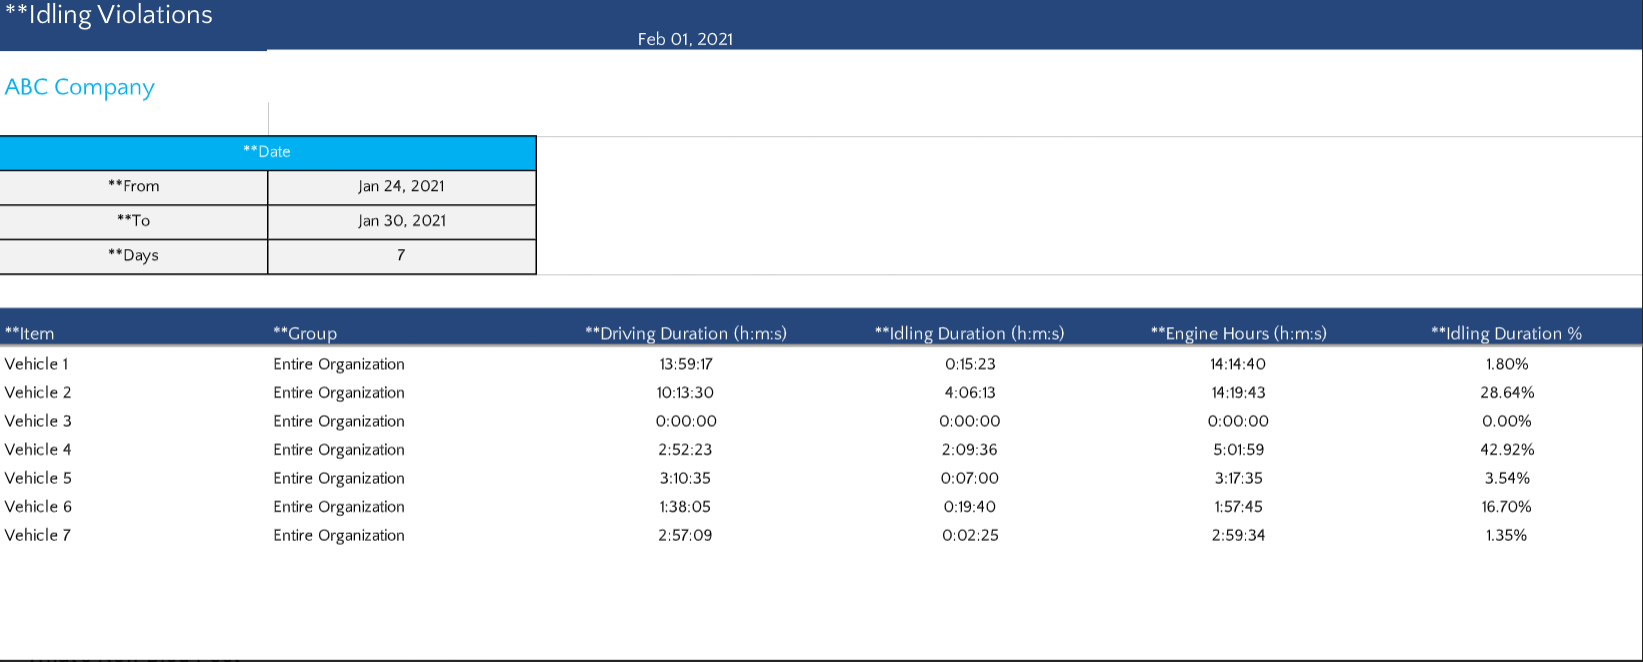
- Highest Idling Duration
See the percentages of engine time spent idling versus driving, per driver, per day. The results of this report can be used to determine which drivers need further training.
.png)
- Weekly Idling Cost Trend
The Weekly Idling Cost Trend Report provides a rolling, seven-day view of your fleet’s total cost of idling that can be refreshed daily. You can use this report to spot trends during certain days of the week, which may correlate to specific work assignments or job sites, allowing you to make adjustments for the following week.
.png)
- Last 3 Months Idling Trends Report
This report displays the total fuel spent while idling across the entire fleet. You can use this report to assess whether or not your efforts to reduce idling have been successful. Trend reporting tools are also helpful in areas like asset utilization.
You can download the Last 3 Months Idling Trend Report from the Geotab Marketplace.
.png)
- The Idle Cost (previous 30 days)
The Idle Cost Report provides a 30-day rolling view of your fleet’s total cost of Idling. While managing productivity is key, seeing the whole cost of idling over 30 days is impactful as it gives a realistic view of the amount of money that has gone into it.
.png)
- Trended Exception Report
The Geotab Trended Exception Report can be found under Dashboard and Analytics in your MyGeotab database. With more than 3 billion data points processed each day, Geotab has up-to-date information on what's happening in the fleet industry. This report provides current insights on driving activity, such as idling trends, fuel economy, and driver safety. You can use this to compare your business vocation and fleet composition to help you formulate your idling policy.
Next steps for fleet productivity
Confirm your drivers are using their time effectively by checking your productivity score and running reports regularly. Setting up idling reports is a useful next step for finding vehicles that aren’t contributing to productivity and need further management. When you are ready to take the next step, look into other fleet productivity management tools such as driver coaching, asset tracking, routing and dispatching.
Visit the Geotab Community.
Subscribe to get industry tips and insights
The Geotab Team write about company news.
Table of Contents
Subscribe to get industry tips and insights
Related posts

Construction fleet management software: What mixed fleets should look for
July 29, 2026
5 minute read
Beyond consumer apps: 5 ways integrated navigation protects your fleet
July 23, 2026
6 minute read

From video archives to active prevention: The case for AI dash cams
July 22, 2026
4 minute read
The safest mile in field service is the one nobody drives
July 22, 2026
2 minute read

Best small fleet management software providers and how to choose one for your business
July 16, 2026
8 minute read