Fleet management ROI vs. COI Comparison
How can fleet managers reduce costs? Learn about fleet management ROI vs. COI and how to find new savings in safety, fuel, maintenance, and productivity.

Vice President, Public Sector
May 19, 2026

Key Insights
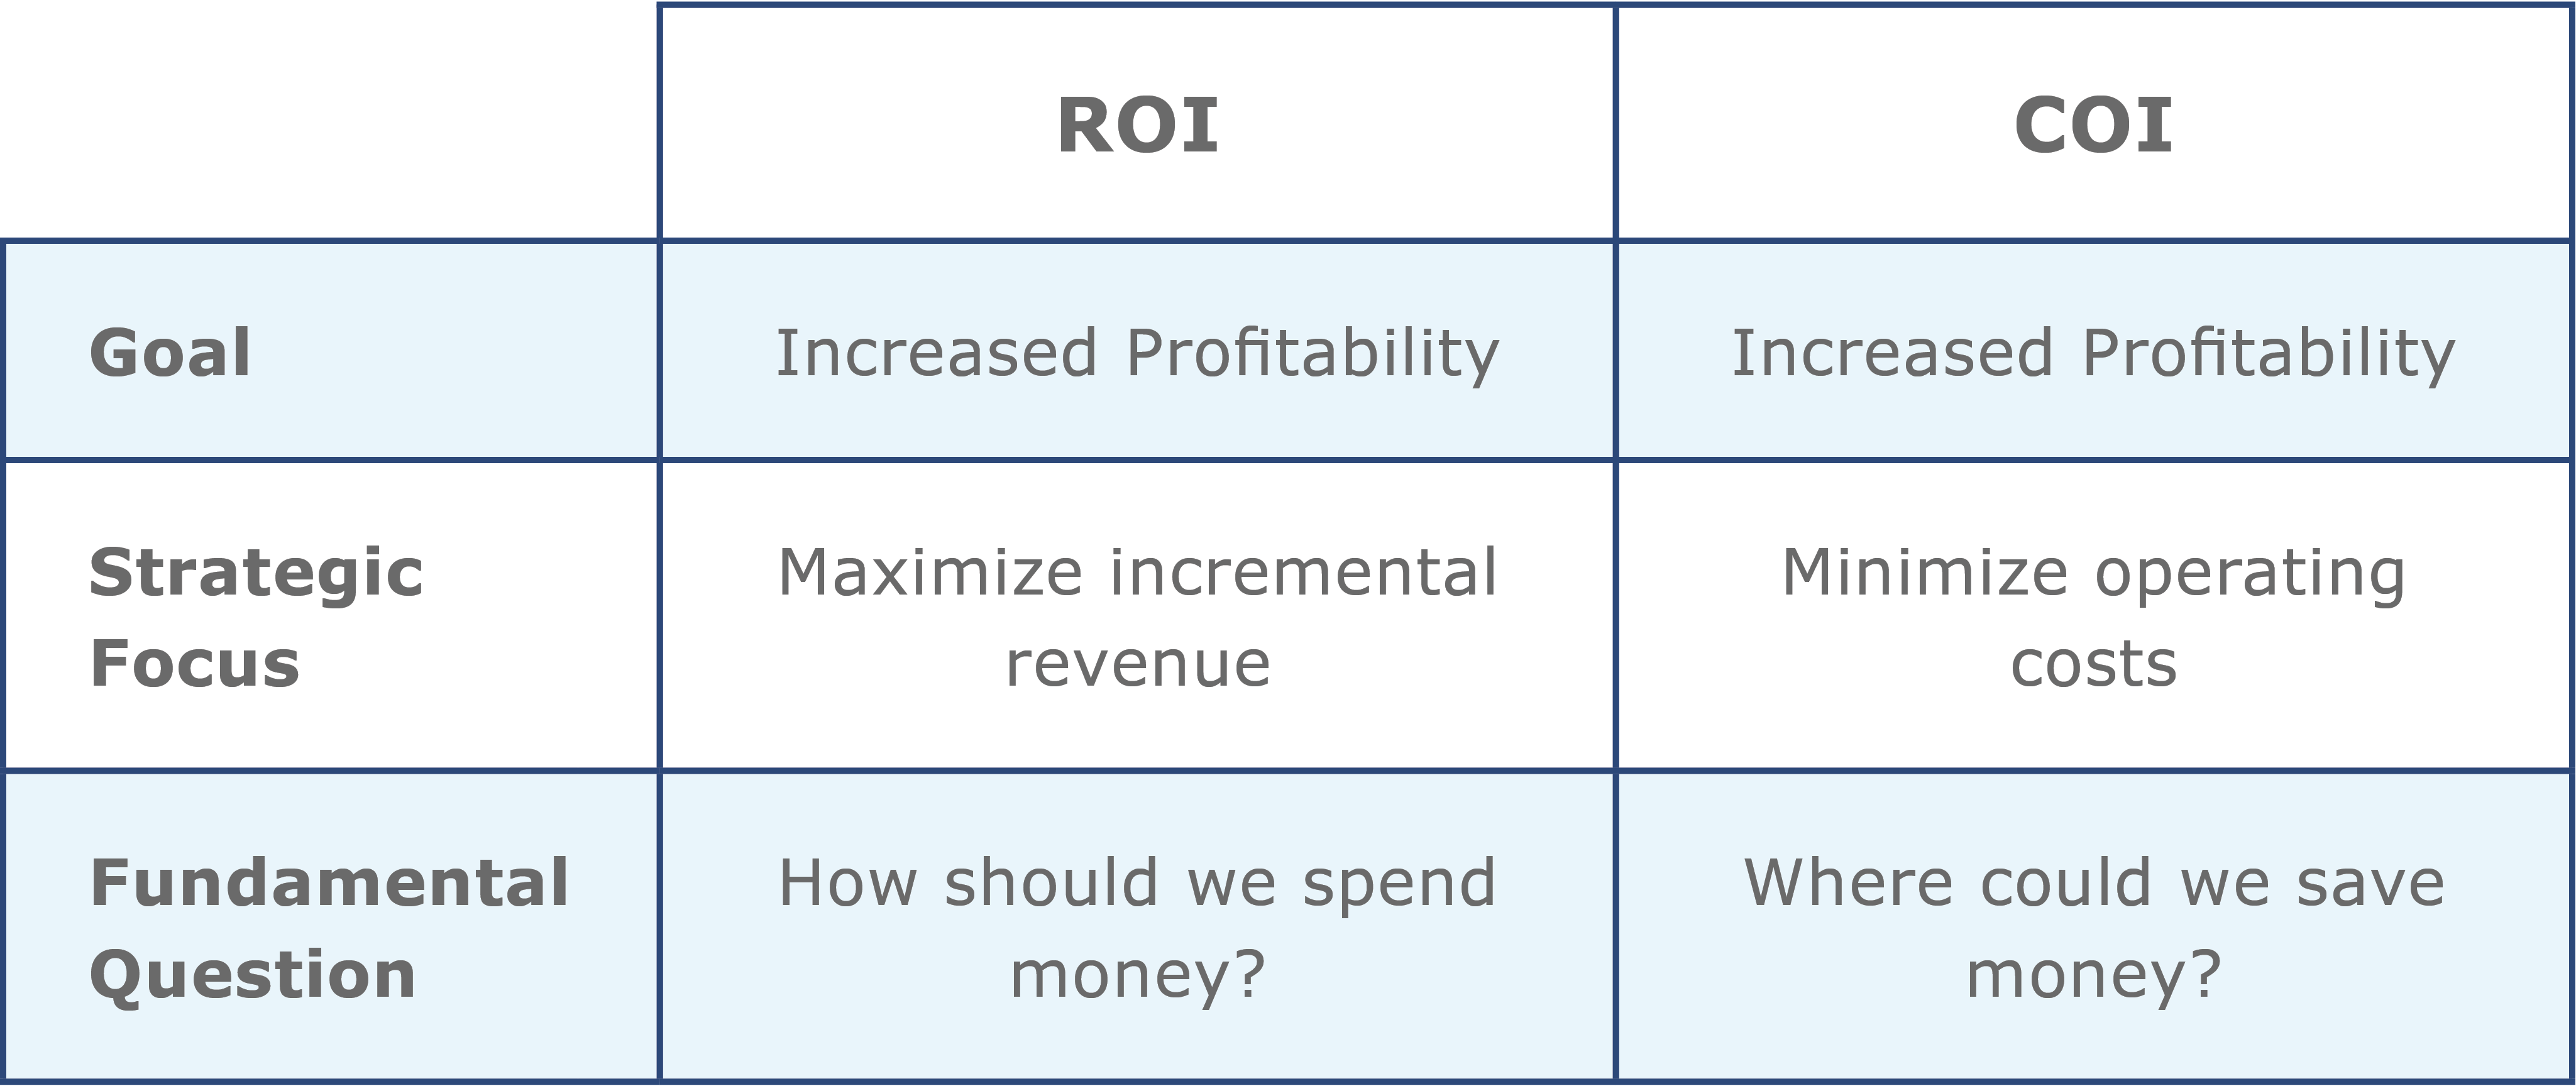
- COI focuses on a quantifying amount of lost savings, while ROI measures incremental revenue gains. For fleet managers facing budget constraints with limited top-line growth, COI is the more actionable framework.
- Geotab's segments cost reduction into Safety, Fuel, Maintenance, Productivity - and identifies which specific drivers require coaching, enabling managers to prioritize interventions by highest financial impact.
- Insurance companies report 45% accident reduction and 50% lower payout costs when fleets use telematics effectively — creating immediate hard-dollar savings beyond operational efficiency gains.
- Heavy-Duty long-haul fleets have higher fuel costs per mile while Light-Duty fleets carry larger collision/claims costs per mile requiring vehicle class and mileage analysis to identify where each fleet's largest COI exists.
- Unplanned maintenance interruptions cost $400–$700 per day in lost profits beyond repair expenses, while telematics reduces scheduled and unscheduled maintenance incidents by 14%.
Current economic conditions continue to challenge companies across all industries, diminishing demand and increasing competition. As a result, many business owners are being forced to focus their efforts on maximizing bottom line returns in the face of poor top line growth. This often means minimizing operating costs in order to grow operating margins.
This is especially relevant to fleet managers, whose fleet costs often make up a large portion of their company’s total operating budget. Unfortunately, cost savings opportunities can be difficult to spot. Understanding fleet management software cost and how it contributes to these expenses can help managers make more informed technology investments. Telematics can help in this effort. With telematics, fleet managers can identify and quantify fleet-wide savings opportunities, and implement the proper driver management initiatives to achieve them.
In this blog post, I discuss the difference between fleet management ROI and COI and introduce a new tool that can be used to help fleet managers identify and quantify strategic savings opportunities throughout their fleet operations.
What is COI?
COI — or Cost of Ignoring — can be thought of as the amount of lost savings that result when a company fails to undertake a strategic business investment that would otherwise improve operational efficiency. In other words, for fleet managers, it can be thought of as the incremental operating costs resulting from the improper use of telematics (or in some cases the complete lack of telematics).
What are the differences between ROI and COI?
While the Cost of Inaction (COI) shares a strategic objective with its better-known cousin, Return on Investment (ROI), their core focuses differ. ROI targets maximizing incremental revenue, whereas COI centers on minimizing operating costs.
Where should I look for fleet savings?
Each fleet is unique, and therefore each fleet can have drastically different cost structures. In our research, we found that two variables in particular impacted a fleet’s operating costs: vehicle class and vehicle mileage.
For example, a long-haul Heavy-Duty (HD) fleet will have a very different Cost per Mile (CpM) breakdown than a low-mileage Light-Duty (LD) fleet. In general, the HD fleet will likely have larger proportional fuel expenses per mile compared to the LD fleet which will have larger collision and claims costs per mile.
Suggested reading: Taking a close look at the costs of running a fleet
As a result, the savings opportunities available to a specific fleet will change based on the fleet’s operating characteristics, making them difficult to quantify.
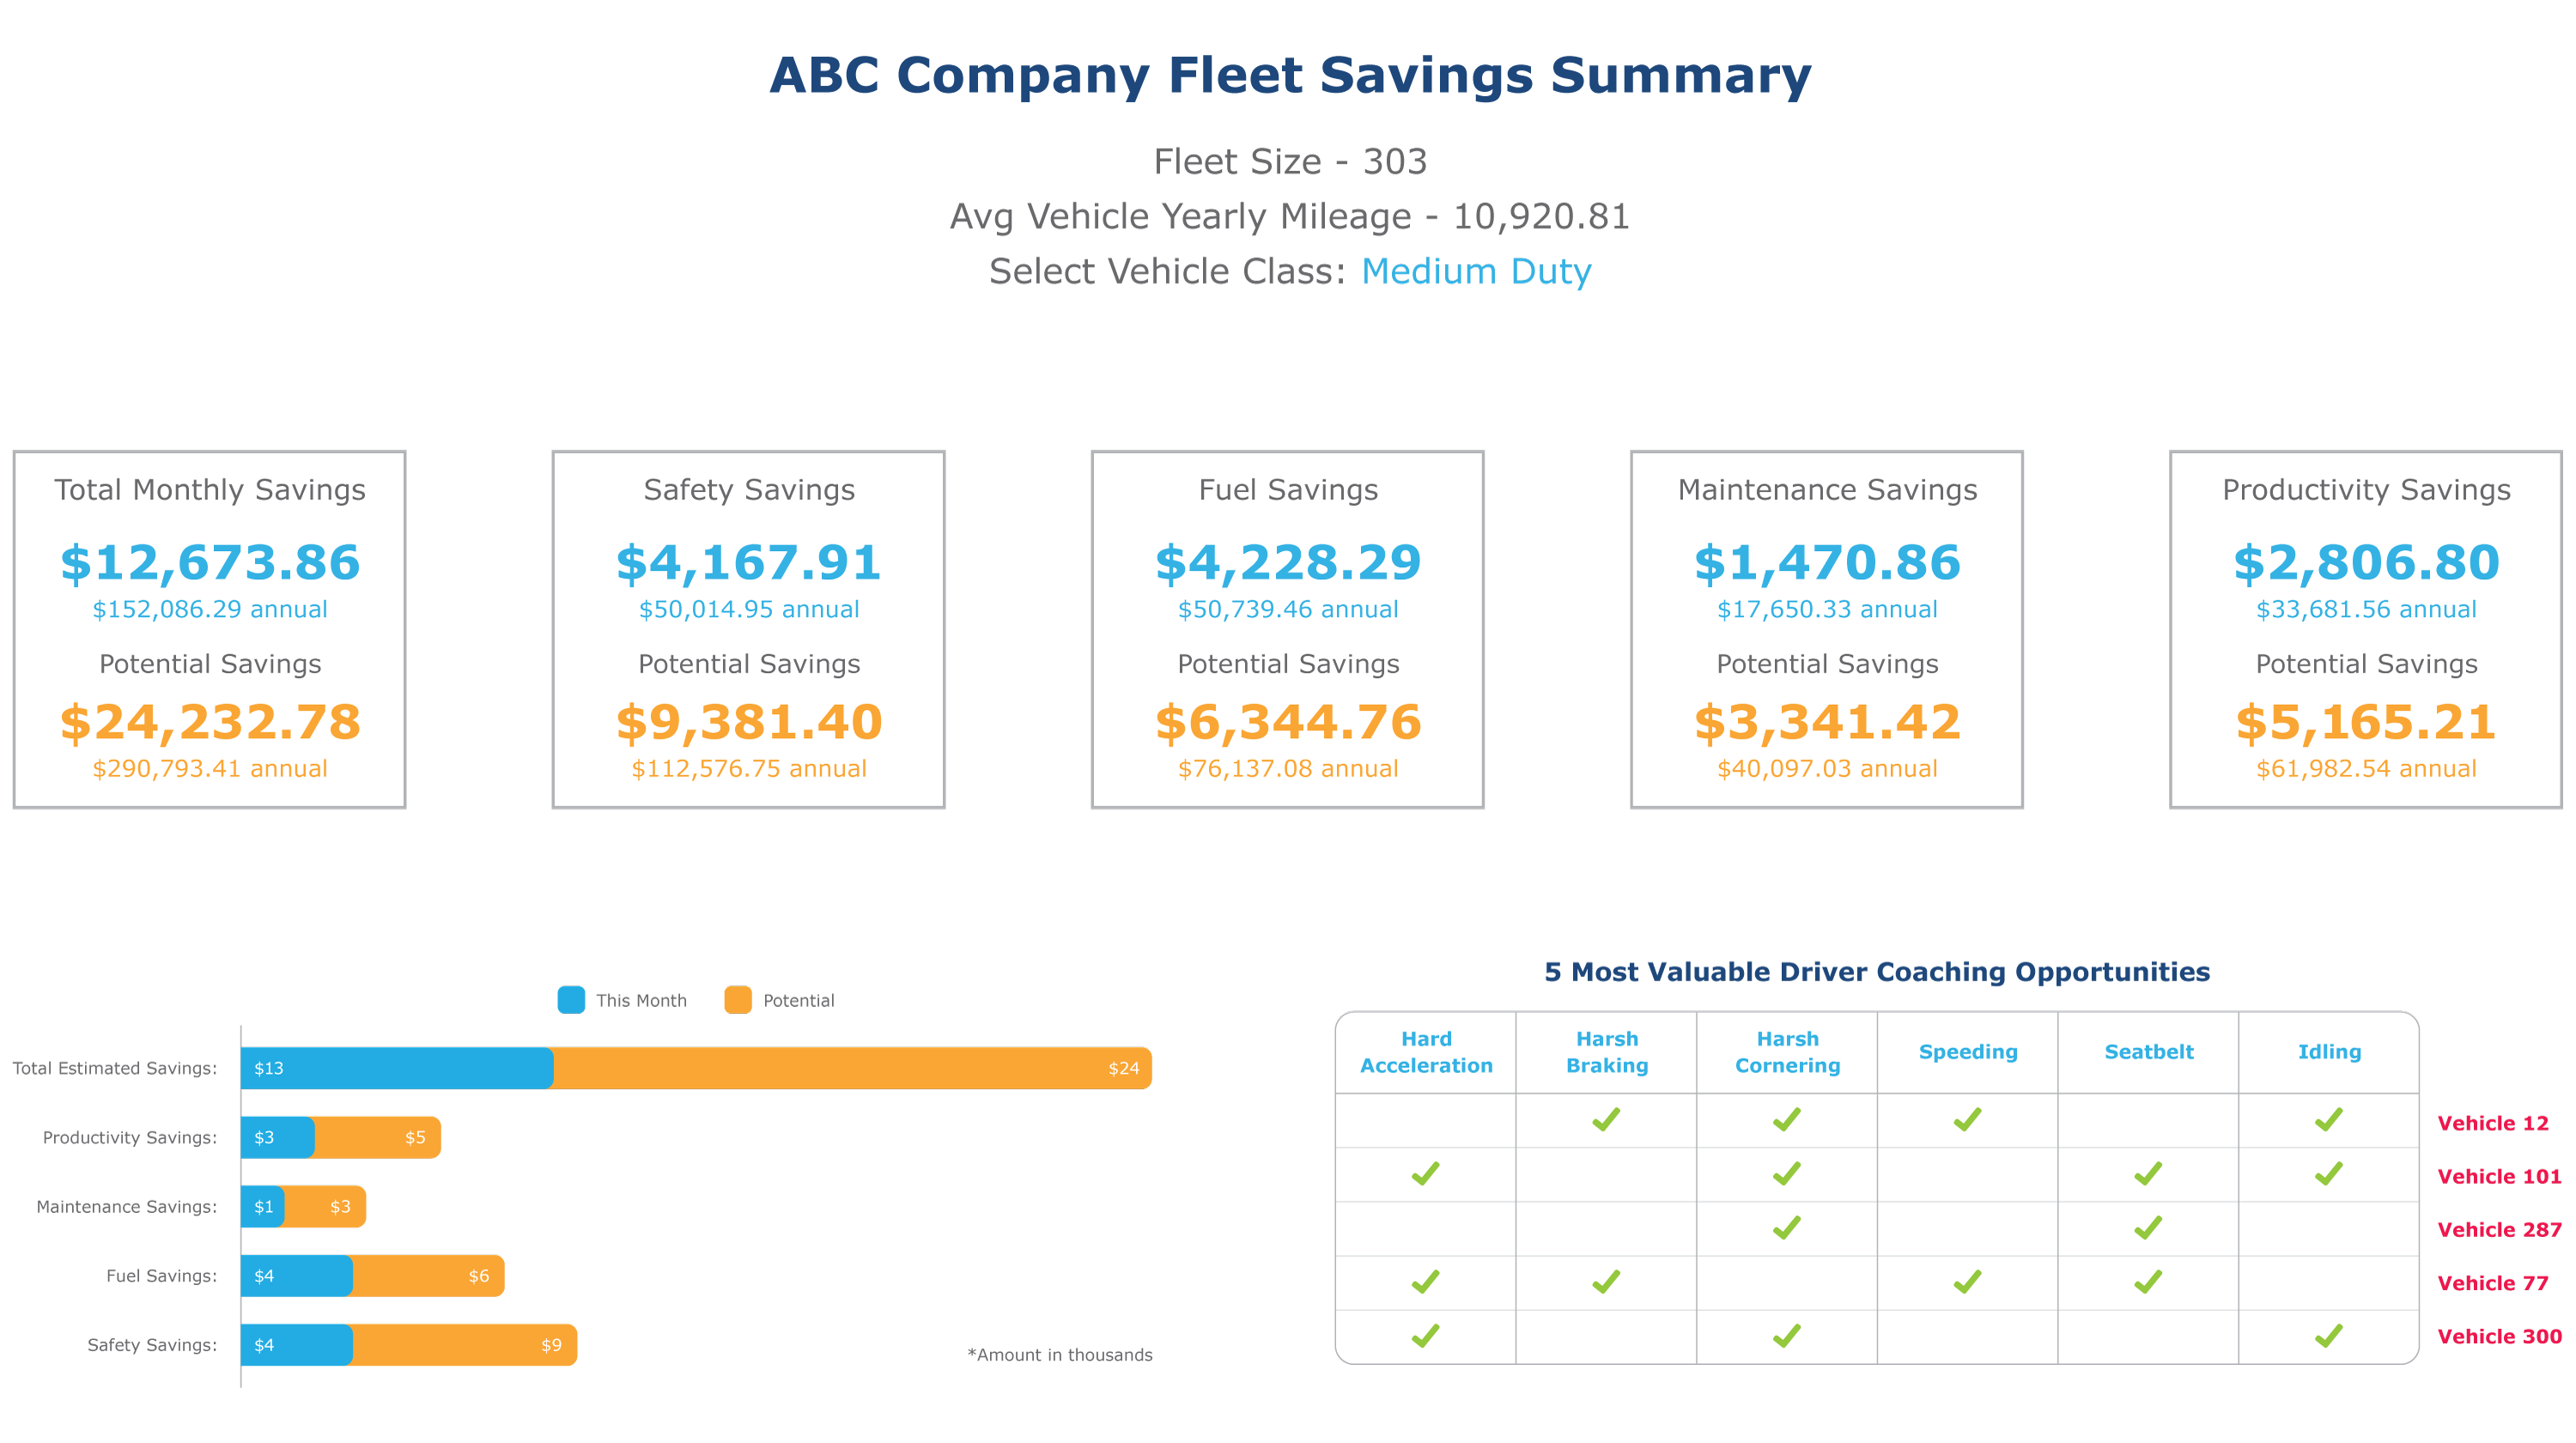
Introducing the Fleet Savings Summary Report
To help fleet managers assess their COI and identify strategic savings opportunities, Geotab created the free Fleet Savings Summary Report, which is available on the Geotab Marketplace.
The report illustrates a fleet’s existing and potential savings, and subsequently shows a fleet manager where to focus driver coaching efforts in order to minimize their fleet’s Total Cost of Ownership (TCO).
The Fleet Savings Summary Report breaks down a fleet’s cost saving opportunities into four categories: Safety, Fuel, Maintenance, and Productivity.
This tool allows fleet managers to quickly visualize their fleet’s performance, and more importantly, identify which drivers and/or savings categories should be targeted for improvement. Once these improvements have been implemented and the resulting benefits take effect, costs will decline, and profit margins will grow.
A lot of effort went into ensuring the accuracy of the information provided within the Fleet Savings Summary Report. This being said, it should be noted that the savings values within are highly normalized, and therefore are only applicable to a generic fleet.
For a generic fleet however, our research determined the existence of large telematics-related savings opportunities, as summarized in the table below.
Estimated Potential Monthly Telematics Savings Per Vehicle (USD):
Four ways fleets can reduce costs
As described above, there are four specific areas where savings can be found: safety, fuel, maintenance, and productivity. Let’s look at each in more detail.
- Safety (Reducing Costly Vehicle Collisions): Each work-related incident cost employers between $16,000 to $500,000 depending on their severity. Insurance companies have reported a 45% reduction in collisions and a 50% reduction in incidents payout costs via the effective use of telematics, with an additional 5% to 25% reduction in comprehensive insurance cost.
- Fuel (Controlling Runaway Fuel Costs): The U.S. Department of Energy reports that rapid acceleration and heavy braking can reduce fuel economy by up to 33% for highway driving and 5% on city roads; while idling and speeding can also have drastic impacts on MPG. Combined with effective driver coaching initiatives, telematics can minimize aggressive driving behaviours and reduce fuel costs by as much as 14%.
- Maintenance (Reducing Repairs and Maintenance): Planned maintenance is a standard part of vehicle ownership, but unplanned repairs due to aggressive driving and vehicle misuse are an unnecessary cost. In addition to the cost savings resulting from fewer scheduled maintenance appointments, a non-scheduled maintenance interruption can result in lost profits of between $400 to $700 per day. The Organization for Economic Co-operation and Development (OECD) reports that telematics technology can help a company reduce these scheduled and unscheduled maintenance and repair incidents by as much as 14%.
- Productivity (Increasing Workforce Efficiency): Driver compensation is often a large component of a fleet’s total operating budget. Market research suggests that telematics can increase workforce productivity and reduce labor costs by up to 12%.
The importance of driver coaching in fleet management
Proactive management of driver behavior is essential to any cost reduction exercise. By investing in driver coaching, and specifically focusing on the most costly drivers, a fleet can minimize their operating costs. Keep in mind that the drivers you need to target may change from month to month. That’s why using a telematics solution is essential, because it can objectively pinpoint the most costly or risky drivers based on numerous variables.
There are a variety of tools that can be used in driver coaching efforts, many of which are available from the Geotab Marketplace. Some examples include:
- Driver scorecard
- Top 5 Speeding Violations Reports
- Last 3 Months Fuel Trend Report
- Weekly Idle Cost Daily Trend Report
- GO TALK In-vehicle Verbal Feedback
- Mobileye Advanced Collision Prevention
Turn your fleet into a success story
Many of our more efficient customers are benefiting from these telematics savings, as can be seen at www.geotab.com/success-stories. These customers deploy telematics and use its rich data to closely monitor fleet assets and proactively manager driver behaviour.
These same savings can be achieved by any fleet manager who is committed to using their telematics solution to its full extent. By pursuing these cost reduction opportunities, fleet managers can reduce their COI, improve their operating efficiency, and grow their bottom line.
To help fleet managers proactively manage their fleet operations and realize the savings described above, Geotab offers a wide range of tools.
Fleet managers need to understand cost savings opportunities, read our white paper, “Increasing Fleet Profitability with Telematics: COI vs. ROI.”
Subscribe to get industry tips and insights
Frequently Asked Questions
ROI (Return on Investment) focuses on maximizing incremental revenue, while COI (Cost of Ignoring) measures the lost savings from not implementing efficiency improvements. For fleet managers, COI represents the incremental operating costs from improper use of telematics or failing to adopt the technology altogether. Both metrics share the same strategic objective — improving fleet profitability — but approach it from opposite directions.
Fleets can identify savings in four key categories: safety, fuel, maintenance, and productivity. Telematics can help reduce collision by up to 45%, decrease fuel consumption by as much as 14%, lower maintenance incidents by 14% and increase workforce productivity by up to 12%. Geotab's Fleet Savings Summary Report helps managers visualize performance and identify which areas offer the greatest cost reduction opportunities.
Proactive driver coaching is essential for cost reduction because it addresses behaviors that drive up expenses across safety, fuel, and maintenance categories. Telematics solutions can objectively identify the most costly or risky drivers based on multiple variables, allowing managers to target coaching efforts effectively. Geotab offers tools like driver scorecards, speeding violation reports, and in-vehicle feedback systems to support ongoing driver improvement initiatives.
Geotab's data shows significant monthly telematics-related savings opportunities across safety, fuel efficiency, maintenance planning, and productivity can substantially reduce a fleet's total cost of ownership. Insurance companies have reported 45% reductions in accidents and 50% reductions in accident payout costs through effective telematics use, with comprehensive insurance premiums dropping an additional 5–25%.
Vice President, Public Sector
Jean Pilon-Bignell uses a unique combination of technical and business experience to commercialize innovative connected-vehicle, IoT, and intelligent transportation solutions that maximize operating efficiency, safety and sustainability.
Table of Contents
Subscribe to get industry tips and insights
Related posts

Closing blind spots in cargo security with a 360 fleet camera system
July 22, 2026
3 minute read

The safest mile in field service is the one nobody drives
July 22, 2026
2 minute read

Best small fleet management software providers and how to choose one for your business
July 16, 2026
8 minute read
.jpg)
Marketplace Spotlight: Redefining Fleet Security with Matrix iQ
July 15, 2026
2 minute read