Fleet fuel monitoring: How it works and what to track
Fuel is one of the biggest costs fleets face, but the data needed to manage it already lives in your vehicles. Here is how to put those fuel numbers to work.

By Geotab
Nov 20, 2026
Key Insights
- Fleet fuel monitoring continuously measures fuel use and fill-ups, so you can spot waste early instead of weeks later.
- Most fleets pair telematics engine data with fuel card transactions and add in-tank sensors if they need to address theft.
- Separate true idling from power take-off (PTO) time and match card purchases to vehicle locations for some of the quickest savings.
- Set a baseline and start with wide alert thresholds, then narrow them as your data matures.
Most fleets know their total fuel spend to the dollar, but only a few can actually trace where that money went. Fleet fuel card statements arrive monthly, and idling reports mix productive and wasted engine use, so losses surface weeks later. Fleet fuel monitoring puts that information in front of your team while there's still time to act.
The cost of that blind spot adds up. The American Transportation Research Institute (ATRI) reports that fuel costs carriers an average of $0.482 per mile in 2025, out of an operating cost of $2.336 per mile. That puts fuel at 21% of the cost to run a truck, second only to driver pay.
Learn exactly how monitoring works and how to implement it fleet-wide to keep your operations running smoothly and efficiently.
What is fleet fuel monitoring?
Fleet fuel monitoring is the continuous measurement of how much fuel a vehicle burns and where that fuel comes from. A fuel monitoring system pulls data from engines, in-tank sensors, fuel card transactions and on-site storage tanks, then flags any readings outside of normal for that vehicle.
Many fleets treat monitoring and fleet fuel management as the same thing, but the two play different roles. Think of monitoring as the measurement layer. Fuel management is how your team decides what to do with that data, such as driver coaching or fuel purchasing policies.
Fuel monitoring also runs continuously rather than periodically. A month-end receipt reconciliation tells you what already went wrong. Continuous monitoring flags problems early enough for your team to fix them.
How does fleet fuel monitoring work?
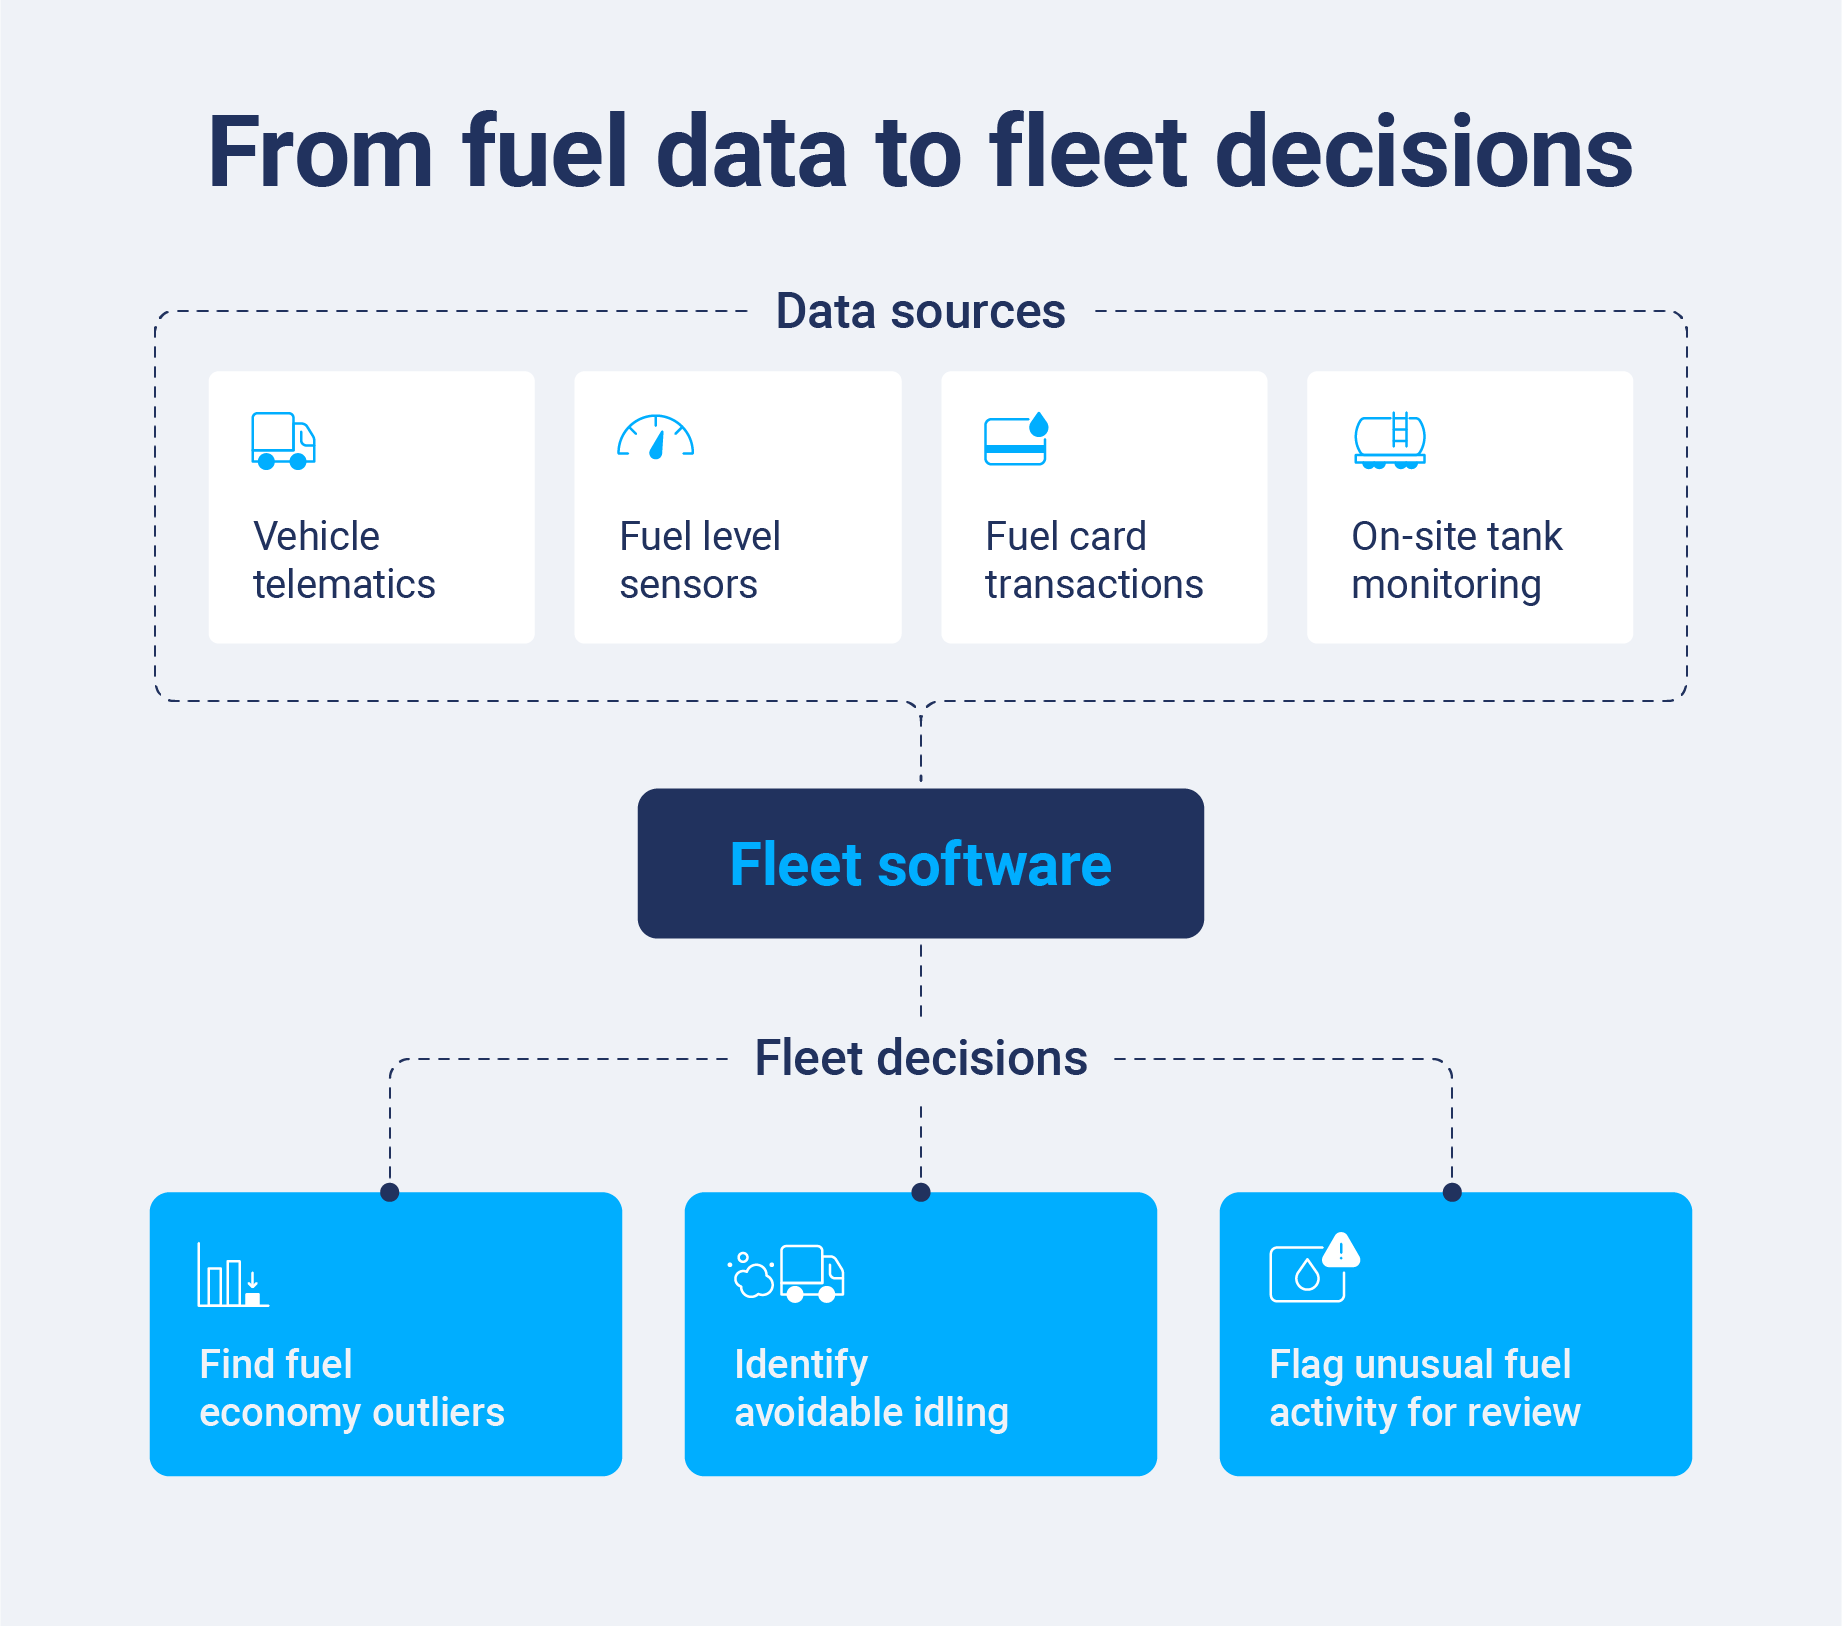
Fleet fuel monitoring uses a device in the vehicle or tank to capture data and send it to the cloud. Fleet software then turns those numbers into reports and alerts. Most fleets combine two or more of these four capture methods:
- Telematics and engine data
- Fuel level sensors and flow meters
- Fuel card transactions
- On-site tank monitoring
Telematics and engine data
A telematics device connects to the vehicle and reads fuel data from the engine through a Controller Area Network (CAN) bus. The CAN bus is the internal network that lets the engine, transmission and other vehicle systems share data.
This connection sits at the core of vehicle telematics. It reports total fuel consumed, fuel burned while idling, engine hours and fault codes.
The trade-off is that engine data measures what the engine burns. Many vehicles also report tank level, but often in coarse steps such as eighths of a tank. That level of detail is usually too rough to catch theft reliably on its own.
Fuel level sensors and flow meters
In-tank fuel level sensors measure the actual volume of fuel in the tank. Flow meters measure the fuel that passes from the tank to the engine. Together, they show what happens to fuel after it enters the tank. That adds detail a fuel tracking system cannot get from engine data alone.
These types of sensors work best in two situations: older vehicles or off-road equipment without a usable CAN bus, and any operation where tank theft is a serious concern. Many utility fleet management strategies pair in-tank sensors on generators and heavy equipment with engine data from trucks.
Fuel card and transaction data
Every fuel card swipe records spend, volume, location and time. Card data becomes far more useful once you match each transaction to vehicle data. If a card buys 40 gallons for a vehicle with a 25-gallon tank, or if a vehicle was 60 miles from the pump at the time of purchase, that transaction warrants a closer review.
The right fuel card makes this easier, since card data flows directly into your fleet software. Fuel Transactions in MyGeotab automates the matching. It checks each purchase against vehicle location, tank capacity, and fuel type then flags mismatches for review, so your team spends less time on month-end reconciliation.
On-site tank monitoring
This layer applies only to fleets with their own bulk tanks. Automated tank gauging (ATG) sensors sit inside the storage tank and report on fuel temperature and volume. Temperature matters because fuel expands and contracts, which can skew volume reports.
ATG data catches leaks and shrinkage (which accounts for the difference between fuel delivered and fuel dispensed). Per-vehicle data misses these losses because they happen before fuel reaches the truck. Fleets that fuel only at retail stations can skip this add-on.
What fuel data should you monitor?
These seven metrics cover most of what a fleet needs to spot waste and decide where to act first, such as which vehicles to service or which drivers to coach.
Metric | What it tells you: | What to do when it moves: |
| Fuel consumed per vehicle | Baseline spend by asset | Compare against similar vehicles to find outliers |
| Fuel economy in miles per gallon (MPG) by vehicle and class | Which assets are underperforming their peers | Check maintenance and driver behavior on low performers |
| True idling vs. power take-off (PTO) time | How much engine time is wasted vs. productive | Set idle limits and coach drivers |
| Fuel used while idling | The dollar value of avoidable idling | Start with the highest idle fuel users |
| Fill-up volume vs. tank capacity | Transaction mismatches and possible fraud | Review the purchase and tighten card controls |
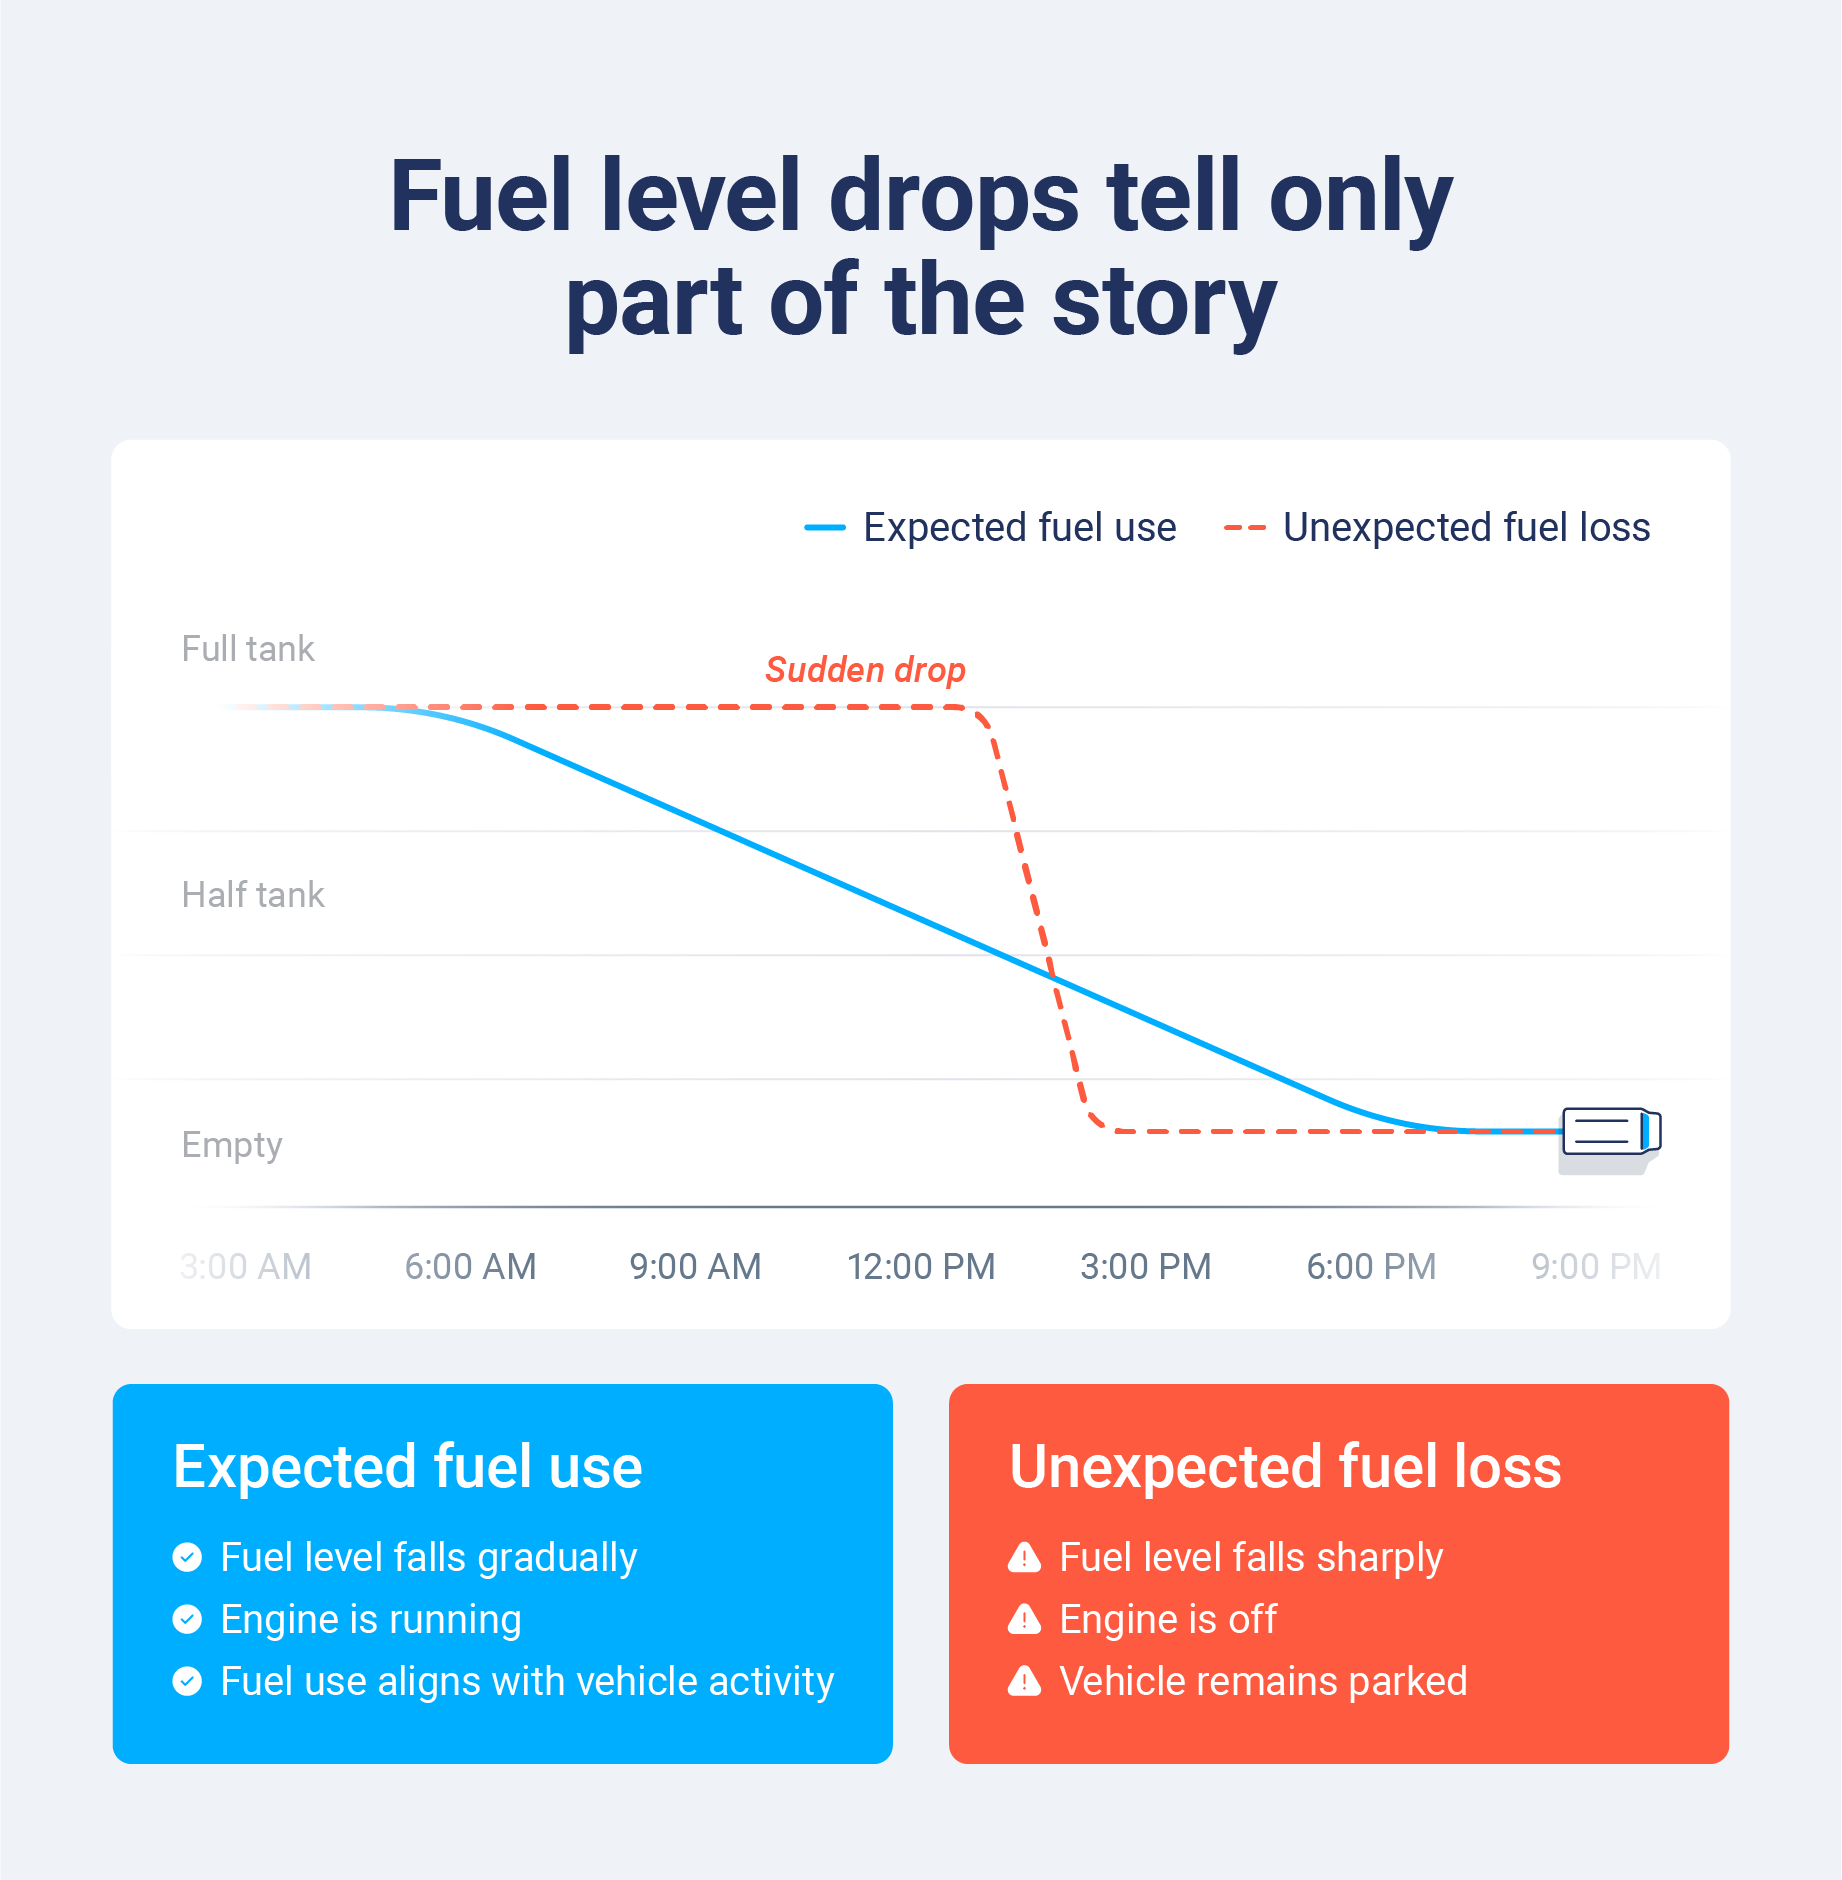
| Sudden fuel level drops | Possible siphoning | Check engine status and location history |
| Engine fault codes tied to fuel economy | Maintenance issues quietly costing MPG | Schedule an inspection early |
How to calculate fleet fuel efficiency
You can calculate fleet fuel efficiency using these four formulas. Calculate per vehicle first, then roll the results up to the fleet level.
- Vehicle MPG = Miles traveled ÷ Gallons consumed
- Fleet MPG = Total fleet miles traveled ÷ Total fleet gallons consumed
- Fuel cost per mile = Total fuel cost ÷ Total miles traveled
- Idle fuel percentage = Gallons used while idling ÷ Total gallons consumed x 100
Say a vehicle travels 1,000 miles, consumes 125 gallons and incurs $500 in fuel costs. Its fuel economy is 8 MPG, and its fuel cost is $0.50 per mile. If 10 of those gallons burned while idling, the vehicle's fuel idling percentage is 8%.
For fleet MPG, divide total miles by total gallons instead of averaging vehicle results. A simple average gives low-mileage vehicles as much weight as your busiest trucks.
How fuel monitoring catches theft and fuel card fraud
Theft and fraud are separate issues, so monitoring detects each differently. Geotab estimates that fuel cards not connected to telematics data can cost fleets up to 15% of their annual fuel spend through fraud, slippage, and inefficient fueling. Here is how theft and fraud differ:
- Physical theft: Someone siphons directly from the tank. In-tank level sensors catch this by showing a sharp drop while the engine is off and the vehicle is parked.
- Transaction fraud: This covers unauthorized card use, skimming at the pump, buying fuel for a personal vehicle and other out-of-policy purchases. Automated transaction matching flags suspicious purchases before the monthly statement arrives.
Alert thresholds need careful calibration. Poorly tuned alert thresholds create a flood of false alarms, teaching managers to ignore the system. Start with wide thresholds and tighten them as you learn what normal looks like for each vehicle.
Benefits of fleet fuel monitoring
The benefits extend beyond fuel budget once your team can work from daily fuel data.
Lower fuel spend
Vehicle-level fuel data shows which assets and driving habits burn the most. Vehicle-level data shows which assets and driving habits burn the most, so you can target and optimize your biggest losses first.
Less avoidable idling
Some idling is not wasteful. A bucket truck operating its boom or a dump truck raising its bed needs the engine running. Fuel monitoring tools that read power take-off (PTO) status from the vehicle can separate true idling from PTO time automatically. Once the two are split, the avoidable portion becomes clear.
Geotab data shows that the median heavy-duty truck idles 1.8 hours per operating day, burning about 1.8 gallons (6.9 liters) while stationary. At April 2026 diesel prices, Geotab put that cost at about $2,360 per vehicle per year.
Better maintenance decisions
A steady drop in MPG often signals a mechanical problem before a fault code appears. Underinflated tires, clogged air filters, dragging brakes and worn fuel injectors can all raise fuel consumption. When you connect fuel data to predictive maintenance, you can schedule repairs early and avoid unplanned downtime.
Cleaner emissions reporting
Fuel burn is the main input for most fleet emissions calculations. Accurate fuel data provides clear baselines for sustainability reports. It also makes it easier to measure the impact of reduced idling or investments in new electric vehicles (EVs).
Easier fuel tax reporting
Fleets that run qualified motor vehicles across state or provincial lines must file quarterly International Fuel Tax Agreement (IFTA) returns. Each return reports on fuel bought and miles driven in by jurisdiction. Qualified motor vehicles generally include trucks with two axles and a gross vehicle weight over 26,000 pounds, three or more axles regardless of weight.
Fairer driver coaching
Data replaces guesswork in driver coaching conversations. Managers can point to specific idle events or harsh acceleration to demonstrate how each driver compares with their peers. Clear numbers keep coaching fair, and the same reports make it easy to recognize top performers and support drivers who need help.
What to look for in a fuel monitoring system
Platforms differ in the types of data they capture and how well they connect with your existing systems. As you compare leading fuel management system tools, use this checklist to judge how well each option fits your fleet:
- Works with the vehicles you already run, including mixed and older assets
- Captures engine data and supports in-tank sensors where you need them
- Imports fuel card transactions automatically instead of relying on manual uploads
- Separates PTO activity from true idling
- Sends configurable alerts
- Benchmarks your results against comparable fleets
- Runs on an open platform with application programming interfaces (APIs) that connect fuel data to the rest of your fleet operation
How to start monitoring fuel across your fleet
These six steps work for fleets of every size looking to start monitoring organization-wide fuel usage. Small fleets can begin with a handful of vehicles and start from there.
- Set a baseline. Pull at least 30 days of fuel and idle data for each vehicle so you can accurately measure progress.
- Pick your capture method per asset. Use telematics on newer vehicles and add in-tank sensors where you need them.
- Connect fuel card data. Link your card provider to your fleet software so you can log each transaction with its corresponding vehicle data.
- Set alert thresholds (wide at first). Begin with generous limits and narrow them as alerts prove useful.
- Coach drivers with the data. Share idle and fuel economy results with each driver to show where they can improve and celebrate their progress.
- Benchmark and re-baseline quarterly. Compare results against similar fleets, then reset your baseline as routes and seasons change.
Monitor your fleet fuel with Geotab
Fleet fuel monitoring turns fuel from a cost you react to into something you can manage. MyGeotab offers engine data and fuel card transactions in one view, and the Geotab Fleet Card helps stop unauthorized purchases before they happen. Request a demo and talk to an expert about how this data can optimize your fleet's performance.
Subscribe to get industry tips and insights
Frequently Asked Questions
The best fuel monitoring system depends on the vehicles you run and the problems you need to solve. Look for a solution that combines engine data with fuel card transactions and separates PTO time from true idling. Geotab offers both in MyGeotab, plus an open platform that connects fuel data to the rest of your operation.
Start by measuring your fuel costs.Once you understand consumption and idle time, you can cut avoidable idling, coach drivers on wasteful habits, tighten fuel card controls and fix maintenance issues that drag down Miles per gallon (MPG).
Yes, fuel monitoring can work on older or mixed fleets. Telematics devices read engine data from most modern vehicles, while in-tank sensors or flow meters can track older vehicles or off-road equipment.
Fleet fuel monitoring detects theft by comparing what goes into the tank with what the engine burns. In-tank sensors flag sudden fuel level drops while the vehicle is parked, and the transaction matching flags fill-ups larger than the tank can hold.
Geotab team
Table of Contents
- What is fleet fuel monitoring?
- How does fleet fuel monitoring work?
- What fuel data should you monitor?
- How fuel monitoring catches theft and fuel card fraud
- Benefits of fleet fuel monitoring
- What to look for in a fuel monitoring system
- How to start monitoring fuel across your fleet
- Monitor your fleet fuel with Geotab
Subscribe to get industry tips and insights
Related posts
Fleet software comparison: How to choose the right solution for your business
November 16, 2026
4 minute read
GPS fleet tracking small businesses: A complete guide
November 11, 2026
8 minute read
How to start a trucking business: Step-by-step guide for owner operators
October 28, 2026
6 minute read

Garbage truck safety: Three questions for your video review process
October 28, 2026
4 minute read

How private haulers can help prepare their fleets for new waste management contracts
October 23, 2026
4 minute read